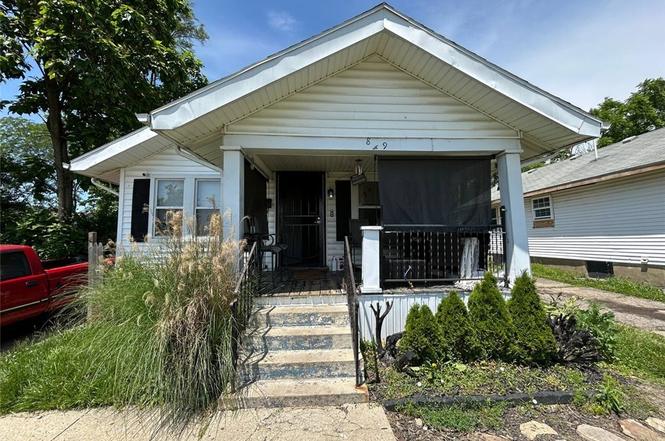
849 Blanche St · Dayton, OH
Flood risk No data
- FEMA flood zone
- —
- Chance of flooding over 30 yrs
- —
- Est. flood insurance / yr
- —
Fire risk No data
- Est. fire insurance / yr
- —
Heat risk No data
- Hot days now (above threshold)
- —
- Hot days in 30 yrs
- —
Wind risk No data
- Chance of severe wind over 30 yrs
- —
Air-quality risk No data
- Unhealthy air days now
- —
- Unhealthy air days in 30 yrs
- —
Risk factors via First Street. Map © Google.
Why this score? — see what drove the C+ grade
The composite is a weighted blend of 9 inputs, each scored 0–100. Each bar is that input's sub-score; the figure is the points it added to the 100-point composite (weight × sub-score).
- Cash flow +30.0/30.0
- 1% rule +10.0/10.0
- DSCR +10.0/10.0
- Rent growth +3.5/5.0
- Livability +3.2/5.0
- Condition / age +2.5/5.0
- Schools +1.3/10.0
- ARV discount +0.0/15.0
- Appreciation +0.0/10.0
$54,900
🖨 Deal sheet 📄 Offer letter ✓ Due diligence
Listing remarks
Affordable investment opportunity in Dayton! This 2 bedroom, 1 bath home offers great potential as a rental or portfolio addition. The property is in decent overall condition but would benefit from updates and cosmetic improvements throughout. With the right vision, this could be a strong income-producing property at an accessible price point. Sold as-is.
Key facts
- 1,799 sq ft lot
- 2 garage spots
- Built 1929
Property features AI
Finance
- Financial info: Offered for sale
Exterior
- Parking: Detached two-car garage
- Home design: One-story residence; Aluminum siding exterior
- Construction: Aluminum siding construction
- Exterior features: Small, irregular residential lot (~0.04 acres)
Interior
- Kitchen: Main-level kitchen (approx. 9 x 16)
- Bedrooms: Two main-level bedrooms (each about 9 x 14)
- Bathrooms: One full bathroom on the main level
- Heating & cooling: Forced air heating (natural gas); Central air conditioning
- Interior features: Full, unfinished basement; 5 total rooms
Neighborhood map
What this means for you Summary
Snapshot
- This is a 3-bed/1.0-bath single-family listed at $55k.
Deal economics
- At list price, monthly cash flow is $448 ($5k/yr) — positive.
- The deal already cash-flows at list — no discount required.
- Meets the 1% rule at list price ($1k rent vs $55k).
- Cap rate 16.1% vs local median 7.4% in Dayton — top-decile yield for the area; either an underpriced asset or a hidden risk that comps aren't pricing in. Stress-test before assuming the spread holds.
Location & tenants
- Location reads 65/100 on livability (#716 in OH) — a middle-class / working-renter tenant base. Strengths: cost of living A+, housing A+, health & safety A; Watch: schools C-, amenities C-, crime F.
- Dayton City (urban): math 12% / reading 21% proficiency, ranked #641 of 656 in OH (top 98%) — low school quality limits family demand, transient renter base, plan for 1-2y turnover; 74% free/reduced lunch — lower-income household profile, screen leases tightly.
- Market conditions: Rents rising fast (+4.1%/yr); 135 active listings in the ZIP; 14 comparable units currently listed for rent nearby; rentals at typical pace (median 21d on market — plan ~3-4 weeks tenant-placement turnaround); 43% of comp listings sitting > 30 days — soft ceiling on asking rent; lower-income renter base — watch delinquency; 907 units permitted in Montgomery County in 2024 (416 in 5+ unit buildings).
- This rent runs 35% of the median local income ($37k/yr) — at the standard rent-burdened threshold; future hikes will face affordability resistance.
Forward outlook
- Local home prices are declining (-3.0%/yr); year-one equity from $380 of loan paydown is wiped out by about $2k of value loss. Plan a longer hold.
- Montgomery County population projected at -10% by 2050 — secular population decline; favor cash flow + early exit over multi-decade hold.
- At projected returns (-3.0% appreciation + 4.1% rent growth), your $15k cash investment doubles in ~4 years — after that, you're playing with house money.
Negotiation context
- Only 3 days on market — expect competitive offers; lowballing is unlikely to land.
- 3 sale attempts since 12y ago with the ask held roughly flat each time — persistent listings suggest the price (not the market) is what's stuck; bring a comps-based counter.
- Current owner paid $40k; 37% above their basis — modest negotiation headroom, anchor on the comps not their cost.
Risks & watch-outs
- Watch-outs: built in 1929 — expect roof / HVAC / electrical / plumbing capex.
Questions for the listing agent
- Built in 1929 — when were the roof, HVAC, electrical panel, plumbing, and water heater last replaced?
- Is there a deadline driving the sale (1031 exchange, divorce, estate, relocation)? That informs how much negotiation room exists.
- Crime grade is F in this area — have there been break-ins, vandalism, or insurance claims at this property in the last 3 years? What carrier currently insures it and at what premium?
- What's the average days-on-market for RENTAL listings here right now (not sales)? A rising rental-DOM trend means longer vacancies and softer asking-rent achievability than the comps imply.
- What's the recent tenant-quality profile in this submarket — average credit score on applications, eviction rate, late-payment / NSF rate, and stable-employment percentage? A property-management company in the area should have these aggregated.
- How much new for-sale + rental construction is in the pipeline within 1–3 miles? Heavy new supply typically softens prices + rents 12–24 months out; constrained supply supports both.
Investment metrics
- 1% rule
- 1.94% ✓
- Cap rate
- 16.07%
- Cash-on-cash
- 34.94%
- DSCR
- 2.55
- GRM
- 4.3
CMA / ARV
- ARV (on-the-fly)
- $42,120
- Comps found
- 12
Show comp detail 12 sales within ~0.75 mi
| Address | Dist | Beds/Ba | Sqft | Sold | Price | $/sf | Match |
|---|---|---|---|---|---|---|---|
| 2932 Sage Ave | 0.19mi | 2/1.0 (-1) | 884 (+9%) | 0mo | $46,000 | $52 | 70 |
| 2922 Revels Ave | 0.22mi | 2/1.0 (-1) | 884 (+9%) | 5mo | $40,000 | $45 | 66 |
| 2823 Revels Ave | 0.14mi | 2/1.0 (-1) | 884 (+9%) | 13mo | $19,000 | $21 | 63 |
| 820 Ernroe Dr | 0.51mi | 3/1.0 | 864 (+7%) | 3mo | $45,000 | $52 | 62 |
| 3422 Haberer Ave | 0.34mi | 3/1.0 | 894 (+10%) | 6mo | $83,000 | $93 | 62 |
| 2320 Germantown St | 0.51mi | 2/1.0 (-1) | 836 (+3%) | 7mo | $36,800 | $44 | 60 |
| 714 Oakleaf Dr | 0.53mi | 2/1.0 (-1) | 825 (+2%) | 11mo | $69,900 | $85 | 58 |
| 809 Dennison Ave | 0.67mi | 3/1.0 | 872 (+8%) | 8mo | $62,500 | $72 | 50 |
| 3503 Modena St | 0.64mi | 3/1.5 | 912 (+13%) | 3mo | $45,000 | $49 | 44 |
| 737 Oakleaf Dr | 0.56mi | 2/1.0 (-1) | 887 (+10%) | 11mo | $41,000 | $46 | 44 |
| 925 Haller Ave | 0.55mi | 2/1.0 (-1) | 730 (-10%) | 14mo | $91,337 | $125 | 41 |
| 3512 Modena St | 0.66mi | 3/1.0 | 912 (+13%) | 10mo | $84,000 | $92 | 40 |
Match score weights: distance 35% · size 25% · config 20% · recency 20%. Top-matched comps best support the ARV.
Projected returns pro-forma
-3.0% appreciation · 4.06% rent growth · sell at horizon
- IRR
- 31.7%
- Equity multiple
- 2.35×
- Total profit
- $20,776
- Equity at exit
- $8,186
- IRR
- 39.4%
- Equity multiple
- 4.88×
- Total profit
- $59,692
- Equity at exit
- $4,747
Cash invested: $15,372 (down + closing). Projections, not guarantees.
Landlord ↔ Tenant lean methodology
- Overall (STATE)
- 73 Landlord-Friendly
- State Ohio
- 73 Landlord-Friendly · R+6
- County
- — inherits STATE
- City
- — inherits STATE
ZIP-level market 45417
- Home prices YoY
- -32.3%
- Rents YoY
- 4.1%
- Active inventory
- 135
- Price-to-rent
- 4.3×
Monthly cashflow live
- Estimated rent
- $1,063 high interval (Pro) →
- Mortgage (P&I)
- −$288
- Tax from tax record
- −$81 /mo · $975/yr
- Insurance
- −$23
- HOA
- −$0
- Vacancy / Maint / Mgmt
- −$223
- Net cashflow
- $448
Break-even live
UW: 25.0% down · 7.5% · 30yr · 1.5% tax · 5.0% vac · 8.0% maint · 8.0% mgmt
Financing live
Cash to close
- Down payment
- $13,725
- Closing costs
- $1,647
- Reserves months
- —
- Total cash needed
- —
Loan-product check · same deal, 3 products live
Conventional
25% down · 7.5% · 30yr
- Down + closing
- —
- Monthly P&I
- —
- Monthly cashflow
- —
- DSCR
- —
- Eligible?
- —
Personal DTI + credit; lowest rate.
DSCR
20% down · 8.5% · 30yr
- Down + closing
- —
- Monthly P&I
- —
- Monthly cashflow
- —
- DSCR
- —
- Eligible?
- —
No personal income docs; deal must DSCR.
Hard money
10% down · 12.0% · 12mo
- Down + closing
- —
- Monthly P&I
- —
- Monthly cashflow
- —
- DSCR
- —
- Eligible?
- —
Short-term bridge; refi at stabilization.
Rent comps 14 comps
| Address | Beds | Baths | Sqft | Rent | $/sqft | DOM | Units | Dist |
|---|---|---|---|---|---|---|---|---|
| 500 Bowie Dr Unit 122 Dayton, OH | 2.0 | 1.0 | 850 | $910 | $1.07 | 43d | 1 | 0.38mi |
| 342 Lookout Ave Dayton, OH | 2.0 | 1.0 | 800 | $750 | $0.94 | 2d | 1 | 0.61mi |
| 342 Lookout Ave Dayton, OH | 2.0 | 1.0 | 800 | $775 | $0.97 | 43d | 1 | 0.61mi |
| 2240 Lakeview Ave Dayton, OH | 3.0 | 1.0 | 1056 | $1,025 | $0.97 | 43d | 1 | 0.62mi |
| 3939 Nicholas Rd Dayton, OH | 3.0 | 1.0 | 912 | $1,200 | $1.32 | 43d | 1 | 0.70mi |
| 652 Dennison Ave Dayton, OH | 2.0 | 2.0 | 988 | $1,095 | $1.11 | 21d | 1 | 0.76mi |
| 1272 Clement Ave Dayton, OH | 3.0 | 1.0 | 1025 | $1,350 | $1.32 | 2d | 1 | 0.77mi |
| 673 Randolph St Dayton, OH | 2.0 | 1.0 | 792 | $950 | $1.20 | 43d | 1 | 0.77mi |
| 3964 Nicholas Rd Dayton, OH | 3.0 | 1.0 | 912 | $1,000 | $1.10 | 3d | 1 | 0.77mi |
| 137 Westwood Ave Dayton, OH | 2.0 | 1.0 | 784 | $900 | $1.15 | 3d | 1 | 1.01mi |
| 70 Gramont Ave Dayton, OH | 3.0 | 1.5 | 966 | $1,300 | $1.35 | 2d | 1 | 1.04mi |
| 41 N Marion St Dayton, OH | 2.0 | 1.0 | 652 | $925 | $1.42 | 3d | 1 | 1.14mi |
| 1515 W Stewart St Dayton, OH | 2.0 | 1.0 | 925 | $1,000 | $1.08 | 43d | 1 | 1.16mi |
| 4109 Midway Ave Dayton, OH | 3.0 | 1.0 | 971 | $1,000 | $1.03 | 3d | 1 | 1.18mi |
Listing history 4 events
-
2026-06-18days on market $54,900 Active 3 DOM
-
2026-06-17days on market $54,900 Active 2 DOM
-
2026-06-15remarks 357-char remark
-
2026-06-15$54,900 Active 1 DOM
ⓘ Source: listings_history table (triggers on properties + properties_extension) + one-shot
backfill from property_details.listing_events for pre-trigger history.
Tax reassessment forecast OH · Partial reset (capped growth)
- Current annual tax
- $975 · $81/mo
- Projected year-2 tax
- $975 · $81/mo
- Expected delta
- $0/yr ($0/mo · 0.0%)
ⓘ Screening estimate from a state-policy table — verify with the county assessor before closing.
Nearby sold comps map
Loading sold comps map…
Walkable amenities ~0.75 mi
Loading nearby amenities…
Taxation est. · year 1
- Rental income
- $12,753
- − Mortgage interest
- −$3,075
- − Property taxes
- −$975
- − Insurance
- −$274
- − Repairs & maintenance
- −$1,020
- − Management
- −$1,020
- − Depreciation
- −$1,597
- Taxable income
- $4,790
- Est. tax owed @ 24.0%
- −$1,150
- After-tax cash flow
- $4,221/yr
For passive investors: Depreciation is non-cash, so a rental often shows a tax loss while cash-flowing — sheltering income. Rental losses are passive: they offset passive income freely, and up to $25,000/yr can offset ordinary (W-2) income if you actively participate and your MAGI is under $100k (phasing out to $0 by $150k); unused losses carry forward. On sale, claimed depreciation is recaptured at up to 25%, and gains may owe capital-gains tax (a 1031 exchange can defer both). Figures are a year-1 estimate at your 24.0% rate — not tax advice; consult a CPA.
Schools (NCES district)
- District
- Dayton City
- NCES district ID
- 3904384
- Math proficiency
- 12% ▼ -12.00%
- Reading proficiency
- 21% ▼ -11.00%
- Median HH income
- $28,688
- Composite
- 12.94/100
- National rank
- #9579
- State rank
- #641 of 656 in OH
Livability — Dayton
- Score
- 65/100
- State rank
- #716
- US rank
- #12895
Category grades
Schools grade is shown separately in the Schools card above.
Census & demographics
- Census place
- Dayton, OH
- County
- Montgomery County · 459,541 people
- City population
- 164,387
- Metro
- Dayton-Kettering, OH
- Population (ZIP)
- 28,186
- Household income
- $36,945
- Rent vs Own
- Severe rent burden
- 1822.0
Population outlook (Montgomery County) Hauer SSP2
- Today (2025)
- 523,241 people
- By 2030
- 514,948 · -1.6%
- By 2040
- 493,378 · -5.7%
- By 2050
- 469,639 · -10.2%
- By 2075
- 418,360 · -20.0%
- By 2100
- 353,315 · -32.5%
Race, ethnicity, and origin ACS 2023
- Neighborhood character
- Predominantly Black (71%)
- Race & ethnicity
- Black 71% White 20% Two or more races 8% Hispanic / Latino 3%
- Common ancestry
- Romanian 0%
- Foreign-born
- 3% · Canada
- Languages at home
- 96% English-only · Spanish 2% French/Haitian/Cajun 1%
Political lean MEDSL · Montgomery
- 2024 margin
- Toss-up / Even · D 49.8% · R 49.3%
- 2008→2024 swing
- -5.8pp toward R · 2008: 6.2pp · 2024: 0.5pp
- All cycles
- 2024: D+0.5 2020: D+2.2 2016: R+1.2 2012: D+3.1 2008: D+6.2
Not yet ingested
- Civics
- —
Market trends
- HPI YoY
- ▼ -92.43%
- Current HPI
- 193.4175
- Rent YoY
- ▲ 4.06%
- Metro
- Dayton-Kettering, OH
- State GDP YoY
- ▲ 1.98%
- F500 in state
- 48
Industry mix (Fortune 500 HQ in OH)
| Industry | F500 HQs | Revenue |
|---|---|---|
| Insurance | 3 | $145B |
|
||
| Industrial Machinery | 3 | $49B |
|
||
| Financial Services | 3 | $24B |
|
||
| Consumer Goods | 2 | $93B |
|
||
| Aerospace / Defense | 2 | $47B |
|
||
| Utilities | 2 | $33B |
|
||
Price history
+357.5% since first listed12 events — show timeline
- 2026-06-15 Listed $54,900 Dayton MLS
- 2015-12-07 Listing Removed — Dayton MLS
- 2015-07-07 Price Changed $9,900 Dayton MLS
- 2015-06-10 Price Changed $11,900 Dayton MLS
- 2015-06-03 Listed $14,900 Dayton MLS
- 2014-04-10 Listing Removed — Dayton MLS
- 2014-02-21 Listed $44,900 Dayton MLS
- 2013-10-09 Sold (Public Records) $40,000 Public Records
- 2002-09-27 Sold (Public Records) $62,000 Public Records
- 2000-06-07 Sold (Public Records) $15,000 Public Records
- 2000-04-14 Sold (Public Records) $18,000 Public Records
- 1978-11-15 Sold (Public Records) $12,000 Public Records
Property tax history
+1.1%/yrLatest (2025): $975 · -0.2% YoY. Source: county tax records.
Cash-flow waterfall
monthlySold comps — $/sqft
last 12 mo · ≤1 miLoading sold comps…