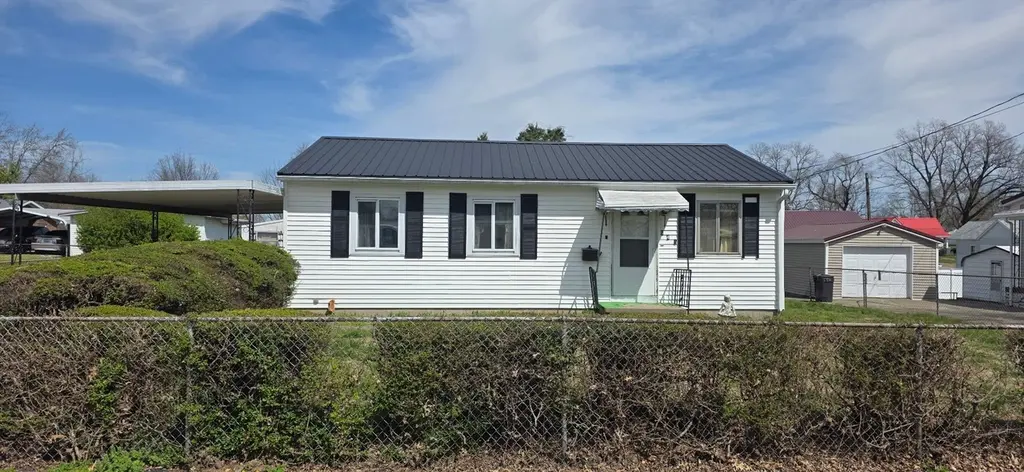
641 Short Culver St · Morganfield, KY
Flood risk 1/10 · Minimal
- FEMA flood zone
- X (unshaded)
- Chance of flooding over 30 yrs
- 0.0%
- Est. flood insurance / yr
- $507 – $1,088
Fire risk 1/10 · Minimal
- Est. fire insurance / yr
- $839 – $1,559
Heat risk 5/10 · Moderate
- Hot days now (above 108°F)
- 7 days/yr
- Hot days in 30 yrs
- 20 days/yr
Wind risk 3/10 · Minor
- Chance of severe wind over 30 yrs
- 6.0%
Air-quality risk 2/10 · Minimal
- Unhealthy air days now
- 0 days/yr
- Unhealthy air days in 30 yrs
- 2 days/yr
Risk factors via First Street. Map © Google.
Why this score? — see what drove the B- grade
The composite is a weighted blend of 9 inputs, each scored 0–100. Each bar is that input's sub-score; the figure is the points it added to the 100-point composite (weight × sub-score).
- Cash flow +25.5/30.0
- ARV discount +15.0/15.0
- DSCR +8.4/10.0
- 1% rule +5.7/10.0
- Appreciation +4.2/10.0
- Livability +3.2/5.0
- Rent growth +2.5/5.0
- Condition / age +2.5/5.0
- Schools +2.2/10.0
$79,999
🖨 Deal sheet 📄 Offer letter ✓ Due diligence
Listing remarks
Welcome home to 641 Short Culver St, Morganfield, KY! This charming 3-bedroom, 1-bathroom home is move-in ready and waiting for its next family to make lasting memories. Featuring beautiful new flooring throughout, this well-maintained property sits on a spacious . 23-acre lot with a stunning backyard — perfect for entertaining, gardening, or simply enjoying the outdoors. Conveniently located just minutes from downtown Morganfield, you’ll have easy access to local shops, dining, and everything the community has to offer. Families will love being zoned for Morganfield Elementary School, making the morning routine a breeze. Whether you’re a first-time buyer or looking to do
Key facts
- New flooring
- Stunning backyard
- Spacious lot
Tags
Property features AI
Exterior
- Parking: Garage (1 car); Concrete parking; On-street parking
- Utilities: Public water; Public sewer
- Home design: Single family residence; Residential property; One story
- Construction: Vinyl siding
- Exterior features: Chain link fencing; Shingle roof
Interior
- Bedrooms: 3 bedrooms on the main level
- Flooring: Laminate; Wood
- Bathrooms: 1 full bathroom on the main level
- Heating & cooling: Central air conditioning; Forced air heating
- Interior features: Window coverings; Laminate and wood flooring
Neighborhood map
What this means for you Summary
Snapshot
- This is a 2-bed/1.0-bath single-family listed at $80k.
Deal economics
- At list price, monthly cash flow is $185 ($2k/yr) — positive.
- The deal already cash-flows at list — no discount required.
- Meets the 1% rule at list price ($854 rent vs $80k).
- Recommended offer: $79k (1.5% below list) — sets the bar for market timing.
Location & tenants
- Location reads 63/100 on livability (#336 in KY) — a middle-class / working-renter tenant base. Strengths: crime A+, cost of living A+, housing A+; Watch: amenities F, commute F, employment D-.
- Union County (rural): math 20% / reading 33% proficiency, ranked #134 of 165 in KY (top 81%) — low school quality limits family demand, transient renter base, plan for 1-2y turnover.
- Zoned schools: Morganfield Elementary School (math 22% / reading 17%, grade F, #572 of 676 statewide, top 88%, 307 students, 71% FRL); Union County Middle School (math 15% / reading 36%, grade F, #181 of 217 statewide, top 84%, 437 students, 58% FRL); Union County High School (math 22% / reading 42%, grade F, #97 of 254 statewide, top 46%, 630 students, 50% FRL).
- Market conditions: 19 active listings in the ZIP.
Forward outlook
- Local home prices are declining (-1.6%/yr); year-one equity from $553 of loan paydown is wiped out by about $1k of value loss. Plan a longer hold.
- Union County population projected at -18% by 2050 — secular population decline; favor cash flow + early exit over multi-decade hold.
- At projected returns (-1.6% appreciation + 3.0% rent growth), your $22k cash investment doubles in ~9 years — after that, you're playing with house money.
Negotiation context
- It's been on market 19 days — a 2% lower offer ($79k) is reasonable based on typical stale-listing flexibility.
Risks & watch-outs
- Climate carrying-cost: extreme-heat days projected 7→20/yr by 2055 (HVAC capex compounding) — expect insurance premiums to compound above CPI over the hold.
Questions for the listing agent
- Is there a deadline driving the sale (1031 exchange, divorce, estate, relocation)? That informs how much negotiation room exists.
- Schools are F-rated, which usually means shorter tenancies and higher turnover. Who's the typical renter profile here, and what's been the actual vacancy rate?
- What's the average days-on-market for RENTAL listings here right now (not sales)? A rising rental-DOM trend means longer vacancies and softer asking-rent achievability than the comps imply.
- What's the recent tenant-quality profile in this submarket — average credit score on applications, eviction rate, late-payment / NSF rate, and stable-employment percentage? A property-management company in the area should have these aggregated.
- How much new for-sale + rental construction is in the pipeline within 1–3 miles? Heavy new supply typically softens prices + rents 12–24 months out; constrained supply supports both.
Investment metrics
- 1% rule
- 1.07% ✓
- Cap rate
- 9.07%
- Cash-on-cash
- 9.94%
- DSCR
- 1.44
- GRM
- 7.8
CMA / ARV
- ARV (on-the-fly)
- $122,688
- Comps found
- 1
Show comp detail 1 sale within ~0.75 mi
| Address | Dist | Beds/Ba | Sqft | Sold | Price | $/sf | Match |
|---|---|---|---|---|---|---|---|
| 443 N Townsend St | 0.67mi | 3/1.0 (+1) | 984 (+14%) | 7mo | $140,000 | $142 | 35 |
Match score weights: distance 35% · size 25% · config 20% · recency 20%. Top-matched comps best support the ARV.
Projected returns pro-forma
-1.56% appreciation · 3.0% rent growth · sell at horizon
- IRR
- 3.9%
- Equity multiple
- 1.17×
- Total profit
- $3,771
- Equity at exit
- $17,192
- IRR
- 11.1%
- Equity multiple
- 2.02×
- Total profit
- $22,902
- Equity at exit
- $16,304
Cash invested: $22,400 (down + closing). Projections, not guarantees.
Landlord ↔ Tenant lean methodology
- Overall (STATE)
- 83 Strongly Landlord-Friendly
- State Kentucky
- 83 Strongly Landlord-Friendly · R+16
- County
- — inherits STATE
- City
- — inherits STATE
ZIP-level market 42437
- Home prices YoY
- -0.7%
- Active inventory
- 19
- Price-to-rent
- 7.8×
Monthly cashflow live
- Estimated rent
- $854 medium interval (Pro) →
- Mortgage (P&I)
- −$420
- Tax from tax record
- −$37 /mo · $439/yr
- Insurance
- −$33
- HOA
- −$0
- Vacancy / Maint / Mgmt
- −$179
- Net cashflow
- $185
Break-even live
UW: 25.0% down · 7.5% · 30yr · 1.5% tax · 5.0% vac · 8.0% maint · 8.0% mgmt
Financing live
Cash to close
- Down payment
- $20,000
- Closing costs
- $2,400
- Reserves months
- —
- Total cash needed
- —
Loan-product check · same deal, 3 products live
Conventional
25% down · 7.5% · 30yr
- Down + closing
- —
- Monthly P&I
- —
- Monthly cashflow
- —
- DSCR
- —
- Eligible?
- —
Personal DTI + credit; lowest rate.
DSCR
20% down · 8.5% · 30yr
- Down + closing
- —
- Monthly P&I
- —
- Monthly cashflow
- —
- DSCR
- —
- Eligible?
- —
No personal income docs; deal must DSCR.
Hard money
10% down · 12.0% · 12mo
- Down + closing
- —
- Monthly P&I
- —
- Monthly cashflow
- —
- DSCR
- —
- Eligible?
- —
Short-term bridge; refi at stabilization.
Listing history 15 events
-
2026-06-18days on market $79,999 Active 19 DOM
-
2026-06-17days on market $79,999 Active 18 DOM
-
2026-06-16days on market $79,999 Active 17 DOM
-
2026-06-15days on market $79,999 Active 16 DOM
-
2026-06-13days on market $79,999 Active 14 DOM
-
2026-06-12days on market $79,999 Active 13 DOM
-
2026-06-09days on market $79,999 Active 10 DOM
-
2026-06-08days on market $79,999 Active 9 DOM
-
2026-06-07days on market $79,999 Active 8 DOM
-
2026-06-07days on market $79,999 Active 7 DOM
-
2026-06-04days on market $79,999 Active 4 DOM
-
2026-06-02days on market $79,999 Active 3 DOM
-
2026-06-01days on market $79,999 Active 2 DOM
-
2026-05-31remarks 681-char remark
-
2026-05-31$79,999 Active 1 DOM
ⓘ Source: listings_history table (triggers on properties + properties_extension) + one-shot
backfill from property_details.listing_events for pre-trigger history.
Tax reassessment forecast KY · Resets to sale price
- Current annual tax
- $439 · $37/mo
- Projected year-2 tax
- $688 · $57/mo
- Expected delta
- +$249/yr (+$21/mo · 56.8%)
ⓘ Screening estimate from a state-policy table — verify with the county assessor before closing.
Climate risk First Street
- Flood 1/10 Low FEMA zone X (unshaded) · 0% chance over 30 yrs
- Wildfire 1/10 Low
- Heat 5/10 Major 7 d/yr ≥108°F today · 20 d/yr by 30 yrs out
- Wind 3/10 Moderate 6% chance of damaging wind over 30 yrs
- Air quality 2/10 Low 0 unhealthy d/yr today · 2 by 30 yrs out
Nearby sold comps map
Loading sold comps map…
Walkable amenities ~0.75 mi
Loading nearby amenities…
Taxation est. · year 1
- Rental income
- $10,251
- − Mortgage interest
- −$4,481
- − Property taxes
- −$439
- − Insurance
- −$400
- − Repairs & maintenance
- −$820
- − Management
- −$820
- − Depreciation
- −$2,327
- Taxable income
- $964
- Est. tax owed @ 24.0%
- −$231
- After-tax cash flow
- $1,994/yr
For passive investors: Depreciation is non-cash, so a rental often shows a tax loss while cash-flowing — sheltering income. Rental losses are passive: they offset passive income freely, and up to $25,000/yr can offset ordinary (W-2) income if you actively participate and your MAGI is under $100k (phasing out to $0 by $150k); unused losses carry forward. On sale, claimed depreciation is recaptured at up to 25%, and gains may owe capital-gains tax (a 1031 exchange can defer both). Figures are a year-1 estimate at your 24.0% rate — not tax advice; consult a CPA.
Schools (NCES district)
- District
- Union County
- NCES district ID
- 2105640
- Math proficiency
- 20% ▼ -20.00%
- Reading proficiency
- 33% ▼ -20.00%
- Median HH income
- $39,776
- Composite
- 22.27/100
- National rank
- #8139
- State rank
- #134 of 165 in KY
Livability — Morganfield
- Score
- 63/100
- State rank
- #336
- US rank
- #15964
Category grades
Schools grade is shown separately in the Schools card above.
Census & demographics
- Census place
- Morganfield, KY
- Population (ZIP)
- 7,250
Population outlook (Union County) Hauer SSP2
- Today (2025)
- 15,038 people
- By 2030
- 14,681 · -2.4%
- By 2040
- 13,607 · -9.5%
- By 2050
- 12,406 · -17.5%
- By 2075
- 9,720 · -35.4%
- By 2100
- 7,841 · -47.9%
Race, ethnicity, and origin ACS 2023
- Neighborhood character
- Predominantly White (84%)
- Race & ethnicity
- White 84% Black 10% Two or more races 3% Hispanic / Latino 2%
- Common ancestry
- Italian 7% Lithuanian 2% Slovak 1%
- Foreign-born
- 1% · Canada
- Languages at home
- 98% English-only · Spanish 1% Other Asian/Pacific 1%
Political lean MEDSL · Union
- 2024 margin
- Solid R (+58.3) · D 20.2% · R 78.5% · Other 1.2%
- 2008→2024 swing
- -53.1pp toward R · 2008: -5.2pp · 2024: -58.3pp
- All cycles
- 2024: R+58.3 2020: R+52.2 2016: R+54.3 2012: R+33.6 2008: R+5.2
Not yet ingested
- Civics
- —
Market trends
- HPI YoY
- ▼ -1.56%
- Current HPI
- 222.4762
- Rent YoY
- —
- Metro
- —
- State GDP YoY
- ▲ 1.81%
- F500 in state
- 4
Industry mix (Fortune 500 HQ in KY)
| Industry | F500 HQs | Revenue |
|---|---|---|
| Healthcare | 1 | $118B |
|
||
| Food / Beverage | 1 | $7B |
|
||
Price history
1 event — show timeline
- 2026-05-30 Listed $79,999 HABOR
Property tax history
+4.8%/yrLatest (2025): $439 · -1.1% YoY. Source: county tax records.
Cash-flow waterfall
monthlySold comps — $/sqft
last 12 mo · ≤1 miLoading sold comps…