 Fourplex
3131 33 Dauphine St · New Orleans, LA
Flood risk 7/10 · Major
- FEMA flood zone
- X
- Chance of flooding over 30 yrs
- 0.74%
- Est. flood insurance / yr
- $507 – $1,088
Fire risk 1/10 · Minimal
- Est. fire insurance / yr
- $1,269 – $2,357
Heat risk 10/10 · Severe
- Hot days now (above 108°F)
- 7 days/yr
- Hot days in 30 yrs
- 22 days/yr
Wind risk 10/10 · Severe
- Chance of severe wind over 30 yrs
- 99.0%
Air-quality risk 3/10 · Minor
- Unhealthy air days now
- 3 days/yr
- Unhealthy air days in 30 yrs
- 3 days/yr
Risk factors via First Street. Map © Google.
Why this score? — see what drove the C+ grade
The composite is a weighted blend of 9 inputs, each scored 0–100. Each bar is that input's sub-score; the figure is the points it added to the 100-point composite (weight × sub-score).
- Cash flow +27.0/30.0
- DSCR +9.4/10.0
- ARV discount +7.5/15.0
- 1% rule +6.5/10.0
- Livability +4.0/5.0
- Rent growth +3.1/5.0
- Condition / age +2.5/5.0
- Schools +1.6/10.0
- Appreciation +0.0/10.0
$749,000
🖨 Deal sheet 📄 Offer letter ✓ Due diligence
Multi-family units
County records classify this as Multi-Family (2-4 Unit). Listing-text estimate: 4 units. confirmed
Listing remarks
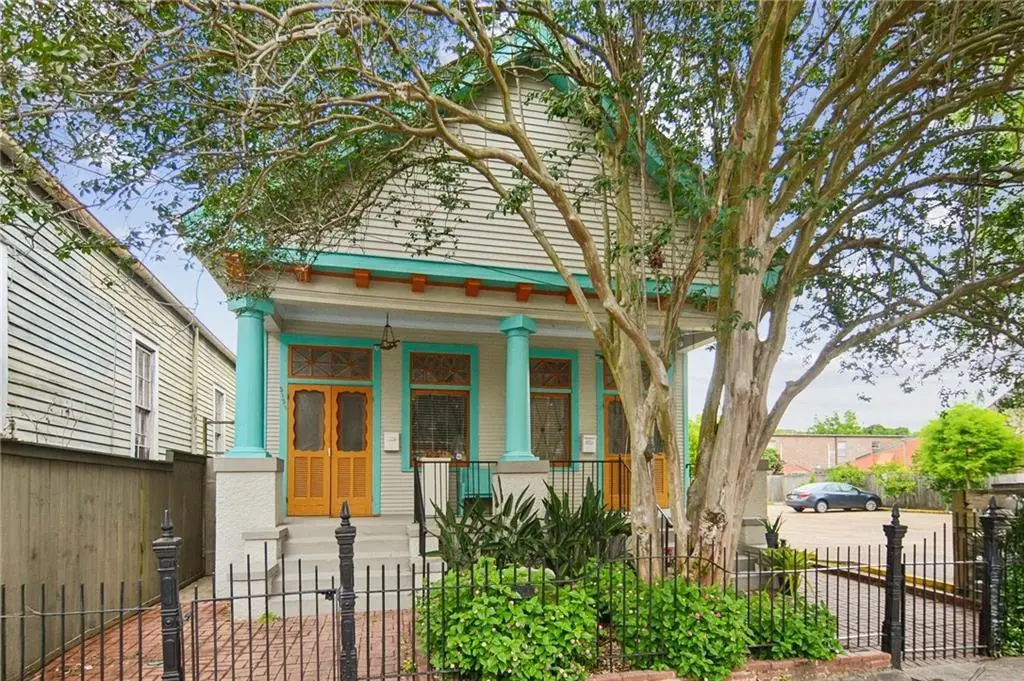
Historic Bywater 4 plex circa 1923, located on a charming stretch of Dauphine Street surrounded by classic New Orleans architecture. This property reflects the neighborhood’s rich history and classic multi-unit design, offering timeless character in one of the city’s most vibrant and areas with a walk score of 75. Conveniently located within blocks of local dining, music, and the Mississippi River corridor.
Key facts
- Walk score 75
- Historic bywater
- Local dining
Tags
Property features AI
Finance
- Financial info: Four-unit property; Unit 1: 1 bed, 1 bath, ~400 area, actual rent $1,800; Unit 2: 1 bed, 1 bath, ~400 area, actual rent $1,800; Unit 3: 1 bed, 1 bath, ~650 area, actual rent $950; Unit 4: 1 bed, 1 bath, ~875 area, actual rent $2,800
Exterior
- Utilities: Public water; Public sewer; Owner pays electricity, gas, and water
- Home design: Single-story building; Raised foundation; Frame construction with wood siding; Asphalt shingle roof; City lot with a rectangular 30x145 parcel
- Construction: Built with frame construction and wood siding; Asphalt shingle roof; Raised foundation
- Exterior features: Courtyard; Porch
Interior
- Bedrooms: Four 1-bedroom units (unit counts per unit shown below)
- Bathrooms: Four full bathrooms (one per unit)
- Heating & cooling: Ductless cooling; Wall unit cooling; Ductless heating; Wall furnace heating
- Interior features: Excellent condition; Common area laundry
- Laundry & utility: Shared laundry in a common area
Neighborhood map
What this means for you Summary
Snapshot
- This is a 4 × 4-bed/4.0-bath units multifamily listed at $749k.
Deal economics
- At list price, monthly cash flow is $2k ($24k/yr) — positive. Per door: $509/mo.
- The deal already cash-flows at list — no discount required.
- Meets the 1% rule at list price ($9k rent vs $749k).
- Recommended offer: $738k (1.5% below list) — sets the bar for market timing.
- Cap rate 9.7% vs local median 4.4% in New Orleans — top-decile yield for the area; either an underpriced asset or a hidden risk that comps aren't pricing in. Stress-test before assuming the spread holds.
Location & tenants
- Location reads 81/100 on livability (#3 in LA, #1,383 nationally) — a professional / high-income tenant draw. Strengths: amenities A+, commute A+, health & safety A+; Watch: crime C-, employment D.
- Orleans Parish (urban): math 11% / reading 27% proficiency, ranked #69 of 98 in LA (top 70%) — low school quality limits family demand, transient renter base, plan for 1-2y turnover; 68% free/reduced lunch — lower-income household profile, screen leases tightly.
- Market conditions: Rents rising (+2.5%/yr); 581 active listings in the ZIP; 34 comparable units currently listed for rent nearby; rentals at typical pace (median 24d on market — plan ~3-4 weeks tenant-placement turnaround); 710 units permitted in Orleans Parish in 2024 (244 in 5+ unit buildings).
- At $8,623/mo this rent would consume 226% of the median local household income ($46k/yr) (locally 1988% of renters already pay >50% of income on rent) — very limited rent-growth headroom before tenants either downsize or default.
Forward outlook
- Local home prices are declining (-3.0%/yr); year-one equity from $5k of loan paydown is wiped out by about $22k of value loss. Plan a longer hold.
- Orleans County population projected at +61% by 2050 — long-run rental-demand tailwind backs the buy-and-hold thesis.
Negotiation context
- It's been on market 29 days — a 2% lower offer ($738k) is reasonable based on typical stale-listing flexibility.
- 6 sale attempts since 32y ago with the ask held roughly flat each time — persistent listings suggest the price (not the market) is what's stuck; bring a comps-based counter.
- Current owner paid $125k; list at $749k implies a 499% gain — meaningful room to come down on a strong offer.
Risks & watch-outs
- Watch-outs: flood insurance adds $66/mo; built in 1923 — expect roof / HVAC / electrical / plumbing capex.
- Climate carrying-cost: major flood risk; severe wind risk, 99% chance of damaging wind over 30y; extreme-heat days projected 7→22/yr by 2055 (HVAC capex compounding) — expect insurance premiums to compound above CPI over the hold.
Questions for the listing agent
- Can we see the unit-by-unit rent roll, current vacancy, and any below-market leases? What's the average tenancy length?
- What capital expenditures (roof, boiler, parking lot, exteriors) have been made in the last 5 years, and what's planned in the next 2?
- Built in 1923 — when were the roof, HVAC, electrical panel, plumbing, and water heater last replaced?
- What's the actual annual flood-insurance premium (NFIP or private), and is the property in a SFHA with mandatory coverage?
- Is there a deadline driving the sale (1031 exchange, divorce, estate, relocation)? That informs how much negotiation room exists.
- What's the average days-on-market for RENTAL listings here right now (not sales)? A rising rental-DOM trend means longer vacancies and softer asking-rent achievability than the comps imply.
- What's the recent tenant-quality profile in this submarket — average credit score on applications, eviction rate, late-payment / NSF rate, and stable-employment percentage? A property-management company in the area should have these aggregated.
- How much new apartment / multifamily construction is in the pipeline within 1–3 miles? Heavy new supply (>2% of stock underway) typically softens rents 12–24 months out; light construction supports rent growth.
Investment metrics
- 1% rule
- 1.15% ✓
- Cap rate
- 9.66%
- Cash-on-cash
- 12.03%
- DSCR
- 1.54
- GRM
- 7.2
CMA / ARV
- ARV (on-the-fly)
- $348,750
- Comps found
- 12
Show comp detail 12 sales within ~0.75 mi
| Address | Dist | Beds/Ba | Sqft | Sold | Price | $/sf | Match |
|---|---|---|---|---|---|---|---|
| 939 Piety St | 0.17mi | 4/2.5 | 2,022 (-13%) | 1mo | $409,000 | $202 | 68 |
| 3146 48 N Rampart St | 0.11mi | 5/2.0 (+1) | 2,098 (-10%) | 8mo | $380,000 | $181 | 67 |
| 827-829 St Ferdinand St | 0.30mi | 4/2.0 | 2,019 (-13%) | 2mo | $450,000 | $223 | 62 |
| 113 15 Vallette St | 0.71mi | 4/2.0 | 2,384 (+2%) | 6mo | $355,000 | $149 | 58 |
| 2814 St Claude Ave | 0.34mi | 4/2.0 | 2,000 (-14%) | 10mo | $300,000 | $150 | 52 |
| 1220 22 Mazant St | 0.64mi | 3/2.0 (-1) | 2,184 (-6%) | 5mo | $325,000 | $149 | 51 |
| 3913 15 N Rampart St | 0.49mi | 5/2.0 (+1) | 2,530 (+9%) | 8mo | $350,000 | $138 | 51 |
| 4023 25 Dauphine St | 0.54mi | 4/3.5 | 2,168 (-7%) | 11mo | $489,000 | $226 | 48 |
| 4029 Royal St | 0.55mi | 3/3.0 (-1) | 2,056 (-12%) | 5mo | $487,000 | $237 | 41 |
| 3932-34 North Robertson St | 0.69mi | 4/2.0 | 2,098 (-10%) | 12mo | $215,000 | $102 | 41 |
| 3900 Royal St | 0.46mi | 4/4.0 | 2,600 (+12%) | 12mo | $170,000 | $65 | 41 |
| 1740 Louisa St | 0.72mi | 5/5.0 (+1) | 2,500 (+8%) | 2mo | $340,000 | $136 | 36 |
Match score weights: distance 35% · size 25% · config 20% · recency 20%. Top-matched comps best support the ARV.
Projected returns pro-forma
-3.0% appreciation · 2.49% rent growth · sell at horizon
- IRR
- 0.5%
- Equity multiple
- 1.02×
- Total profit
- $3,774
- Equity at exit
- $111,678
- IRR
- 9.6%
- Equity multiple
- 1.72×
- Total profit
- $151,898
- Equity at exit
- $64,760
Cash invested: $209,720 (down + closing). Projections, not guarantees.
Landlord ↔ Tenant lean methodology
- Overall (STATE)
- 90 Strongly Landlord-Friendly
- State Louisiana
- 90 Strongly Landlord-Friendly · R+12
- County
- — inherits STATE
- City
- — inherits STATE
ZIP-level market 70117
- Rents YoY
- 2.5%
- Active inventory
- 581
- Price-to-rent
- 29.0×
Monthly cashflow live
- Estimated rent
- $8,623 medium interval (Pro) →
- Mortgage (P&I)
- −$3,928
- Tax from tax record
- −$470 /mo · $5,640/yr
- Insurance
- −$312
- Flood insurance flood zone
- −$66 /mo · $798/yr
- HOA
- −$0
- Vacancy / Maint / Mgmt
- −$1,811
- Net cashflow
- $2,036
Break-even live
4-unit breakdown (identical units grouped — click to expand)
| Units | Beds | Baths | Est. rent |
|---|---|---|---|
| 4× units | 4 | 4 | $8,624 |
| #1 | 4 | 4 | $2,156 |
| #2 | 4 | 4 | $2,156 |
| #3 | 4 | 4 | $2,156 |
| #4 | 4 | 4 | $2,156 |
| Total (4 units) | $8,623 | ||
UW: 25.0% down · 7.5% · 30yr · 1.5% tax · 5.0% vac · 8.0% maint · 8.0% mgmt
Financing live
Cash to close
- Down payment
- $187,250
- Closing costs
- $22,470
- Reserves months
- —
- Total cash needed
- —
Loan-product check · same deal, 3 products live
Conventional
25% down · 7.5% · 30yr
- Down + closing
- —
- Monthly P&I
- —
- Monthly cashflow
- —
- DSCR
- —
- Eligible?
- —
Personal DTI + credit; lowest rate.
DSCR
20% down · 8.5% · 30yr
- Down + closing
- —
- Monthly P&I
- —
- Monthly cashflow
- —
- DSCR
- —
- Eligible?
- —
No personal income docs; deal must DSCR.
Hard money
10% down · 12.0% · 12mo
- Down + closing
- —
- Monthly P&I
- —
- Monthly cashflow
- —
- DSCR
- —
- Eligible?
- —
Short-term bridge; refi at stabilization.
Rent comps 34 comps
| Address | Beds | Baths | Sqft | Rent | $/sqft | DOM | Units | Dist |
|---|---|---|---|---|---|---|---|---|
| 3134 Burgundy St New Orleans, LA | 3.0 | 2.0 | 1887 | $2,900 | $1.54 | 23d | 1 | 0.07mi |
| 639 Desire St New Orleans, LA | 3.0 | 2.5 | 2687 | $5,500 | $2.05 | 19d | 1 | 0.18mi |
| 3400 Royal St New Orleans, LA | 4.0 | 3.5 | 3300 | $6,900 | $2.09 | 43d | 1 | 0.19mi |
| 3221 Saint Claude Ave New Orleans, LA | 3.0 | 1.0 | 1900 | $1,650 | $0.87 | 23d | 1 | 0.27mi |
| 1038 Montegut St New Orleans, LA | 3.0 | 2.5 | 2250 | $4,200 | $1.87 | 43d | 1 | 0.28mi |
| 1038 Montegut St New Orleans, LA | 3.0 | 2.5 | 2250 | $4,200 | $1.87 | 23d | 1 | 0.28mi |
| 1231 Feliciana St New Orleans, LA | 3.0 | 2.5 | 1869 | $2,750 | $1.47 | 43d | 1 | 0.37mi |
| 1325 Pauline St New Orleans, LA | 3.0 | 2.0 | 1792 | $2,250 | $1.26 | 3d | 1 | 0.56mi |
| 1325 Pauline St New Orleans, LA | 3.0 | 2.0 | 1792 | $2,250 | $1.26 | 3d | 1 | 0.56mi |
| 1323 Pauline St New Orleans, LA | 3.0 | 2.0 | 1792 | $2,250 | $1.26 | 3d | 1 | 0.56mi |
| 2320 N Rampart St New Orleans, LA | 3.0 | 3.0 | 2317 | $3,700 | $1.60 | 43d | 1 | 0.69mi |
| 2317 N Rampart St Unit 1272378P New Orleans, LA | 3.0–6.0 | 2.0–4.0 | 1581 | $4,154 | $2.63 | 3d | 2 | 0.70mi |
| 249 Vallette St New Orleans, LA | 4.0 | 2.0 | 1734 | $2,500 | $1.44 | 16d | 1 | 0.79mi |
| 1403 Lesseps St New Orleans, LA | 3.0 | 3.0 | 1700 | $1,800 | $1.06 | 11d | 1 | 0.81mi |
| 1835 Louisa St New Orleans, LA | 3.0 | 2.5 | 1800 | $2,350 | $1.31 | 3d | 1 | 0.81mi |
| 527 Atlantic Ave New Orleans, LA | 3.0 | 2.0 | 1800 | $2,050 | $1.14 | 23d | 1 | 0.96mi |
| 1860 Burgundy St New Orleans, LA | 4.0 | 4.0 | 3000 | $3,500 | $1.17 | 23d | 1 | 1.00mi |
| 928 Kerlerec St New Orleans, LA | 3.0 | 3.5 | 1684 | $2,750 | $1.63 | 3d | 1 | 1.07mi |
| 928 Kerlerec St New Orleans, LA | 3.0 | 3.5 | 1684 | $2,750 | $1.63 | 3d | 1 | 1.07mi |
| 729 Elmira Ave New Orleans, LA | 4.0 | 2.0 | 2000 | $2,000 | $1.00 | 16d | 1 | 1.13mi |
| 515 Saint Ann St Unit 3 New Orleans, LA | 3.0 | 2.0 | 1644 | $3,600 | $2.19 | 44d | 1 | 1.18mi |
| 527 Saint Ann St Unit 3 New Orleans, LA | 3.0 | 2.0 | 1687 | $3,500 | $2.07 | 43d | 1 | 1.19mi |
| 2228 Arts St New Orleans, LA | 3.0 | 2.0 | 2270 | $1,675 | $0.74 | 3d | 1 | 1.22mi |
| 751 Chartres St New Orleans, LA | 2.0–3.0 | 2.0 | 1461 | $3,450 | $2.36 | 43d | 1 | 1.23mi |
| 839 Dumaine St New Orleans, LA | 3.0 | 4.0 | 2740 | $6,500 | $2.37 | 43d | 1 | 1.27mi |
| 1837 Touro St New Orleans, LA | 3.0 | 1.0 | 1994 | $2,000 | $1.00 | 23d | 1 | 1.27mi |
| 1000 Saint Philip St New Orleans, LA | 3.0 | 2.5 | 2650 | $4,800 | $1.81 | 43d | 1 | 1.29mi |
| 2107 Elysian Fields Ave New Orleans, LA | 4.0 | 2.0 | 1794 | $1,650 | $0.92 | 3d | 1 | 1.30mi |
| 535 Decatur St Unit 3 New Orleans, LA | 3.0 | 2.0 | 1600 | $2,800 | $1.75 | 11d | 1 | 1.31mi |
| 811 Burgundy St New Orleans, LA | 4.0 | 2.5 | 2059 | $5,000 | $2.43 | 43d | 1 | 1.37mi |
| 1021 Henriette Delille St New Orleans, LA | 3.0 | 2.0 | 2012 | $2,250 | $1.12 | 17d | 1 | 1.38mi |
| 1936 N Johnson St Unit 36 New Orleans, LA | 3.0 | 2.0 | 1844 | $2,400 | $1.30 | 23d | 1 | 1.43mi |
| 1938 N Johnson St Unit 38 New Orleans, LA | 3.0 | 2.0 | 1844 | $2,400 | $1.30 | 23d | 1 | 1.43mi |
| 1433 Esplanade Ave New Orleans, LA | 3.0 | 2.0 | 2411 | $5,000 | $2.07 | 2d | 1 | 1.45mi |
Listing history 25 events
-
2026-06-18days on market $749,000 Active 29 DOM
-
2026-06-17days on market $749,000 Active 28 DOM
-
2026-06-16days on market $749,000 Active 27 DOM
-
2026-06-15days on market $749,000 Active 26 DOM
-
2026-06-13days on market $749,000 Active 24 DOM
-
2026-06-10days on market $749,000 Active 21 DOM
-
2026-06-09days on market $749,000 Active 20 DOM
-
2026-06-08days on market $749,000 Active 19 DOM
-
2026-06-07days on market $749,000 Active 18 DOM
-
2026-06-05days on market $749,000 Active 15 DOM
-
2026-06-03days on market $749,000 Active 14 DOM
-
2026-06-02days on market $749,000 Active 13 DOM
-
2026-06-01days on market $749,000 Active 12 DOM
-
2026-05-31days on market $749,000 Active 11 DOM
-
2026-05-20$749,000 Active
-
2013-07-18$329,000
-
2002-10-20soldstatus $125,000
-
2002-10-16soldstatus $130,000
-
2002-07-05$125,000
-
2002-07-05$125,000
-
2002-07-05$125,000
-
1994-11-14soldstatus $47,000
-
1994-11-14soldstatus $47,000
-
1994-06-28$49,900
-
1978-06-15soldstatus $32,500
ⓘ Source: listings_history table (triggers on properties + properties_extension) + one-shot
backfill from property_details.listing_events for pre-trigger history.
Tax reassessment forecast LA · Resets to sale price
- Current annual tax
- $5,640 · $470/mo
- Projected year-2 tax
- $5,640 · $470/mo
- Expected delta
- $0/yr ($0/mo · 0.0%)
ⓘ Screening estimate from a state-policy table — verify with the county assessor before closing.
Climate risk First Street
- Flood 7/10 Severe FEMA zone X · 74% chance over 30 yrs
- Wildfire 1/10 Low
- Heat 10/10 Extreme 7 d/yr ≥108°F today · 22 d/yr by 30 yrs out
- Wind 10/10 Extreme 99% chance of damaging wind over 30 yrs
- Air quality 3/10 Moderate 3 unhealthy d/yr today · 3 by 30 yrs out
Nearby sold comps map
Loading sold comps map…
Walkable amenities ~0.75 mi
Loading nearby amenities…
Taxation est. · year 1
- Rental income
- $103,476
- − Mortgage interest
- −$41,956
- − Property taxes
- −$5,640
- − Insurance
- −$4,542
- − Repairs & maintenance
- −$8,278
- − Management
- −$8,278
- − Depreciation
- −$21,789
- Taxable income
- $12,993
- Est. tax owed @ 24.0%
- −$3,118
- After-tax cash flow
- $21,312/yr
For passive investors: Depreciation is non-cash, so a rental often shows a tax loss while cash-flowing — sheltering income. Rental losses are passive: they offset passive income freely, and up to $25,000/yr can offset ordinary (W-2) income if you actively participate and your MAGI is under $100k (phasing out to $0 by $150k); unused losses carry forward. On sale, claimed depreciation is recaptured at up to 25%, and gains may owe capital-gains tax (a 1031 exchange can defer both). Figures are a year-1 estimate at your 24.0% rate — not tax advice; consult a CPA.
Schools (NCES district)
- District
- Orleans Parish
- NCES district ID
- 2201170
- Math proficiency
- 11% ▼ -52.00%
- Reading proficiency
- 27% ▼ -46.00%
- Median HH income
- $37,011
- Composite
- 15.78/100
- National rank
- #9271
- State rank
- #69 of 98 in LA
Livability — New Orleans
- Score
- 81/100
- State rank
- #3
- US rank
- #1383
Category grades
Schools grade is shown separately in the Schools card above.
Census & demographics
- Census place
- New Orleans, LA
- County
- Orleans Parish · 338,817 people
- City population
- 338,817
- Metro
- New Orleans-Metairie, LA
- Population (ZIP)
- 25,652
- Household income
- $45,764
- Rent vs Own
- Severe rent burden
- 1988.0
Population outlook (Orleans County) Hauer SSP2
- Today (2025)
- 513,025 people
- By 2030
- 575,781 · +12.2%
- By 2040
- 700,174 · +36.5%
- By 2050
- 826,541 · +61.1%
- By 2075
- 1,123,374 · +119.0%
- By 2100
- 1,355,609 · +164.2%
Race, ethnicity, and origin ACS 2023
- Neighborhood character
- Majority Black (60%)
- Race & ethnicity
- Black 60% White 30% Two or more races 6% Hispanic / Latino 5%
- Common ancestry
- Lithuanian 5% Italian 1% Romanian 1%
- Foreign-born
- 5% · Canada, South Korea
- Languages at home
- 93% English-only · Spanish 3% Other Indo-European 1% French/Haitian/Cajun 1%
Political lean MEDSL · Orleans
- 2024 margin
- Solid D (+67.0) · D 82.2% · R 15.2% · Other 2.7%
- 2008→2024 swing
- +6.7pp toward D · 2008: 60.3pp · 2024: 67.0pp
- All cycles
- 2024: D+67.0 2020: D+68.2 2016: D+66.2 2012: D+62.5 2008: D+60.3
Not yet ingested
- Civics
- —
Market trends
- HPI YoY
- ▼ -177.22%
- Current HPI
- 184.6061
- Rent YoY
- ▲ 2.49%
- Metro
- New Orleans-Metairie, LA
- State GDP YoY
- ▲ 3.29%
- F500 in state
- 10
Industry mix (Fortune 500 HQ in LA)
| Industry | F500 HQs | Revenue |
|---|---|---|
| Telecommunications | 2 | $23B |
|
||
| Utilities | 1 | $12B |
|
||
| Wholesale / Distribution | 1 | $5B |
|
||
| Advertising | 1 | $2B |
|
||
Price history
+2204.6% since first listed11 events — show timeline
- 2026-05-20 Listed $749,000 GSREIN
- 2013-07-18 Listed $329,000 GSREIN
- 2002-10-20 Sold (MLS) $125,000 GSREIN
- 2002-10-16 Sold (MLS) $130,000 GSREIN
- 2002-07-05 Listed $125,000 GSREIN
- 2002-07-05 Listed $125,000 GSREIN
- 2002-07-05 Listed $125,000 AcadianaMLS
- 1994-11-14 Sold (Public Records) $47,000 Public Records
- 1994-11-14 Sold (MLS) $47,000 GSREIN
- 1994-06-28 Listed $49,900 GSREIN
- 1978-06-15 Sold (Public Records) $32,500 Public Records
Property tax history
+5.1%/yrLatest (2026): $5,640 · +1.1% YoY. Source: county tax records.
Cash-flow waterfall
monthlySold comps — $/sqft
last 12 mo · ≤1 miLoading sold comps…