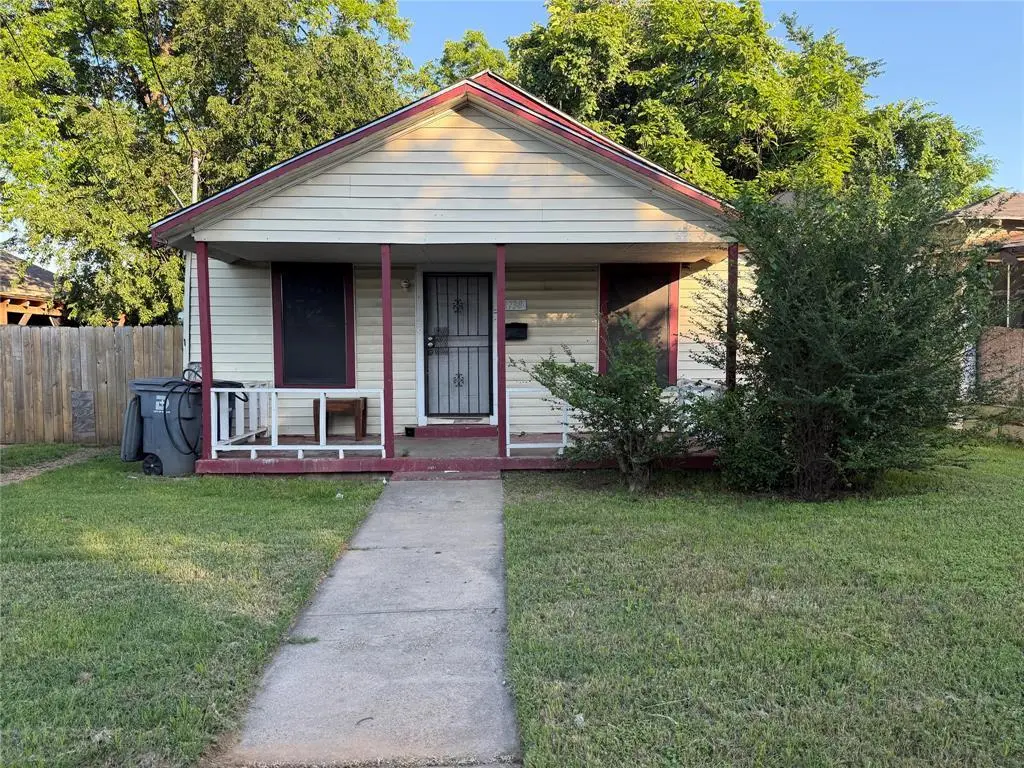
2738 Lawrence St · Dallas, TX
Flood risk 1/10 · Minimal
- FEMA flood zone
- X (shaded)
- Chance of flooding over 30 yrs
- 0.0%
- Est. flood insurance / yr
- $507 – $1,088
Fire risk 3/10 · Minor
- Est. fire insurance / yr
- $1,222 – $2,270
Heat risk 7/10 · Major
- Hot days now (above 110°F)
- 7 days/yr
- Hot days in 30 yrs
- 24 days/yr
Wind risk 6/10 · Moderate
- Chance of severe wind over 30 yrs
- 27.0%
Air-quality risk 3/10 · Minor
- Unhealthy air days now
- 2 days/yr
- Unhealthy air days in 30 yrs
- 3 days/yr
Risk factors via First Street. Map © Google.
Why this score? — see what drove the B+ grade
The composite is a weighted blend of 9 inputs, each scored 0–100. Each bar is that input's sub-score; the figure is the points it added to the 100-point composite (weight × sub-score).
- Cash flow +29.8/30.0
- DSCR +10.0/10.0
- 1% rule +9.8/10.0
- ARV discount +7.5/15.0
- Appreciation +5.4/10.0
- Rent growth +4.3/5.0
- Livability +4.0/5.0
- Schools +2.8/10.0
- Condition / age +2.5/5.0
$115,000
🖨 Deal sheet 📄 Offer letter ✓ Due diligence
Listing remarks MLS
THIS PROPERTY COULD BE A VERY GOOD INVESTMENT, BEING SOLD AS IS, OFFER IS NEGOTABLE. Pre-foreclosure send all offers with prequail. letter.
Key facts
- 5,532 sq ft lot
- Built 1923
- Listed 42 days
Property features AI
Finance
- Other: Property listed as for sale; standard listing conditions
- Financial info: Second mortgage: none
- HOA & community: No homeowners association
Exterior
- Parking: Additional off-street parking
- Utilities: City water; Electricity available; Not in a municipal utility district
- Home design: Single-family residence; One story; Residential property
- Construction: Built in 1923
- Exterior features: Lot is less than 0.5 acre; Lot area approximately 0.127 acres (about 5,532 sq ft); Subdivision: H T Lackey
Interior
- Kitchen: No appliances included
- Bedrooms: 4 bedrooms (all on main level)
- Bathrooms: 1 full bathroom
- Interior features: Cable TV available; One living area; One dining area; 7 total rooms
- Laundry & utility: No specific laundry or utility appliances listed
Neighborhood map
What this means for you Summary
Snapshot
- This is a 3-bed/1.0-bath single-family listed at $115k.
Deal economics
- At list price, monthly cash flow is $421 ($5k/yr) — positive.
- The deal already cash-flows at list — no discount required.
- Meets the 1% rule at list price ($2k rent vs $115k).
- Recommended offer: $112k (3.0% below list) — sets the bar for market timing.
- Cap rate 10.7% vs local median 2.3% in Dallas — top-decile yield for the area; either an underpriced asset or a hidden risk that comps aren't pricing in. Stress-test before assuming the spread holds.
Location & tenants
- Location reads 81/100 on livability (#24 in TX, #1,380 nationally) — a professional / high-income tenant draw. Strengths: amenities A+, commute A+, housing A+; Watch: schools C-, crime F.
- Dallas ISD (urban): math 31% / reading 36% proficiency, ranked #559 of 826 in TX (top 68%) — families likely to look elsewhere, expect single-tenant / working-renter base with shorter leases; 83% free/reduced lunch — lower-income household profile, screen leases tightly.
- Market conditions: Rents rising fast (+7.2%/yr); 248 active listings in the ZIP; 40 comparable units currently listed for rent nearby; rentals at typical pace (median 21d on market — plan ~3-4 weeks tenant-placement turnaround); 12,577 units permitted in Dallas County in 2024 (6,829 in 5+ unit buildings).
- This rent runs 45% of the median local income ($46k/yr) — at the standard rent-burdened threshold; future hikes will face affordability resistance.
Forward outlook
- In year one you build about $2k of equity ($795 loan paydown + $908 appreciation (0.8% local appreciation)).
- Dallas County population projected at +35% by 2050 — long-run rental-demand tailwind backs the buy-and-hold thesis.
- At projected returns (0.8% appreciation + 7.2% rent growth), your $32k cash investment doubles in ~4 years — after that, you're playing with house money.
Negotiation context
- It's been on market 43 days — a 3% lower offer ($112k) is reasonable based on typical stale-listing flexibility.
- 3 sale attempts since 20y ago; this cycle's ask has dropped $15k (12%) from the opening price — seller is motivated, your offer sets the floor, not the list.
Risks & watch-outs
- Watch-outs: property tax is 2.8% of price; built in 1923 — expect roof / HVAC / electrical / plumbing capex.
- Climate carrying-cost: major wind risk, 27% chance of damaging wind over 30y; extreme-heat days projected 7→24/yr by 2055 (HVAC capex compounding) — expect insurance premiums to compound above CPI over the hold.
Questions for the listing agent
- It's been on market 43 days. Have you received any prior offers? Is the seller open to a 3% concession, seller financing, or rate buy-down credit?
- Built in 1923 — when were the roof, HVAC, electrical panel, plumbing, and water heater last replaced?
- Property tax is high relative to price — has the assessment been appealed recently, and will the sale trigger a re-assessment?
- Is there a deadline driving the sale (1031 exchange, divorce, estate, relocation)? That informs how much negotiation room exists.
- Crime grade is F in this area — have there been break-ins, vandalism, or insurance claims at this property in the last 3 years? What carrier currently insures it and at what premium?
- What's the average days-on-market for RENTAL listings here right now (not sales)? A rising rental-DOM trend means longer vacancies and softer asking-rent achievability than the comps imply.
- What's the recent tenant-quality profile in this submarket — average credit score on applications, eviction rate, late-payment / NSF rate, and stable-employment percentage? A property-management company in the area should have these aggregated.
- How much new for-sale + rental construction is in the pipeline within 1–3 miles? Heavy new supply typically softens prices + rents 12–24 months out; constrained supply supports both.
Investment metrics
- 1% rule
- 1.48% ✓
- Cap rate
- 10.69%
- Cash-on-cash
- 15.70%
- DSCR
- 1.70
- GRM
- 5.6
CMA / ARV
- ARV (median comp)
- $237,021
- List price
- $115,000
- Delta
- -51.48%
- Verdict
- UNDERPRICED
- Comps
- 20 within 1.0 mi
Show comp detail 12 sales within ~0.75 mi
| Address | Dist | Beds/Ba | Sqft | Sold | Price | $/sf | Match |
|---|---|---|---|---|---|---|---|
| 2714 Stephenson Dr | 0.21mi | 3/2.5 | 1,225 (-2%) | 1mo | $210,000 | $171 | 81 |
| 3925 Malcolm X Blvd | 0.56mi | 3/2.0 | 1,248 (0%) | 0mo | $199,000 | $159 | 70 |
| 2404 Garden Dr | 0.37mi | 4/2.5 (+1) | 1,270 (+2%) | 6mo | $224,500 | $177 | 64 |
| 2232 Poplar St | 0.66mi | 3/1.0 | 1,231 (-1%) | 5mo | $90,000 | $73 | 63 |
| 2402 Garden Dr | 0.38mi | 4/2.5 (+1) | 1,270 (+2%) | 6mo | $255,500 | $201 | 63 |
| 2719 Starks Ave | 0.42mi | 3/2.0 | 1,143 (-8%) | 5mo | $279,900 | $245 | 58 |
| 2526 Bethurum Ave | 0.67mi | 3/2.0 | 1,292 (+4%) | 4mo | $250,000 | $193 | 56 |
| 2923 Carpenter Ave | 0.35mi | 3/2.0 | 1,410 (+13%) | 5mo | $220,000 | $156 | 54 |
| 2606 Hooper St | 0.47mi | 4/2.0 (+1) | 1,388 (+11%) | 1mo | $264,000 | $190 | 50 |
| 4422 Crozier St | 0.39mi | 4/2.0 (+1) | 1,414 (+13%) | 2mo | $160,000 | $113 | 49 |
| 2723 Bethurum Ave | 0.58mi | 3/1.5 | 1,414 (+13%) | 3mo | $220,000 | $156 | 46 |
| 2321 Greer St | 0.58mi | 4/1.5 (+1) | 1,120 (-10%) | 5mo | $119,000 | $106 | 44 |
Match score weights: distance 35% · size 25% · config 20% · recency 20%. Top-matched comps best support the ARV.
Projected returns pro-forma
0.79% appreciation · 7.19% rent growth · sell at horizon
- IRR
- 20.9%
- Equity multiple
- 2.10×
- Total profit
- $35,355
- Equity at exit
- $38,003
- IRR
- 27.0%
- Equity multiple
- 4.70×
- Total profit
- $119,261
- Equity at exit
- $49,544
Cash invested: $32,200 (down + closing). Projections, not guarantees.
Landlord ↔ Tenant lean methodology
- Overall (STATE)
- 87 Strongly Landlord-Friendly
- State Texas
- 87 Strongly Landlord-Friendly · R+5
- County
- — inherits STATE
- City
- — inherits STATE
ZIP-level market 75215
- Home prices YoY
- 0.3%
- Rents YoY
- 7.2%
- Active inventory
- 248
- Price-to-rent
- 5.6×
Monthly cashflow live
- Estimated rent
- $1,697 high interval (Pro) →
- Mortgage (P&I)
- −$603
- Tax from tax record
- −$268 /mo · $3,221/yr
- Insurance
- −$48
- HOA
- −$0
- Vacancy / Maint / Mgmt
- −$356
- Net cashflow
- $421
Break-even live
UW: 25.0% down · 7.5% · 30yr · 1.5% tax · 5.0% vac · 8.0% maint · 8.0% mgmt
Financing live
Cash to close
- Down payment
- $28,750
- Closing costs
- $3,450
- Reserves months
- —
- Total cash needed
- —
Loan-product check · same deal, 3 products live
Conventional
25% down · 7.5% · 30yr
- Down + closing
- —
- Monthly P&I
- —
- Monthly cashflow
- —
- DSCR
- —
- Eligible?
- —
Personal DTI + credit; lowest rate.
DSCR
20% down · 8.5% · 30yr
- Down + closing
- —
- Monthly P&I
- —
- Monthly cashflow
- —
- DSCR
- —
- Eligible?
- —
No personal income docs; deal must DSCR.
Hard money
10% down · 12.0% · 12mo
- Down + closing
- —
- Monthly P&I
- —
- Monthly cashflow
- —
- DSCR
- —
- Eligible?
- —
Short-term bridge; refi at stabilization.
Rent comps 40 comps
| Address | Beds | Baths | Sqft | Rent | $/sqft | DOM | Units | Dist |
|---|---|---|---|---|---|---|---|---|
| 2627 Elsie Faye Heggins St Dallas, TX | 3.0 | 2.0 | 876 | $1,280 | $1.46 | 43d | 1 | 0.18mi |
| 2615 Elsie Faye Heggins St Dallas, TX | 3.0 | 2.0 | 876 | $1,280 | $1.46 | 15d | 1 | 0.19mi |
| 5000 Linder Ave Dallas, TX | 3.0 | 2.0 | 1327 | $1,950 | $1.47 | 43d | 1 | 0.20mi |
| 2603 Elsie Faye Heggins St Dallas, TX | 3.0 | 2.0 | 876 | $1,385 | $1.58 | 43d | 1 | 0.21mi |
| 2563 Elsie Faye Heggins St Dallas, TX | 3.0 | 2.0 | 876 | $1,240 | $1.42 | 15d | 1 | 0.22mi |
| 2561 Elsie Faye Heggins St Dallas, TX | 3.0 | 2.0 | 876 | $1,390 | $1.59 | 6d | 1 | 0.22mi |
| 2829 Oakdale St Dallas, TX | 3.0 | 2.0 | 1028 | $1,840 | $1.79 | 7d | 1 | 0.25mi |
| 2840 Oakdale St Dallas, TX | 3.0 | 2.0 | 1379 | $1,900 | $1.38 | 43d | 1 | 0.29mi |
| 2513 Southland St Dallas, TX | 2.0 | 1.0 | 1010 | $1,299 | $1.29 | 3d | 1 | 0.30mi |
| 2513 Southland St Dallas, TX | 2.0 | 1.0 | 1010 | $1,399 | $1.39 | 20d | 1 | 0.30mi |
| 2838 Frost Ave Dallas, TX | 2.0 | 1.0 | 1200 | $1,400 | $1.17 | 24d | 1 | 0.35mi |
| 4722 Meadow St Dallas, TX | 2.0–3.0 | 2.0 | 1107 | $1,475 | $1.33 | 11d | 4 | 0.36mi |
| 4024 Myrtle St Dallas, TX | 3.0 | 2.0 | 1106 | $1,595 | $1.44 | 5d | 1 | 0.44mi |
| 4611 Bradshaw St Dallas, TX | 3.0 | 2.0 | 1145 | $1,550 | $1.35 | 24d | 1 | 0.49mi |
| 2642 Anderson St Dallas, TX | 2.0 | 1.0 | 820 | $1,150 | $1.40 | 24d | 1 | 0.50mi |
| 4503 Bradshaw St Dallas, TX | 4.0 | 2.0 | 1263 | $1,600 | $1.27 | 7d | 1 | 0.51mi |
| 2822 McDermott Ave Dallas, TX | 3.0 | 2.0 | 1200 | $1,795 | $1.50 | 24d | 1 | 0.71mi |
| 3526 Elsie Faye Heggins St Dallas, TX | 3.0 | 2.0 | 1113 | $1,795 | $1.61 | 24d | 1 | 0.71mi |
| 3526 Elsie Faye Heggins St Dallas, TX | 3.0 | 2.0 | 1113 | $1,795 | $1.61 | 7d | 1 | 0.71mi |
| 2207 Anderson St Dallas, TX | 3.0 | 2.5 | 1419 | $2,300 | $1.62 | 7d | 1 | 0.76mi |
| 3907 Roberts Ave Dallas, TX | 3.0 | 1.0 | 908 | $1,395 | $1.54 | 15d | 1 | 0.76mi |
| 2203 Anderson St Dallas, TX | 3.0 | 2.5 | 1219 | $2,200 | $1.80 | 43d | 1 | 0.76mi |
| 3408 Spring Ave Dallas, TX | 3.0 | 2.0 | 780 | $1,340 | $1.72 | 6d | 1 | 0.77mi |
| 3711 Guaranty St Dallas, TX | 3.0 | 1.0 | 984 | $1,800 | $1.83 | 15d | 1 | 0.77mi |
| 3915 Coolidge St Dallas, TX | 4.0 | 2.0 | 1416 | $2,100 | $1.48 | 43d | 1 | 0.78mi |
| 3619 York St Dallas, TX | 3.0 | 2.0 | 1298 | $1,740 | $1.34 | 7d | 1 | 0.79mi |
| 3627 Sidney St Dallas, TX | 3.0 | 2.0 | 1090 | $1,614 | $1.48 | 6d | 1 | 0.79mi |
| 2847 Metropolitan Ave Dallas, TX | 3.0 | 1.0 | 1344 | $2,050 | $1.53 | 22d | 1 | 0.85mi |
| 1628 Poplar St Dallas, TX | 2.0 | 1.0 | 903 | $1,400 | $1.55 | 43d | 1 | 0.87mi |
| 1630 Poplar St Dallas, TX | 2.0 | 1.0 | 903 | $1,400 | $1.55 | 24d | 1 | 0.87mi |
| 2927 Dorris St Dallas, TX | 3.0 | 2.0 | 1298 | $1,914 | $1.47 | 43d | 1 | 0.87mi |
| 2807 Valentine St Dallas, TX | 3.0 | 2.0 | 1400 | $1,500 | $1.07 | 15d | 1 | 0.90mi |
| 2216 Dyson St Dallas, TX | 3.0 | 2.0 | 1056 | $2,100 | $1.99 | 24d | 1 | 0.91mi |
| 3639 Pine St Dallas, TX | 3.0 | 2.0 | 1090 | $1,490 | $1.37 | 14d | 1 | 0.92mi |
| 3726 Copeland St Dallas, TX | 3.0 | 2.0 | 1298 | $1,690 | $1.30 | 6d | 1 | 0.96mi |
| 2714 Hector St Dallas, TX | 3.0 | 2.0 | 1233 | $2,100 | $1.70 | 24d | 1 | 0.97mi |
| 2711 Cross St Dallas, TX | 2.0 | 1.0 | 700 | $1,275 | $1.82 | 6d | 1 | 0.98mi |
| 3801 Carpenter Ave Dallas, TX | 4.0 | 2.0 | 1454 | $2,400 | $1.65 | 43d | 1 | 0.99mi |
| 3501 Latimer St Dallas, TX | 2.0 | 1.0 | 1008 | $1,095 | $1.09 | 3d | 1 | 1.01mi |
| 5221 Grovewood St Dallas, TX | 3.0 | 1.5 | 840 | $1,400 | $1.67 | 43d | 1 | 1.09mi |
Listing history 22 events
-
2026-06-18days on market $115,000 Active 43 DOM
-
2026-06-17days on market $115,000 Active 42 DOM
-
2026-06-16days on market $115,000 Active 41 DOM
-
2026-06-15days on market $115,000 Active 40 DOM
-
2026-06-13days on market $115,000 Active 38 DOM
-
2026-06-10pricestatus $115,000 Active 34 DOM
-
2026-06-09days on market $130,000 Active Option Contract 34 DOM
-
2026-06-08days on market $130,000 Active Option Contract 33 DOM
-
2026-06-07days on market $130,000 Active Option Contract 32 DOM
-
2026-06-04statusdays on market $130,000 Active Option Contract 29 DOM
-
2026-06-03days on market $130,000 Active 28 DOM
-
2026-06-02days on market $130,000 Active 27 DOM
-
2026-06-01days on market $130,000 Active 26 DOM
-
2026-05-31days on market $130,000 Active 25 DOM
-
2026-05-06$130,000 Active 372-char remark
-
2006-05-10soldstatus
-
2006-04-27soldstatus 139-char remark
Show marketing remark (139 chars)
THIS PROPERTY COULD BE A VERY GOOD INVESTMENT, BEING SOLD AS IS, OFFER IS NEGOTABLE. Pre-foreclosure send all offers with prequail. letter.
-
2006-04-03historical 139-char remark
Show marketing remark (139 chars)
THIS PROPERTY COULD BE A VERY GOOD INVESTMENT, BEING SOLD AS IS, OFFER IS NEGOTABLE. Pre-foreclosure send all offers with prequail. letter.
-
2006-03-29$27,000 139-char remark
Show marketing remark (139 chars)
THIS PROPERTY COULD BE A VERY GOOD INVESTMENT, BEING SOLD AS IS, OFFER IS NEGOTABLE. Pre-foreclosure send all offers with prequail. letter.
-
2004-06-16soldstatus
-
2001-09-26soldstatus
-
1999-05-19soldstatus
ⓘ Source: listings_history table (triggers on properties + properties_extension) + one-shot
backfill from property_details.listing_events for pre-trigger history.
Tax reassessment forecast TX · Resets to sale price
- Current annual tax
- $3,221 · $268/mo
- Projected year-2 tax
- $3,221 · $268/mo
- Expected delta
- $0/yr ($0/mo · 0.0%)
ⓘ Screening estimate from a state-policy table — verify with the county assessor before closing.
Climate risk First Street
- Flood 1/10 Low FEMA zone X (shaded) · 0% chance over 30 yrs
- Wildfire 3/10 Moderate
- Heat 7/10 Severe 7 d/yr ≥110°F today · 24 d/yr by 30 yrs out
- Wind 6/10 Major 27% chance of damaging wind over 30 yrs
- Air quality 3/10 Moderate 2 unhealthy d/yr today · 3 by 30 yrs out
Nearby sold comps map
Loading sold comps map…
Walkable amenities ~0.75 mi
Loading nearby amenities…
Taxation est. · year 1
- Rental income
- $20,364
- − Mortgage interest
- −$6,442
- − Property taxes
- −$3,221
- − Insurance
- −$575
- − Repairs & maintenance
- −$1,629
- − Management
- −$1,629
- − Depreciation
- −$3,345
- Taxable income
- $3,522
- Est. tax owed @ 24.0%
- −$845
- After-tax cash flow
- $4,209/yr
For passive investors: Depreciation is non-cash, so a rental often shows a tax loss while cash-flowing — sheltering income. Rental losses are passive: they offset passive income freely, and up to $25,000/yr can offset ordinary (W-2) income if you actively participate and your MAGI is under $100k (phasing out to $0 by $150k); unused losses carry forward. On sale, claimed depreciation is recaptured at up to 25%, and gains may owe capital-gains tax (a 1031 exchange can defer both). Figures are a year-1 estimate at your 24.0% rate — not tax advice; consult a CPA.
Schools (NCES district)
- District
- Dallas ISD
- NCES district ID
- 4816230
- Math proficiency
- 31% ▼ -16.00%
- Reading proficiency
- 36% ▼ -4.00%
- Median HH income
- $42,881
- Composite
- 28.41/100
- National rank
- #6763
- State rank
- #559 of 826 in TX
Livability — Dallas
- Score
- 81/100
- State rank
- #24
- US rank
- #1380
Category grades
Schools grade is shown separately in the Schools card above.
Census & demographics
- Census place
- Dallas, TX
- County
- Dallas County · 2,612,404 people
- City population
- 1,168,437
- Metro
- Dallas-Fort Worth-Arlington, TX
- Population (ZIP)
- 18,895
- Household income
- $45,557
- Rent vs Own
- Severe rent burden
- 1464.0
Population outlook (Dallas County) Hauer SSP2
- Today (2025)
- 2,979,839 people
- By 2030
- 3,191,823 · +7.1%
- By 2040
- 3,619,611 · +21.5%
- By 2050
- 4,026,915 · +35.1%
- By 2075
- 4,957,073 · +66.4%
- By 2100
- 5,508,725 · +84.9%
Race, ethnicity, and origin ACS 2023
- Neighborhood character
- Diverse neighborhood (Simpson 0.58)
- Race & ethnicity
- Black 59% Hispanic / Latino 25% White 11% Two or more races 10%
- Hispanic origin (detail)
- Mexican 21%
- Common ancestry
- Italian 1% Hispanic 1%
- Foreign-born
- 16% · Canada
- Languages at home
- 74% English-only · Spanish 26%
Political lean MEDSL · Dallas
- 2024 margin
- Strong D (+22.2) · D 60.2% · R 38.0% · Other 1.8%
- 2008→2024 swing
- +6.9pp toward D · 2008: 15.3pp · 2024: 22.2pp
- All cycles
- 2024: D+22.2 2020: D+31.6 2016: D+26.2 2012: D+15.4 2008: D+15.3
Not yet ingested
- Civics
- —
Market trends
- HPI YoY
- ▲ 0.79%
- Current HPI
- 224.2955
- Rent YoY
- ▲ 7.19%
- Metro
- Dallas-Fort Worth-Arlington, TX
- State GDP YoY
- ▲ 3.95%
- F500 in state
- 110
Industry mix (Fortune 500 HQ in TX)
| Industry | F500 HQs | Revenue |
|---|---|---|
| Energy | 16 | $1,198B |
|
||
| Technology | 5 | $198B |
|
||
| Engineering / Construction | 4 | $72B |
|
||
| Energy Services | 3 | $60B |
|
||
| Utilities | 3 | $41B |
|
||
| Healthcare | 2 | $330B |
|
||
Price history
+325.9% since first listed11 events — show timeline
- 2026-06-09 Price Changed $115,000 NTREIS
- 2026-06-09 Relisted — NTREIS
- 2026-06-03 Contingent — NTREIS
- 2026-05-06 Listed $130,000 NTREIS
- 2006-05-10 Sold (Public Records) — Public Records
- 2006-04-27 Sold (MLS) — NTREIS
- 2006-04-03 Listing Removed — NTREIS
- 2006-03-29 Listed $27,000 NTREIS
- 2004-06-16 Sold (Public Records) — Public Records
- 2001-09-26 Sold (Public Records) — Public Records
- 1999-05-19 Sold (Public Records) — Public Records
Property tax history
+9.7%/yrLatest (2025): $3,221 · +4.5% YoY. Source: county tax records.
Cash-flow waterfall
monthlySold comps — $/sqft
last 12 mo · ≤1 miLoading sold comps…