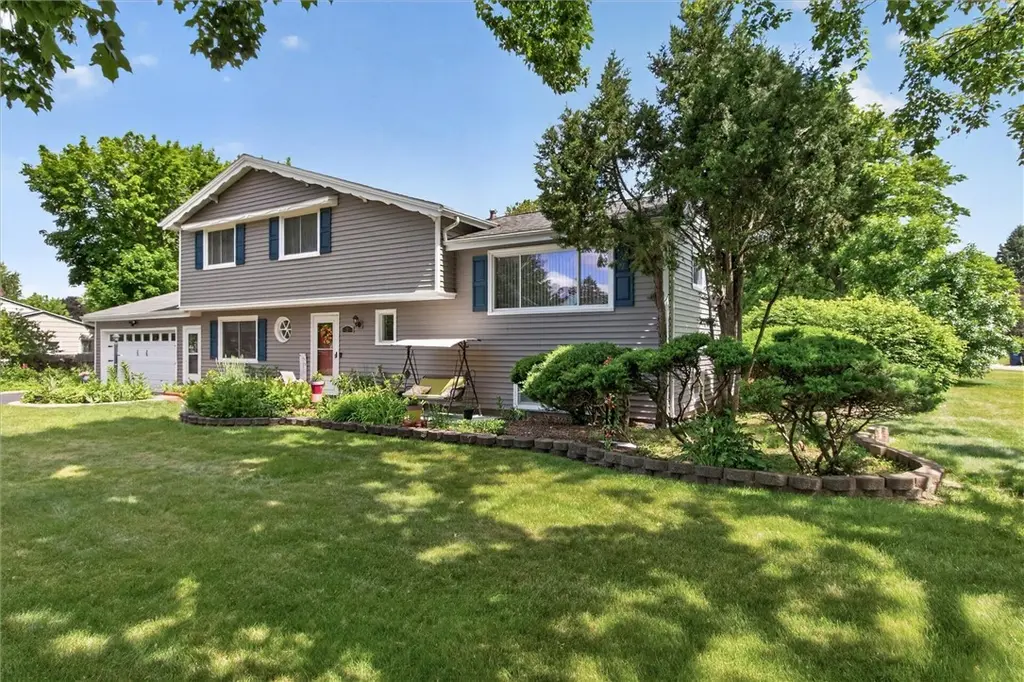
2 Bryn Mawr Rd · Rochester, NY
Flood risk 1/10 · Minimal
- FEMA flood zone
- X (unshaded)
- Chance of flooding over 30 yrs
- 0.0%
- Est. flood insurance / yr
- $473 – $860
Fire risk 1/10 · Minimal
- Est. fire insurance / yr
- $691 – $1,283
Heat risk 2/10 · Minimal
- Hot days now (above 95°F)
- 7 days/yr
- Hot days in 30 yrs
- 15 days/yr
Wind risk 1/10 · Minimal
- Chance of severe wind over 30 yrs
- —
Air-quality risk 2/10 · Minimal
- Unhealthy air days now
- 1 days/yr
- Unhealthy air days in 30 yrs
- 1 days/yr
Risk factors via First Street. Map © Google.
Why this score? — see what drove the D+ grade
The composite is a weighted blend of 9 inputs, each scored 0–100. Each bar is that input's sub-score; the figure is the points it added to the 100-point composite (weight × sub-score).
- Cash flow +12.7/30.0
- ARV discount +12.0/15.0
- 1% rule +5.4/10.0
- DSCR +3.8/10.0
- Livability +3.8/5.0
- Schools +3.6/10.0
- Rent growth +2.5/5.0
- Condition / age +2.5/5.0
- Appreciation +0.0/10.0
$249,900
🖨 Deal sheet 📄 Offer letter ✓ Due diligence
Listing remarks
Beautifully updated split-level home in the Town of Gates & Gates-Chili School District offering 4 bedrooms, 1.5 baths, and 1,864 sq ft of comfortable living space! The inviting updated eat-in kitchen serves as the heart of the home, featuring timeless white shaker cabinetry, stainless steel appliances (included with the home), & plenty of room for everyday dining. Multiple living areas provide flexibility for today's lifestyle, including a bright living room & a spacious family room with fireplace and electric insert. Convenient sliding glass doors lead directly to a large Trex/vinyl deck, creating a seamless indoor-outdoor flow! An easy to access first-floor bedroom &
Key facts
- First-floor bedroom
- Finished basement
- Central air
Tags
Property features AI
Exterior
- Parking: Attached garage with 2 spaces; Driveway; Garage door opener; Garage has electricity
- Utilities: Electricity connected (circuit breakers); Public water connected; Sewer connected; High-speed internet available; Cable available
- Home design: 2-story property; Existing (previously built) condition
- Construction: Vinyl siding; Asphalt architectural shingle roof; Block foundation
- Exterior features: Blacktop driveway; Deck; Patio; Corner lot; Irregular lot; Near public transit; Residential lot; City street frontage
Interior
- Kitchen: Dishwasher; Disposal; Gas oven; Gas range; Refrigerator; Eat-in kitchen (see interior features)
- Bedrooms: One bedroom on the main level
- Flooring: Carpet; Hardwood; Luxury vinyl; Tile; Varies
- Bathrooms: One full bathroom; One half bathroom; One main-level bathroom
- Heating & cooling: Gas forced air heating; Central air conditioning
- Interior features: Ceiling fan(s); Eat-in kitchen; Separate/formal living room; Living/dining room; Sliding glass door(s); Programmable thermostat; Thermal windows; Sliding doors; Accessible bedroom; Basement is finished and has a sump pump
- Laundry & utility: Laundry located in the basement; Gas water heater
Neighborhood map
What this means for you Summary
Snapshot
- This is a 4-bed/1.5-bath single-family listed at $250k.
Deal economics
- At list price, monthly cash flow is $-26 ($-314/yr) — negative.
- To cash-flow at today's rent, offer at most $245k (1.8% below list).
- Meets the 1% rule at list price ($3k rent vs $250k).
- Recommended offer: $245k (1.8% below list) — sets the bar for cash-flow.
- Cap rate 6.2% vs local median 9.3% in Rochester — below-typical yield; the buyer is paying a premium for something (appreciation thesis, condition, location) that the cap rate doesn't capture.
Location & tenants
- Location reads 76/100 on livability (#222 in NY, #3,482 nationally) — a middle-class / working-renter tenant base. Strengths: commute A+, cost of living A+, housing A+; Watch: schools D+, crime F, employment F.
- Gates-Chili Central School District (suburban): math 41% / reading 42% proficiency, ranked #491 of 590 in NY (top 83%) — families likely to look elsewhere, expect single-tenant / working-renter base with shorter leases.
- Market conditions: 127 active listings in the ZIP; solid renter incomes; 1,169 units permitted in Monroe County in 2024 (591 in 5+ unit buildings).
- This rent runs 35% of the median local income ($88k/yr) — at the standard rent-burdened threshold; future hikes will face affordability resistance.
Forward outlook
- Local home prices are declining (-3.0%/yr); year-one equity from $2k of loan paydown is wiped out by about $7k of value loss. Plan a longer hold.
- Monroe County population projected to shrink 6% by 2050 — rents likely to lag national; underwrite the cash flow, not the appreciation.
Negotiation context
- Only 9 days on market — expect competitive offers; lowballing is unlikely to land.
- Current owner paid $119k; list at $250k implies a 110% gain — meaningful room to come down on a strong offer.
Risks & watch-outs
- Watch-outs: property tax is 3.2% of price.
Questions for the listing agent
- What do current leases actually rent for vs. the listed asking? Can we see a recent rent roll and the last 12 months of T-12 income?
- Built in 1966 — when were the roof, HVAC, electrical panel, plumbing, and water heater last replaced?
- Property tax is high relative to price — has the assessment been appealed recently, and will the sale trigger a re-assessment?
- Is there a deadline driving the sale (1031 exchange, divorce, estate, relocation)? That informs how much negotiation room exists.
- Schools are D-rated, which usually means shorter tenancies and higher turnover. Who's the typical renter profile here, and what's been the actual vacancy rate?
- Crime grade is F in this area — have there been break-ins, vandalism, or insurance claims at this property in the last 3 years? What carrier currently insures it and at what premium?
- The area grade is low — what's the realistic commute time and amenity access for the typical tenant pool here? Any planned neighborhood developments (good or bad) we should know about?
- What's the average days-on-market for RENTAL listings here right now (not sales)? A rising rental-DOM trend means longer vacancies and softer asking-rent achievability than the comps imply.
- What's the recent tenant-quality profile in this submarket — average credit score on applications, eviction rate, late-payment / NSF rate, and stable-employment percentage? A property-management company in the area should have these aggregated.
- How much new for-sale + rental construction is in the pipeline within 1–3 miles? Heavy new supply typically softens prices + rents 12–24 months out; constrained supply supports both.
Investment metrics
- 1% rule
- 1.04% ✓
- Cap rate
- 6.17%
- Cash-on-cash
- -0.45%
- DSCR
- 0.98
- GRM
- 8.0
CMA / ARV
- ARV (on-the-fly)
- $277,736
- Comps found
- 12
Show comp detail 12 sales within ~0.75 mi
| Address | Dist | Beds/Ba | Sqft | Sold | Price | $/sf | Match |
|---|---|---|---|---|---|---|---|
| 42 Twin Circle Dr | 0.12mi | 4/2.0 | 1,849 (-1%) | 9mo | $275,000 | $149 | 83 |
| 28 Kernwood Dr | 0.13mi | 4/1.5 | 1,759 (-6%) | 11mo | $290,000 | $165 | 75 |
| 24 Lexington Pkwy | 0.36mi | 4/1.5 | 1,892 (+2%) | 9mo | $225,000 | $119 | 73 |
| 22 Kernwood Dr | 0.16mi | 5/1.5 (+1) | 1,958 (+5%) | 15mo | $300,000 | $153 | 66 |
| 1059 Pixley Rd | 0.48mi | 3/2.5 (-1) | 1,813 (-3%) | 9mo | $270,000 | $149 | 56 |
| 2688 Chili Ave | 0.43mi | 4/2.0 | 1,972 (+6%) | 14mo | $195,000 | $99 | 56 |
| 206 Rowley Dr | 0.61mi | 3/2.5 (-1) | 1,794 (-4%) | 9mo | $241,000 | $134 | 49 |
| 281 Hidden Valley Rd | 0.56mi | 3/2.0 (-1) | 1,678 (-10%) | 10mo | $194,900 | $116 | 41 |
| 111 Brooklea Dr | 0.72mi | 3/2.0 (-1) | 1,755 (-6%) | 12mo | $240,000 | $137 | 40 |
| 1451 Howard Rd | 0.72mi | 3/1.5 (-1) | 1,750 (-6%) | 16mo | $275,000 | $157 | 38 |
| 114 Brooklea Dr | 0.75mi | 3/2.5 (-1) | 1,673 (-10%) | 2mo | $370,000 | $221 | 37 |
| 11 Cardinal Dr | 0.62mi | 5/2.5 (+1) | 2,120 (+14%) | 4mo | $306,525 | $145 | 36 |
Match score weights: distance 35% · size 25% · config 20% · recency 20%. Top-matched comps best support the ARV.
Projected returns pro-forma
-3.0% appreciation · 3.0% rent growth · sell at horizon
- IRR
- -16.9%
- Equity multiple
- 0.40×
- Total profit
- $-41,907
- Equity at exit
- $37,261
- IRR
- -8.6%
- Equity multiple
- 0.46×
- Total profit
- $-37,606
- Equity at exit
- $21,607
Cash invested: $69,972 (down + closing). Projections, not guarantees.
Landlord ↔ Tenant lean methodology
- Overall (STATE)
- 15 Strongly Tenant-Friendly
- State New York
- 15 Strongly Tenant-Friendly · D+10
- County
- — inherits STATE
- City
- — inherits STATE
ZIP-level market 14624
- Active inventory
- 127
- Price-to-rent
- 8.0×
Monthly cashflow live
- Estimated rent
- $2,596 medium interval (Pro) →
- Mortgage (P&I)
- −$1,311
- Tax from tax record
- −$662 /mo · $7,945/yr
- Insurance
- −$104
- HOA
- −$0
- Vacancy / Maint / Mgmt
- −$545
- Net cashflow
- $-26
Break-even live
UW: 25.0% down · 7.5% · 30yr · 1.5% tax · 5.0% vac · 8.0% maint · 8.0% mgmt
Financing live
Cash to close
- Down payment
- $62,475
- Closing costs
- $7,497
- Reserves months
- —
- Total cash needed
- —
Loan-product check · same deal, 3 products live
Conventional
25% down · 7.5% · 30yr
- Down + closing
- —
- Monthly P&I
- —
- Monthly cashflow
- —
- DSCR
- —
- Eligible?
- —
Personal DTI + credit; lowest rate.
DSCR
20% down · 8.5% · 30yr
- Down + closing
- —
- Monthly P&I
- —
- Monthly cashflow
- —
- DSCR
- —
- Eligible?
- —
No personal income docs; deal must DSCR.
Hard money
10% down · 12.0% · 12mo
- Down + closing
- —
- Monthly P&I
- —
- Monthly cashflow
- —
- DSCR
- —
- Eligible?
- —
Short-term bridge; refi at stabilization.
Listing history 7 events
-
2026-06-18days on market $249,900 Active 9 DOM
-
2026-06-17days on market $249,900 Active 8 DOM
-
2026-06-16days on market $249,900 Active 7 DOM
-
2026-06-15days on market $249,900 Active 6 DOM
-
2026-06-13days on market $249,900 Active 4 DOM
-
2026-06-10remarks 687-char remark
-
2026-06-10$249,900 Active 1 DOM
ⓘ Source: listings_history table (triggers on properties + properties_extension) + one-shot
backfill from property_details.listing_events for pre-trigger history.
Tax reassessment forecast NY · Partial reset (capped growth)
- Current annual tax
- $7,945 · $662/mo
- Projected year-2 tax
- $7,945 · $662/mo
- Expected delta
- $0/yr ($0/mo · 0.0%)
ⓘ Screening estimate from a state-policy table — verify with the county assessor before closing.
Climate risk First Street
- Flood 1/10 Low FEMA zone X (unshaded) · 0% chance over 30 yrs
- Wildfire 1/10 Low
- Heat 2/10 Low 7 d/yr ≥95°F today · 15 d/yr by 30 yrs out
- Wind 1/10 Low
- Air quality 2/10 Low 1 unhealthy d/yr today · 1 by 30 yrs out
Nearby sold comps map
Loading sold comps map…
Walkable amenities ~0.75 mi
Loading nearby amenities…
Taxation est. · year 1
- Rental income
- $31,148
- − Mortgage interest
- −$13,998
- − Property taxes
- −$7,945
- − Insurance
- −$1,250
- − Repairs & maintenance
- −$2,492
- − Management
- −$2,492
- − Depreciation
- −$7,270
- Taxable loss
- −$4,299
- Est. tax savings @ 24.0%
- +$1,032
- After-tax cash flow
- $718/yr
For passive investors: Depreciation is non-cash, so a rental often shows a tax loss while cash-flowing — sheltering income. Rental losses are passive: they offset passive income freely, and up to $25,000/yr can offset ordinary (W-2) income if you actively participate and your MAGI is under $100k (phasing out to $0 by $150k); unused losses carry forward. On sale, claimed depreciation is recaptured at up to 25%, and gains may owe capital-gains tax (a 1031 exchange can defer both). Figures are a year-1 estimate at your 24.0% rate — not tax advice; consult a CPA.
Schools (NCES district)
- District
- Gates-Chili Central School District
- NCES district ID
- 3611880
- Math proficiency
- 41% ▼ -12.00%
- Reading proficiency
- 42% ▼ -6.00%
- Median HH income
- $55,045
- Composite
- 36.23/100
- National rank
- #4719
- State rank
- #491 of 590 in NY
Livability — Rochester
- Score
- 76/100
- State rank
- #222
- US rank
- #3482
Category grades
Schools grade is shown separately in the Schools card above.
Census & demographics
- County
- Monroe County · 674,131 people
- City population
- 432,803
- Metro
- Rochester, NY
- Population (ZIP)
- 38,626
- Household income
- $87,989
- Rent vs Own
- Severe rent burden
- 584.0
Population outlook (Monroe County) Hauer SSP2
- Today (2025)
- 759,460 people
- By 2030
- 757,154 · -0.3%
- By 2040
- 740,644 · -2.5%
- By 2050
- 714,443 · -5.9%
- By 2075
- 645,883 · -15.0%
- By 2100
- 547,084 · -28.0%
Race, ethnicity, and origin ACS 2023
- Neighborhood character
- Predominantly White (78%)
- Race & ethnicity
- White 78% Black 9% Hispanic / Latino 6% Two or more races 5% Asian 3%
- Hispanic origin (detail)
- Puerto Rican 4%
- Common ancestry
- Romanian 6% Iranian 2% Lithuanian 2%
- Foreign-born
- 7% · Canada, China, India
- Languages at home
- 90% English-only · Spanish 3% Other Indo-European 3% Russian/Polish/Slavic 1%
Political lean MEDSL · Monroe
- 2024 margin
- D (+19.1) · D 59.5% · R 40.5%
- 2008→2024 swing
- +1.4pp toward D · 2008: 17.7pp · 2024: 19.1pp
- All cycles
- 2024: D+19.1 2020: D+21.0 2016: D+14.1 2012: D+17.4 2008: D+17.7
Not yet ingested
- Civics
- —
Market trends
- HPI YoY
- ▼ -151.26%
- Current HPI
- 267.356
- Rent YoY
- —
- Metro
- Rochester, NY
- State GDP YoY
- ▲ 2.60%
- F500 in state
- 92
Industry mix (Fortune 500 HQ in NY)
| Industry | F500 HQs | Revenue |
|---|---|---|
| Financial Services | 10 | $950B |
|
||
| Consumer Goods | 9 | $162B |
|
||
| Insurance | 4 | $225B |
|
||
| Telecommunications | 2 | $144B |
|
||
| Pharmaceuticals | 2 | $112B |
|
||
| Media / Entertainment | 2 | $69B |
|
||
Price history
+706.1% since first listed4 events — show timeline
- 2026-06-09 Listed $249,900 UNYREIS
- 2001-07-03 Sold (Public Records) $119,000 Public Records
- 2000-04-10 Sold (Public Records) $116,000 Public Records
- 1999-09-20 Sold (Public Records) $31,000 Public Records
Property tax history
+4.1%/yrLatest (2025): $7,945 · +24.1% YoY. Source: county tax records.
Cash-flow waterfall
monthlySold comps — $/sqft
last 12 mo · ≤1 miLoading sold comps…