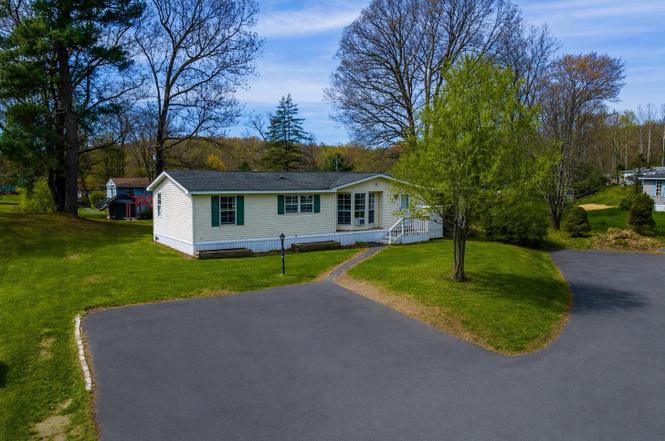
16 Birch Ln · Bloomingburg, NY
Flood risk 1/10 · Minimal
- FEMA flood zone
- X (unshaded)
- Chance of flooding over 30 yrs
- 0.0%
- Est. flood insurance / yr
- $507 – $1,088
Fire risk 3/10 · Minor
- Est. fire insurance / yr
- $691 – $1,283
Heat risk 4/10 · Minor
- Hot days now (above 99°F)
- 7 days/yr
- Hot days in 30 yrs
- 16 days/yr
Wind risk 3/10 · Minor
- Chance of severe wind over 30 yrs
- 8.0%
Air-quality risk 2/10 · Minimal
- Unhealthy air days now
- 1 days/yr
- Unhealthy air days in 30 yrs
- 1 days/yr
Risk factors via First Street. Map © Google.
Why this score? — see what drove the C+ grade
The composite is a weighted blend of 9 inputs, each scored 0–100. Each bar is that input's sub-score; the figure is the points it added to the 100-point composite (weight × sub-score).
- Cash flow +30.0/30.0
- 1% rule +10.0/10.0
- DSCR +10.0/10.0
- Schools +3.8/10.0
- Rent growth +2.5/5.0
- Livability +2.5/5.0
- Condition / age +2.2/5.0
- Appreciation +1.6/10.0
- ARV discount +1.1/15.0
$99,999
🖨 Deal sheet (PDF) 📄 Offer letter ✓ Due diligence
Listing remarks
Welcome to this charming 3-bedroom, 2-full-bathroom home beautifully situated within the welcoming Whispering Pines Mobile Home community in the Pine Bush School District. The location is incredibly convenient, situated just 5 minutes from Interstate 86 and a short 15-minute drive from the business district of the City of Middletown. In the other direction, a 15-minute drive takes you to the hamlet of Pine Bush, featuring a variety of local eateries, shopping boutiques, Crawford Town Park, and all grade-level schools. Additionally, this home is located within 30 minutes to several major attractions including the Kartrite Water Park, Resorts World Catskills casino, and Legoland, and is near
Key facts
- Built 1988
- Listed 24 days
Neighborhood map
What this means for you Summary
Snapshot
- This is a 3-bed/2.0-bath manufactured listed at $100k. Condition is rated fair.
Deal economics
- At list price, monthly cash flow is $417 ($5k/yr) — positive.
- The deal already cash-flows at list — no discount required.
- Meets the 1% rule at list price ($3k rent vs $100k).
- Recommended offer: $98k (1.5% below list) — sets the bar for market timing.
- Cap rate 11.3% vs local median 3.6% in Bloomingburg — top-decile yield for the area; either an underpriced asset or a hidden risk that comps aren't pricing in. Stress-test before assuming the spread holds.
Location & tenants
- Location reads 49/100 on livability (#1,175 in NY) — a working-class tenant base; expect higher turnover. Watch: cost of living D+, housing D+, schools F.
- Pine Bush Central School District (rural): math 38% / reading 45% proficiency, ranked #468 of 590 in NY (top 79%) — families likely to look elsewhere, expect single-tenant / working-renter base with shorter leases.
- Market conditions: 83 active listings in the ZIP; 1 comparable units currently listed for rent nearby; 739 units permitted in Sullivan County in 2024 (5 in 5+ unit buildings).
Forward outlook
- Local home prices are declining (-3.0%/yr); year-one equity from $691 of loan paydown is wiped out by about $3k of value loss. Plan a longer hold.
- Sullivan County population projected at -24% by 2050 — secular population decline; favor cash flow + early exit over multi-decade hold.
- At projected returns (-3.0% appreciation + 3.0% rent growth), your $28k cash investment doubles in ~7 years — after that, you're playing with house money.
Negotiation context
- It's been on market 24 days — a 2% lower offer ($98k) is reasonable based on typical stale-listing flexibility.
Risks & watch-outs
- Watch-outs: HOA is 38% of rent.
Questions for the listing agent
- Have any recent inspections been done? Can we get a copy of the seller's disclosures and any deferred-maintenance estimates?
- What does the HOA fee cover, when was the last increase, and are there any pending special assessments or reserve-fund shortfalls?
- Is there a deadline driving the sale (1031 exchange, divorce, estate, relocation)? That informs how much negotiation room exists.
- Schools are F-rated, which usually means shorter tenancies and higher turnover. Who's the typical renter profile here, and what's been the actual vacancy rate?
- Crime grade is F in this area — have there been break-ins, vandalism, or insurance claims at this property in the last 3 years? What carrier currently insures it and at what premium?
- What's the average days-on-market for RENTAL listings here right now (not sales)? A rising rental-DOM trend means longer vacancies and softer asking-rent achievability than the comps imply.
- What's the recent tenant-quality profile in this submarket — average credit score on applications, eviction rate, late-payment / NSF rate, and stable-employment percentage? A property-management company in the area should have these aggregated.
- How much new for-sale + rental construction is in the pipeline within 1–3 miles? Heavy new supply typically softens prices + rents 12–24 months out; constrained supply supports both.
Investment metrics
- 1% rule
- 2.70% ✓
- Cap rate
- 11.30%
- Cash-on-cash
- 17.87%
- DSCR
- 1.80
- GRM
- 3.1
CMA / ARV
- ARV (median comp)
- $87,483
- List price
- $99,999
- Delta
- 14.31%
- Verdict
- OVERPRICED
- Comps
- 6 within 1.0 mi
Show comp detail 5 sales within ~0.75 mi
| Address | Dist | Beds/Ba | Sqft | Sold | Price | $/sf | Match |
|---|---|---|---|---|---|---|---|
| 12 Birch Ln | 0.02mi | 3/2.0 | 1,500 (0%) | 8mo | $85,000 | $57 | 92 |
| 3 Pine Ct | 0.40mi | 3/2.0 | 1,500 (0%) | 2mo | $96,700 | $64 | 79 |
| 74 Pine Dr | 0.10mi | 3/2.0 | 1,620 (+8%) | 4mo | $115,000 | $71 | 79 |
| 24 Birch Ln | 0.06mi | 3/2.0 | 1,291 (-14%) | 16mo | $57,500 | $45 | 60 |
| 117 White Birch Trl | 0.45mi | 3/2.0 | 1,344 (-10%) | 2mo | $86,000 | $64 | 60 |
Match score weights: distance 35% · size 25% · config 20% · recency 20%. Top-matched comps best support the ARV.
Projected returns pro-forma
-3.0% appreciation · 3.0% rent growth · sell at horizon
- IRR
- 9.9%
- Equity multiple
- 1.39×
- Total profit
- $11,021
- Equity at exit
- $14,910
- IRR
- 19.4%
- Equity multiple
- 2.66×
- Total profit
- $46,515
- Equity at exit
- $8,646
Cash invested: $28,000 (down + closing). Projections, not guarantees.
Landlord ↔ Tenant lean methodology
- Overall (STATE)
- 15 Strongly Tenant-Friendly
- State New York
- 15 Strongly Tenant-Friendly · D+10
- County
- — inherits STATE
- City
- — inherits STATE
ZIP-level market 12721
- Home prices YoY
- -2.1%
- Active inventory
- 83
- Price-to-rent
- 3.1×
Monthly cashflow live
- Estimated rent
- $2,700 medium interval (Pro) →
- Mortgage (P&I)
- −$524
- Tax est. 1.5%
- −$125 /mo · $1,500/yr
- Insurance
- −$42
- HOA
- −$1,025
- Vacancy / Maint / Mgmt
- −$567
- Net cashflow
- $417
Break-even live
Sensitivity live
| Price | -10% $486 | -5% $451 | +0% $417 | +5% $382 | +10% $348 |
|---|---|---|---|---|---|
| Rent | -10% $204 | -5% $310 | +0% $417 | +5% $524 | +10% $630 |
| Rate | -1.0pp $467 | -0.5pp $442 | base $417 | +0.5pp $391 | +1.0pp $365 |
UW: 25.0% down · 7.5% · 30yr · 1.5% tax · 5.0% vac · 8.0% maint · 8.0% mgmt
Financing live
Cash to close
- Down payment
- $25,000
- Closing costs
- $3,000
- Reserves months
- —
- Total cash needed
- —
Loan-product check · same deal, 3 products live
Conventional
25% down · 7.5% · 30yr
- Down + closing
- —
- Monthly P&I
- —
- Monthly cashflow
- —
- DSCR
- —
- Eligible?
- —
Personal DTI + credit; lowest rate.
DSCR
20% down · 8.5% · 30yr
- Down + closing
- —
- Monthly P&I
- —
- Monthly cashflow
- —
- DSCR
- —
- Eligible?
- —
No personal income docs; deal must DSCR.
Hard money
10% down · 12.0% · 12mo
- Down + closing
- —
- Monthly P&I
- —
- Monthly cashflow
- —
- DSCR
- —
- Eligible?
- —
Short-term bridge; refi at stabilization.
Rent comps 1 comps
| Address | Beds | Baths | Sqft | Rent | $/sqft | DOM | Units | Dist |
|---|---|---|---|---|---|---|---|---|
| 90 North Rd Bloomingburg, NY | 3.0 | 1.0 | 1400 | $2,700 | $1.93 | 19d | 1 | 0.78mi |
HOA detail
- Monthly dues
- $1,025 · $12,300/yr
- Likely covers
- water
Listing history 3 events
-
2026-06-19statusdays on market $99,999 Pending 24 DOM
-
2026-04-25$99,999 Active
-
2026-04-22historical
ⓘ Source: listings_history table (triggers on properties + properties_extension) + one-shot
backfill from property_details.listing_events for pre-trigger history.
Climate risk First Street
- Flood 1/10 Low FEMA zone X (unshaded) · 0% chance over 30 yrs
- Wildfire 3/10 Moderate
- Heat 4/10 Moderate 7 d/yr ≥99°F today · 16 d/yr by 30 yrs out
- Wind 3/10 Moderate 8% chance of damaging wind over 30 yrs
- Air quality 2/10 Low 1 unhealthy d/yr today · 1 by 30 yrs out
Nearby sold comps map
Loading sold comps map…
Walkable amenities ~0.75 mi
Loading nearby amenities…
Taxation est. · year 1
- Rental income
- $32,400
- − Mortgage interest
- −$5,601
- − Property taxes
- −$1,500
- − Insurance
- −$500
- − Repairs & maintenance
- −$2,592
- − Management
- −$2,592
- − HOA
- −$12,300
- − Depreciation
- −$2,909
- Taxable income
- $4,405
- Est. tax owed @ 24.0%
- −$1,057
- After-tax cash flow
- $3,946/yr
For passive investors: Depreciation is non-cash, so a rental often shows a tax loss while cash-flowing — sheltering income. Rental losses are passive: they offset passive income freely, and up to $25,000/yr can offset ordinary (W-2) income if you actively participate and your MAGI is under $100k (phasing out to $0 by $150k); unused losses carry forward. On sale, claimed depreciation is recaptured at up to 25%, and gains may owe capital-gains tax (a 1031 exchange can defer both). Figures are a year-1 estimate at your 24.0% rate — not tax advice; consult a CPA.
Condition & rehab AI · 12 photos
This home requires moderate renovations, including painting, updating bathrooms and kitchen, and landscaping improvements. These updates will significantly increase its resale and rental value.
Repairs flagged
- Minor Paint — The interior walls and ceilings show some wear and tear.
- Minor Bathroom Fixtures — The bathrooms have dated fixtures and color schemes.
- Minor Kitchen Appliances — The kitchen has dated cabinetry and appliances.
- Minor Landscaping — The landscaping is maintained but could be improved for curb appeal.
Value-add opportunities
- Both Painting the interior and exterior — Fresh paint can improve the home's curb appeal and interior aesthetics.
- Both Updating the bathrooms with new fixtures and color schemes — Modernizing the bathrooms can significantly improve the home's value.
- Both Updating the kitchen with new cabinetry and appliances — A modern kitchen can greatly enhance the home's value and appeal to potential buyers.
- Both Landscaping improvements — A well-maintained and aesthetically pleasing landscape can greatly improve the home's curb appeal and overall value.
Renovation cost estimate screening
| Repair item | Severity | Est. cost |
|---|---|---|
| Paint · The interior walls and ceilings show some wear and tear. | Minor | $500–3,000 |
| Bathroom Fixtures · The bathrooms have dated fixtures and color schemes. | Minor | $500–3,000 |
| Kitchen Appliances · The kitchen has dated cabinetry and appliances. | Minor | $500–3,000 |
| Landscaping · The landscaping is maintained but could be improved for curb appeal. | Minor | $500–3,000 |
| Total estimated repair cost · 4 items | $2,000–12,000 |
Value-add ROI direction
- Both Painting the interior and exterior — Fresh paint can improve the home's curb appeal and interior aesthetics. ↑
- Both Updating the bathrooms with new fixtures and color schemes — Modernizing the bathrooms can significantly improve the home's value. ↑
- Both Updating the kitchen with new cabinetry and appliances — A modern kitchen can greatly enhance the home's value and appeal to potential buyers. ↑
- Both Landscaping improvements — A well-maintained and aesthetically pleasing landscape can greatly improve the home's curb appeal and overall value. ↑
ⓘ Cost ranges are severity-bucket heuristics (US national rule-of-thumb). Get contractor quotes + a written scope before underwriting a rehab budget.
Schools (NCES district)
- District
- Pine Bush Central School District
- NCES district ID
- 3623010
- Math proficiency
- 38% ▼ -16.00%
- Reading proficiency
- 45% ▼ -7.00%
- Median HH income
- $72,525
- Composite
- 37.87/100
- National rank
- #4324
- State rank
- #468 of 590 in NY
Livability — Bloomingburg
- Score
- 49/100
- State rank
- #1175
- US rank
- #25817
Category grades
Schools grade is shown separately in the Schools card above.
Census & demographics
- Population (ZIP)
- 7,590
Population outlook (Sullivan County) Hauer SSP2
- Today (2025)
- 68,974 people
- By 2030
- 65,609 · -4.9%
- By 2040
- 58,878 · -14.6%
- By 2050
- 52,500 · -23.9%
- By 2075
- 39,941 · -42.1%
- By 2100
- 28,880 · -58.1%
Race, ethnicity, and origin ACS 2023
- Neighborhood character
- Predominantly White (76%)
- Race & ethnicity
- White 76% Two or more races 14% Hispanic / Latino 13% Black 3% Asian 1%
- Hispanic origin (detail)
- Puerto Rican 8% Cuban 2% Dominican 2%
- Common ancestry
- Romanian 4% Scandinavian 4% Iranian 3%
- Foreign-born
- 4% · Canada
- Languages at home
- 79% English-only · German/W. Germanic 12% Spanish 5% Other Indo-European 1%
Political lean MEDSL · Sullivan
- 2024 margin
- R (+16.7) · D 41.6% · R 58.4%
- 2008→2024 swing
- -26.2pp toward R · 2008: 9.5pp · 2024: -16.7pp
- All cycles
- 2024: R+16.7 2020: R+9.2 2016: R+13.7 2012: D+10.4 2008: D+9.5
Not yet ingested
- Civics
- —
Market trends
- HPI YoY
- ▼ -6.80%
- Current HPI
- 320.383
- Rent YoY
- —
- Metro
- —
- State GDP YoY
- ▲ 2.60%
- F500 in state
- 92
Industry mix (Fortune 500 HQ in NY)
| Industry | F500 HQs | Revenue |
|---|---|---|
| Financial Services | 10 | $950B |
|
||
| Consumer Goods | 9 | $162B |
|
||
| Insurance | 4 | $225B |
|
||
| Telecommunications | 2 | $144B |
|
||
| Pharmaceuticals | 2 | $112B |
|
||
| Media / Entertainment | 2 | $69B |
|
||
Price history
2 events — show timeline
- 2026-04-25 Listed $99,999 OneKey® MLS as Distributed by MLS Grid
- 2026-04-22 Coming Soon — OneKey® MLS as Distributed by MLS Grid
Cash-flow waterfall
monthlySold comps — $/sqft
last 12 mo · ≤1 miLoading sold comps…