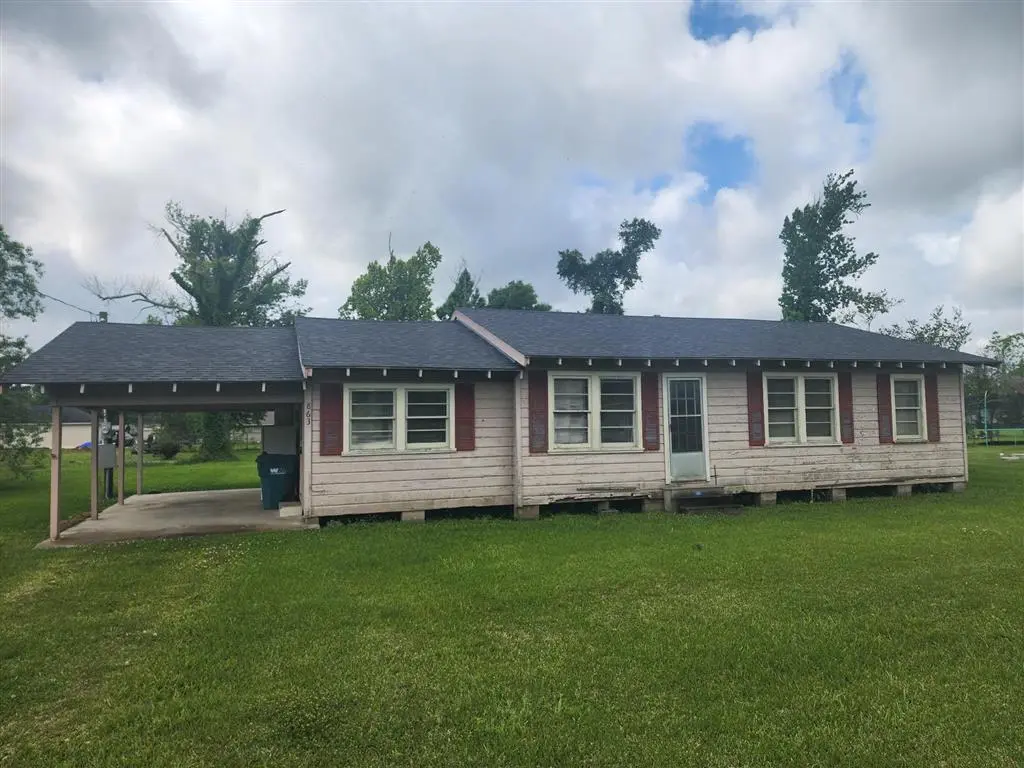
863 Cooley Rd · Moss Bluff, LA
Flood risk 1/10 · Minimal
- FEMA flood zone
- X (unshaded)
- Chance of flooding over 30 yrs
- 0.0%
- Est. flood insurance / yr
- $507 – $1,088
Fire risk 2/10 · Minimal
- Est. fire insurance / yr
- $1,269 – $2,357
Heat risk 8/10 · Major
- Hot days now (above 109°F)
- 7 days/yr
- Hot days in 30 yrs
- 22 days/yr
Wind risk 9/10 · Severe
- Chance of severe wind over 30 yrs
- 99.0%
Air-quality risk 2/10 · Minimal
- Unhealthy air days now
- 1 days/yr
- Unhealthy air days in 30 yrs
- 1 days/yr
Risk factors via First Street. Map © Google.
Why this score? — see what drove the B- grade
The composite is a weighted blend of 9 inputs, each scored 0–100. Each bar is that input's sub-score; the figure is the points it added to the 100-point composite (weight × sub-score).
- Cash flow +30.0/30.0
- 1% rule +10.0/10.0
- DSCR +10.0/10.0
- ARV discount +7.5/15.0
- Livability +3.6/5.0
- Schools +3.1/10.0
- Rent growth +2.5/5.0
- Condition / age +2.5/5.0
- Appreciation +0.0/10.0
$79,000
🖨 Deal sheet 📄 Offer letter ✓ Due diligence
Listing remarks
Investor special in Moss Bluff! This 3-bedroom, 1-bath home sits on a spacious half-acre lot, offering plenty of room to expand, renovate, or create your ideal outdoor space. Conveniently located near Moss Bluff Middle School and Sam Houston High School, with easy access to shopping, dining, and everyday essentials. Whether you're looking to add to your rental portfolio or take on your next flip project, this property has solid potential in a desirable area. Don’t miss this opportunity! Measurements m/l
Key facts
- Half-acre lot
- 0.51 acre lot
- Parking
Tags
Property features AI
Exterior
- Parking: 1 total parking space; 1-car carport
- Utilities: Public water; Private sewer; Natural gas connected; Sewer connected; Water connected
- Home design: Single-family house; Single story; Residential property; Fixer condition
- Exterior features: Back yard; City lot; Rectangular lot
Interior
- Kitchen: Dishwasher; Electric oven; Gas range; Refrigerator; Water heater
- Bedrooms: 3 bedrooms on the main level
- Bathrooms: 1 full bathroom on the main level
- Heating & cooling: Central heating; Central air conditioning
- Interior features: Kitchen island
Neighborhood map
What this means for you Summary
Snapshot
- This is a 3-bed/1.0-bath single-family listed at $79k.
Deal economics
- At list price, monthly cash flow is $712 ($9k/yr) — positive.
- The deal already cash-flows at list — no discount required.
- Meets the 1% rule at list price ($2k rent vs $79k).
- Recommended offer: $78k (1.5% below list) — sets the bar for market timing.
- Cap rate 17.1% vs local median 3.5% in Moss Bluff — top-decile yield for the area; either an underpriced asset or a hidden risk that comps aren't pricing in. Stress-test before assuming the spread holds.
Location & tenants
- Location reads 72/100 on livability (#39 in LA) — a middle-class / working-renter tenant base. Strengths: cost of living A+, housing A+, employment A; Watch: amenities F, commute F.
- Calcasieu Parish (other): math 30% / reading 44% proficiency, ranked #29 of 98 in LA (top 30%) — families likely to look elsewhere, expect single-tenant / working-renter base with shorter leases.
- Zoned schools: Sam Houston High School (math 46% / reading 54%, grade D+, #36 of 265 statewide, top 13%, 1,216 students, 36% FRL) — zoned schools average 36% FRL vs 52% district-wide (16 pts lower); this property's tenant base skews higher-income than the district average.
- Zoned-school proficiency averages 50% at this address vs 37% district-wide (+13 pts) — the actual schools serving this property are materially stronger than the Calcasieu Parish average implies; a family-tenant draw the district grade alone would hide.
- Market conditions: 322 active listings in the ZIP; 2 comparable units currently listed for rent nearby; solid renter incomes; 1,298 units permitted in Calcasieu Parish in 2024 (526 in 5+ unit buildings).
- This rent is only 18% of the median local income ($102k/yr) — well below the 30% rent-burden line; pricing power to push rent on renewal without tenant pushback.
Forward outlook
- Local home prices are declining (-3.0%/yr); year-one equity from $546 of loan paydown is wiped out by about $2k of value loss. Plan a longer hold.
- Calcasieu County population projected at +11% by 2050 — modest demand growth; plan on rents tracking national, not racing it.
- At projected returns (-3.0% appreciation + 3.0% rent growth), your $22k cash investment doubles in ~4 years — after that, you're playing with house money.
Negotiation context
- It's been on market 28 days — a 2% lower offer ($78k) is reasonable based on typical stale-listing flexibility.
Risks & watch-outs
- Climate carrying-cost: severe wind risk, 99% chance of damaging wind over 30y; extreme-heat days projected 7→22/yr by 2055 (HVAC capex compounding) — expect insurance premiums to compound above CPI over the hold.
Questions for the listing agent
- Built in 1975 — when were the roof, HVAC, electrical panel, plumbing, and water heater last replaced?
- Is there a deadline driving the sale (1031 exchange, divorce, estate, relocation)? That informs how much negotiation room exists.
- Schools are D-rated, which usually means shorter tenancies and higher turnover. Who's the typical renter profile here, and what's been the actual vacancy rate?
- What's the average days-on-market for RENTAL listings here right now (not sales)? A rising rental-DOM trend means longer vacancies and softer asking-rent achievability than the comps imply.
- What's the recent tenant-quality profile in this submarket — average credit score on applications, eviction rate, late-payment / NSF rate, and stable-employment percentage? A property-management company in the area should have these aggregated.
- How much new for-sale + rental construction is in the pipeline within 1–3 miles? Heavy new supply typically softens prices + rents 12–24 months out; constrained supply supports both.
Investment metrics
- 1% rule
- 1.92% ✓
- Cap rate
- 17.11%
- Cash-on-cash
- 38.63%
- DSCR
- 2.72
- GRM
- 4.3
CMA / ARV
- ARV (median comp)
- $211,050
- List price
- $79,000
- Delta
- -62.57%
- Verdict
- UNDERPRICED
- Comps
- 20 within 1.0 mi
Show comp detail 3 sales within ~0.75 mi
| Address | Dist | Beds/Ba | Sqft | Sold | Price | $/sf | Match |
|---|---|---|---|---|---|---|---|
| 131 Feinstein Rd | 0.24mi | 3/2.0 | 1,268 (-6%) | 21mo | $178,000 | $140 | 57 |
| 985 Cooley Rd | 0.15mi | 3/2.0 | 1,216 (-10%) | 22mo | $130,000 | $107 | 54 |
| 315 Champagne Cir | 0.72mi | 3/2.0 | 1,366 (+1%) | 12mo | $149,900 | $110 | 51 |
Match score weights: distance 35% · size 25% · config 20% · recency 20%. Top-matched comps best support the ARV.
Projected returns pro-forma
-3.0% appreciation · 3.0% rent growth · sell at horizon
- IRR
- 34.8%
- Equity multiple
- 2.47×
- Total profit
- $32,541
- Equity at exit
- $11,779
- IRR
- 41.6%
- Equity multiple
- 4.92×
- Total profit
- $86,689
- Equity at exit
- $6,830
Cash invested: $22,120 (down + closing). Projections, not guarantees.
Landlord ↔ Tenant lean methodology
- Overall (STATE)
- 90 Strongly Landlord-Friendly
- State Louisiana
- 90 Strongly Landlord-Friendly · R+12
- County
- — inherits STATE
- City
- — inherits STATE
ZIP-level market 70611
- Active inventory
- 322
- Price-to-rent
- 4.3×
Monthly cashflow live
- Estimated rent
- $1,521 medium interval (Pro) →
- Mortgage (P&I)
- −$414
- Tax from tax record
- −$42 /mo · $504/yr
- Insurance
- −$33
- HOA
- −$0
- Vacancy / Maint / Mgmt
- −$319
- Net cashflow
- $712
Break-even live
UW: 25.0% down · 7.5% · 30yr · 1.5% tax · 5.0% vac · 8.0% maint · 8.0% mgmt
Financing live
Cash to close
- Down payment
- $19,750
- Closing costs
- $2,370
- Reserves months
- —
- Total cash needed
- —
Loan-product check · same deal, 3 products live
Conventional
25% down · 7.5% · 30yr
- Down + closing
- —
- Monthly P&I
- —
- Monthly cashflow
- —
- DSCR
- —
- Eligible?
- —
Personal DTI + credit; lowest rate.
DSCR
20% down · 8.5% · 30yr
- Down + closing
- —
- Monthly P&I
- —
- Monthly cashflow
- —
- DSCR
- —
- Eligible?
- —
No personal income docs; deal must DSCR.
Hard money
10% down · 12.0% · 12mo
- Down + closing
- —
- Monthly P&I
- —
- Monthly cashflow
- —
- DSCR
- —
- Eligible?
- —
Short-term bridge; refi at stabilization.
Rent comps 2 comps
| Address | Beds | Baths | Sqft | Rent | $/sqft | DOM | Units | Dist |
|---|---|---|---|---|---|---|---|---|
| 1492 Becky St Lake Charles, LA | 3.0 | 2.0 | 1600 | $1,850 | $1.16 | 43d | 1 | 0.91mi |
| 412 N Highway 171 Lake Charles, LA | 3.0 | 2.0 | 1400 | $1,700 | $1.21 | 20d | 1 | 1.32mi |
Listing history 5 events
-
2026-06-02status $79,000 Pending 28 DOM
-
2026-06-01days on market $79,000 Active 28 DOM
-
2026-05-31days on market $79,000 Active 27 DOM
-
2026-05-30days on market $79,000 Active 26 DOM
-
2026-05-04$79,000 Active 514-char remark
ⓘ Source: listings_history table (triggers on properties + properties_extension) + one-shot
backfill from property_details.listing_events for pre-trigger history.
Tax reassessment forecast LA · Resets to sale price
- Current annual tax
- $504 · $42/mo
- Projected year-2 tax
- $504 · $42/mo
- Expected delta
- $0/yr ($0/mo · 0.0%)
ⓘ Screening estimate from a state-policy table — verify with the county assessor before closing.
Climate risk First Street
- Flood 1/10 Low FEMA zone X (unshaded) · 0% chance over 30 yrs
- Wildfire 2/10 Low
- Heat 8/10 Severe 7 d/yr ≥109°F today · 22 d/yr by 30 yrs out
- Wind 9/10 Extreme 99% chance of damaging wind over 30 yrs
- Air quality 2/10 Low 1 unhealthy d/yr today · 1 by 30 yrs out
Nearby sold comps map
Loading sold comps map…
Walkable amenities ~0.75 mi
Loading nearby amenities…
Taxation est. · year 1
- Rental income
- $18,248
- − Mortgage interest
- −$4,425
- − Property taxes
- −$504
- − Insurance
- −$395
- − Repairs & maintenance
- −$1,460
- − Management
- −$1,460
- − Depreciation
- −$2,298
- Taxable income
- $7,706
- Est. tax owed @ 24.0%
- −$1,849
- After-tax cash flow
- $6,696/yr
For passive investors: Depreciation is non-cash, so a rental often shows a tax loss while cash-flowing — sheltering income. Rental losses are passive: they offset passive income freely, and up to $25,000/yr can offset ordinary (W-2) income if you actively participate and your MAGI is under $100k (phasing out to $0 by $150k); unused losses carry forward. On sale, claimed depreciation is recaptured at up to 25%, and gains may owe capital-gains tax (a 1031 exchange can defer both). Figures are a year-1 estimate at your 24.0% rate — not tax advice; consult a CPA.
Schools (NCES district)
- District
- Calcasieu Parish
- NCES district ID
- 2200330
- Math proficiency
- 30% ▼ -39.00%
- Reading proficiency
- 44% ▼ -33.00%
- Median HH income
- $44,700
- Composite
- 31.45/100
- National rank
- #5979
- State rank
- #29 of 98 in LA
Livability — Moss Bluff
- Score
- 72/100
- State rank
- #39
- US rank
- #6117
Category grades
Schools grade is shown separately in the Schools card above.
Census & demographics
- Census place
- Moss Bluff, LA
- County
- Calcasieu Parish · 170,889 people
- Metro
- Lake Charles, LA
- Population (ZIP)
- 22,124
- Household income
- $101,844
- Rent vs Own
- Severe rent burden
- 183.0
Population outlook (Calcasieu County) Hauer SSP2
- Today (2025)
- 212,179 people
- By 2030
- 218,199 · +2.8%
- By 2040
- 228,486 · +7.7%
- By 2050
- 236,208 · +11.3%
- By 2075
- 251,696 · +18.6%
- By 2100
- 247,848 · +16.8%
Race, ethnicity, and origin ACS 2023
- Neighborhood character
- Predominantly White (84%)
- Race & ethnicity
- White 84% Black 11% Two or more races 3% Hispanic / Latino 2%
- Common ancestry
- Lithuanian 10% Slovak 2% Italian 1%
- Foreign-born
- 1% · Canada
- Languages at home
- 97% English-only · French/Haitian/Cajun 1% Spanish 1%
Political lean MEDSL · Calcasieu
- 2024 margin
- Solid R (+39.6) · D 29.5% · R 69.0% · Other 1.5%
- 2008→2024 swing
- -15.0pp toward R · 2008: -24.6pp · 2024: -39.6pp
- All cycles
- 2024: R+39.6 2020: R+35.2 2016: R+33.3 2012: R+28.7 2008: R+24.6
Not yet ingested
- Civics
- —
Market trends
- HPI YoY
- ▼ -84.82%
- Current HPI
- 115.0052
- Rent YoY
- —
- Metro
- Lake Charles, LA
- State GDP YoY
- ▲ 3.29%
- F500 in state
- 10
Industry mix (Fortune 500 HQ in LA)
| Industry | F500 HQs | Revenue |
|---|---|---|
| Telecommunications | 2 | $23B |
|
||
| Utilities | 1 | $12B |
|
||
| Wholesale / Distribution | 1 | $5B |
|
||
| Advertising | 1 | $2B |
|
||
Price history
2 events — show timeline
- 2026-06-02 Pending — SWLAR
- 2026-05-04 Listed $79,000 SWLAR
Property tax history
-0.1%/yrLatest (2025): $504 · +1.6% YoY. Source: county tax records.
Cash-flow waterfall
monthlySold comps — $/sqft
last 12 mo · ≤1 miLoading sold comps…