4900 SW 45 St · Ocala, FL
Flood risk 1/10 · Minimal
- FEMA flood zone
- X (unshaded)
- Chance of flooding over 30 yrs
- 0.0%
- Est. flood insurance / yr
- $507 – $1,088
Fire risk 4/10 · Minor
- Est. fire insurance / yr
- $947 – $1,759
Heat risk 9/10 · Severe
- Hot days now (above 107°F)
- 7 days/yr
- Hot days in 30 yrs
- 24 days/yr
Wind risk 9/10 · Severe
- Chance of severe wind over 30 yrs
- 99.0%
Air-quality risk 2/10 · Minimal
- Unhealthy air days now
- 2 days/yr
- Unhealthy air days in 30 yrs
- 2 days/yr
Risk factors via First Street. Map © Google.
Why this score? — see what drove the D grade
The composite is a weighted blend of 9 inputs, each scored 0–100. Each bar is that input's sub-score; the figure is the points it added to the 100-point composite (weight × sub-score).
- ARV discount +15.0/15.0
- Cash flow +6.9/30.0
- 1% rule +4.9/10.0
- Schools +3.6/10.0
- Livability +3.5/5.0
- Rent growth +2.5/5.0
- Condition / age +2.5/5.0
- DSCR +1.1/10.0
- Appreciation +0.0/10.0
$160,000
🖨 Deal sheet (PDF) 📄 Offer letter ✓ Due diligence
Listing remarks MLS
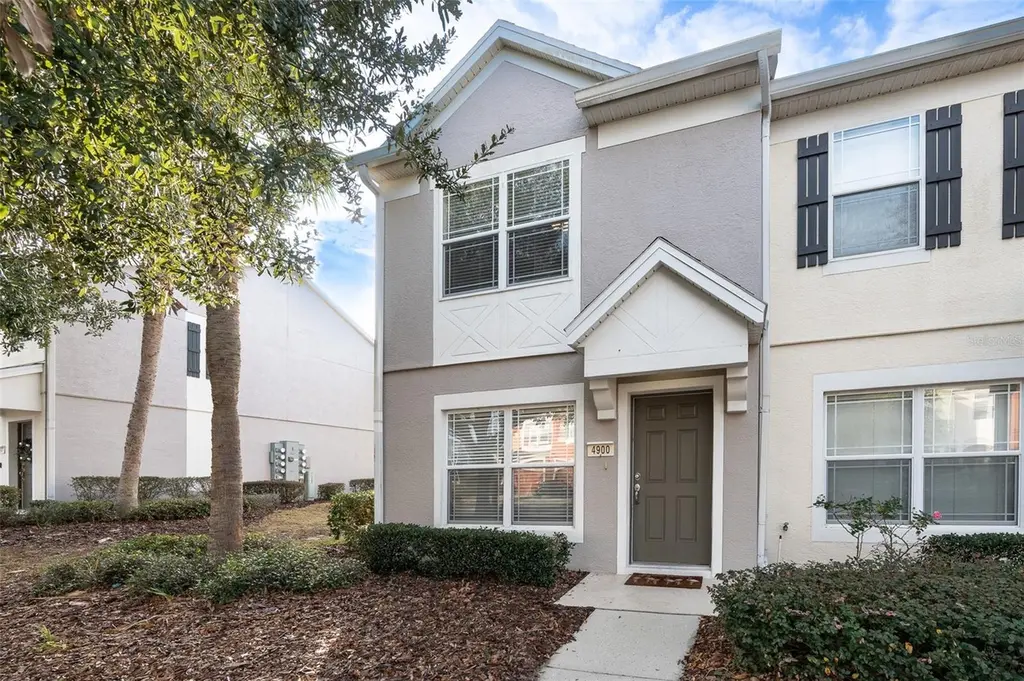
Awesome townhome for sale just off SR200 by Dillards. This home is located in gated section of Fore Ranch and offers pool, fitness center, basketball, tennis, streetlights, sidewalks and so much more. Great kitchen with stainless appliances, granite counters, 36-inch maple cabinets, 18'' tile. Two spacious bedrooms and Two bathrooms upstairs. One guest half bathroom downstairs. Private screened lanai is perfect for catching some fresh air while sipping a glass of wine. Take advantage of this great value before you are too late!
Key facts
- Gated neighborhood
- Fitness center
- Community pool
Tags
Property features AI
Finance
- Other: Total annual fees approximately $4,131.84
- Financial info: Lease restrictions apply
- HOA & community: Monthly HOA dues (combined) approximately $344.32 (primary $315.16 plus additional $29.16); HOA fees required; HOA covers common area taxes, pool, structure maintenance, grounds maintenance, recreational facilities; Community clubhouse, pool, sidewalks, community mailbox, tennis courts; Pets allowed with number limit
Exterior
- Utilities: Public water; Public sewer; Cable available; Electricity connected; Water connected; Sewer connected; Irrigation equipment
- Home design: Townhouse; Residential property; Two levels; Faces north; PUD zoning
- Construction: Block and stucco construction; Shingle roof; Slab foundation; Built with approximately 1,267 total building area
- Exterior features: Exterior lighting; Sliding doors; Tennis court(s)
Interior
- Kitchen: Dishwasher; Range; Microwave; Refrigerator; Electric water heater
- Bedrooms: 2 bedrooms
- Flooring: Laminate; Tile
- Bathrooms: 2 full bathrooms; 1 half bathroom
- Heating & cooling: Central heating; Central air conditioning
- Interior features: Open floorplan; Living room/dining room combo; Split bedroom layout; Window treatments (blinds)
- Laundry & utility: Washer; Dryer; Laundry closet
Neighborhood map
What this means for you Summary
Snapshot
- This is a 2-bed/2.5-bath condo listed at $160k.
Deal economics
- At list price, monthly cash flow is $-239 ($-3k/yr) — negative.
- To cash-flow at today's rent, offer at most $118k (26.4% below list).
- To meet the 1% rule (rent ≥ 1% of price), the offer needs to be $159k (0.8% below list).
- Recommended offer: $118k (26.4% below list) — sets the bar for cash-flow.
Location & tenants
- Location reads 69/100 on livability (#476 in FL) — a middle-class / working-renter tenant base. Strengths: cost of living A+, housing A+, health & safety A+; Watch: crime F, amenities F, commute F.
- Marion (rural): math 42% / reading 43% proficiency, ranked #61 of 73 in FL (top 84%) — families likely to look elsewhere, expect single-tenant / working-renter base with shorter leases; 61% free/reduced lunch — lower-income household profile, screen leases tightly.
- Zoned schools: Saddlewood Elementary School (math 62% / reading 54%, grade C+, #751 of 2,144 statewide, top 36%, 917 students, 58% FRL); Liberty Middle School (math 40% / reading 41%, grade F, #360 of 571 statewide, top 64%, 1,365 students, 54% FRL); West Port High School (math 34% / reading 52%, grade F, #255 of 667 statewide, top 39%, 2,906 students, 52% FRL).
- Market conditions: Rents flat; 299 active listings in the ZIP; 11 comparable units currently listed for rent nearby; rentals at typical pace (median 17d on market — plan ~3-4 weeks tenant-placement turnaround); 7,071 units permitted in Marion County in 2024 (534 in 5+ unit buildings).
Forward outlook
- Local home prices are declining (-3.0%/yr); year-one equity from $1k of loan paydown is wiped out by about $5k of value loss. Plan a longer hold.
- Marion County population projected at +13% by 2050 — modest demand growth; plan on rents tracking national, not racing it.
Negotiation context
- It's been on market 37 days — a 3% lower offer ($155k) is reasonable based on typical stale-listing flexibility.
- 7 sale attempts since 19y ago with the ask held roughly flat each time — persistent listings suggest the price (not the market) is what's stuck; bring a comps-based counter.
- Current owner paid $115k; 39% above their basis — modest negotiation headroom, anchor on the comps not their cost.
Risks & watch-outs
- Watch-outs: HOA is 22% of rent.
- Climate carrying-cost: severe wind risk, 99% chance of damaging wind over 30y; extreme-heat days projected 7→24/yr by 2055 (HVAC capex compounding) — expect insurance premiums to compound above CPI over the hold.
Questions for the listing agent
- What do current leases actually rent for vs. the listed asking? Can we see a recent rent roll and the last 12 months of T-12 income?
- It's been on market 37 days. Have you received any prior offers? Is the seller open to a 26% concession, seller financing, or rate buy-down credit?
- What does the HOA fee cover, when was the last increase, and are there any pending special assessments or reserve-fund shortfalls?
- Any open or pending special assessments — roof, HVAC, plumbing, elevator, façade? What's the per-unit balance and payoff schedule, and is the seller paying it off at close or rolling it to the buyer?
- Is there a deadline driving the sale (1031 exchange, divorce, estate, relocation)? That informs how much negotiation room exists.
- Crime grade is F in this area — have there been break-ins, vandalism, or insurance claims at this property in the last 3 years? What carrier currently insures it and at what premium?
- The area grade is low — what's the realistic commute time and amenity access for the typical tenant pool here? Any planned neighborhood developments (good or bad) we should know about?
- What's the average days-on-market for RENTAL listings here right now (not sales)? A rising rental-DOM trend means longer vacancies and softer asking-rent achievability than the comps imply.
- What's the recent tenant-quality profile in this submarket — average credit score on applications, eviction rate, late-payment / NSF rate, and stable-employment percentage? A property-management company in the area should have these aggregated.
- How much new apartment / multifamily construction is in the pipeline within 1–3 miles? Heavy new supply (>2% of stock underway) typically softens rents 12–24 months out; light construction supports rent growth.
Investment metrics
- 1% rule
- 0.99% ✗
- Cap rate
- 4.50%
- Cash-on-cash
- -6.41%
- DSCR
- 0.71
- GRM
- 8.4
CMA / ARV
- ARV (median comp)
- $197,014
- List price
- $160,000
- Delta
- -18.79%
- Verdict
- UNDERPRICED
- Comps
- 11 within 1.0 mi
Projected returns pro-forma
-3.0% appreciation · 0.12% rent growth · sell at horizon
- IRR
- -31.9%
- Equity multiple
- -0.01×
- Total profit
- $-45,371
- Equity at exit
- $23,857
- IRR
- -67.4%
- Equity multiple
- -0.68×
- Total profit
- $-75,376
- Equity at exit
- $13,834
Cash invested: $44,800 (down + closing). Projections, not guarantees.
Landlord ↔ Tenant lean methodology
- Overall (STATE)
- 87 Strongly Landlord-Friendly
- State Florida
- 87 Strongly Landlord-Friendly · R+3
- County
- — inherits STATE
- City
- — inherits STATE
ZIP-level market 34474
- Home prices YoY
- -28.4%
- Rents YoY
- 0.1%
- Active inventory
- 299
- Price-to-rent
- 8.4×
Monthly cashflow live
- Estimated rent
- $1,587 high interval (Pro) →
- Mortgage (P&I)
- −$839
- Tax from tax record
- −$243 /mo · $2,914/yr
- Insurance
- −$67
- HOA
- −$344
- Lot rent
- −$0
- Vacancy / Maint / Mgmt
- −$333
- Net cashflow
- $-239
Break-even live
Sensitivity live
| Price | -10% $-149 | -5% $-194 | +0% $-239 | +5% $-285 | +10% $-330 |
|---|---|---|---|---|---|
| Rent | -10% $-365 | -5% $-302 | +0% $-239 | +5% $-177 | +10% $-114 |
| Rate | -1.0pp $-159 | -0.5pp $-199 | base $-239 | +0.5pp $-281 | +1.0pp $-323 |
UW: 25.0% down · 7.5% · 30yr · 1.5% tax · 5.0% vac · 8.0% maint · 8.0% mgmt
Financing live
Cash to close
- Down payment
- $40,000
- Closing costs
- $4,800
- Reserves months
- —
- Total cash needed
- —
Loan-product check · same deal, 3 products live
Conventional
25% down · 7.5% · 30yr
- Down + closing
- —
- Monthly P&I
- —
- Monthly cashflow
- —
- DSCR
- —
- Eligible?
- —
Personal DTI + credit; lowest rate.
DSCR
20% down · 8.5% · 30yr
- Down + closing
- —
- Monthly P&I
- —
- Monthly cashflow
- —
- DSCR
- —
- Eligible?
- —
No personal income docs; deal must DSCR.
Hard money
10% down · 12.0% · 12mo
- Down + closing
- —
- Monthly P&I
- —
- Monthly cashflow
- —
- DSCR
- —
- Eligible?
- —
Short-term bridge; refi at stabilization.
Rent comps 11 comps
| Address | Beds | Baths | Sqft | Rent | $/sqft | DOM | Units | Dist |
|---|---|---|---|---|---|---|---|---|
| 4480 SW 49th Ave Unit 1 Ocala, FL | 2.0 | 2.5 | 1134 | $1,550 | $1.37 | 16d | 1 | 0.01mi |
| 4401 SW 52nd Cir Unit 101 Ocala, FL | 2.0 | 2.0 | 1490 | $1,600 | $1.07 | 24d | 1 | 0.21mi |
| 4820 SW 48th Ave Ocala, FL | 1.0–3.0 | 1.0–2.0 | 1149 | $1,864 | $1.62 | 16d | 34 | 0.32mi |
| 4545 SW 38th Pl Unit A Ocala, FL | 2.0 | 2.0 | 1248 | $1,200 | $0.96 | 24d | 1 | 0.66mi |
| 4565 SW 37th Ln Unit A Ocala, FL | 2.0 | 1.0 | 863 | $1,024 | $1.19 | 24d | 1 | 0.70mi |
| 4535 SW 54th Street Rd Ocala, FL | 1.0–3.0 | 1.0–2.0 | 1024 | $1,834 | $1.79 | 16d | 37 | 0.76mi |
| 3821 SW 43rd Ct Ocala, FL | 2.0 | 2.5 | 1259 | $1,565 | $1.24 | 16d | 4 | 0.84mi |
| 4900 SW 46th Ct Ocala, FL | 1.0–3.0 | 1.0–2.0 | 1178 | $1,472 | $1.25 | 16d | 32 | 0.90mi |
| 5697 SW 49th Rd Ocala, FL | 1.0–3.0 | 1.0–2.0 | 1016 | $1,619 | $1.59 | 16d | 17 | 0.91mi |
| 5101 SW 60th Street Rd Ocala, FL | 1.0–3.0 | 1.0–2.0 | 1228 | $1,713 | $1.39 | 16d | 28 | 1.14mi |
| 3640 SW 38th Ter Ocala, FL | 1.0–3.0 | 1.0–3.0 | 1209 | $1,856 | $1.54 | 24d | 23 | 1.16mi |
HOA detail condo
- Monthly dues
- $344 · $4,128/yr
- Likely covers
- poolgymsecurity
- Assessments
- None detected in remarks — confirm with the listing agent.
Listing history 24 events
-
2026-06-07statusdays on market $160,000 Pending 37 DOM
-
2026-06-03days on market $160,000 Active 35 DOM
-
2026-06-02days on market $160,000 Active 34 DOM
-
2026-06-01days on market $160,000 Active 33 DOM
-
2026-05-31days on market $160,000 Active 32 DOM
-
2026-05-30days on market $160,000 Active 31 DOM
-
2026-04-29$160,000 Active 838-char remark
-
2026-04-25historical
-
2026-03-31price $160,000
-
2025-12-27status Active
-
2025-12-20status Pending
-
2025-10-12$170,000 Active
-
2024-11-06historical $1,325
-
2024-10-22price $1,325
-
2024-09-21$1,375
-
2024-09-13historical $1,375
-
2024-08-16price $1,375
-
2024-08-08price $1,425
-
2024-07-17$1,500
-
2019-10-10soldstatus $115,000
-
2019-10-08soldstatus $115,000
Show marketing remark (533 chars)
Awesome townhome for sale just off SR200 by Dillards. This home is located in gated section of Fore Ranch and offers pool, fitness center, basketball, tennis, streetlights, sidewalks and so much more. Great kitchen with stainless appliances, granite counters, 36-inch maple cabinets, 18'' tile. Two spacious bedrooms and Two bathrooms upstairs. One guest half bathroom downstairs. Private screened lanai is perfect for catching some fresh air while sipping a glass of wine. Take advantage of this great value before you are too late!
-
2019-09-03$114,900
Show marketing remark (533 chars)
Awesome townhome for sale just off SR200 by Dillards. This home is located in gated section of Fore Ranch and offers pool, fitness center, basketball, tennis, streetlights, sidewalks and so much more. Great kitchen with stainless appliances, granite counters, 36-inch maple cabinets, 18'' tile. Two spacious bedrooms and Two bathrooms upstairs. One guest half bathroom downstairs. Private screened lanai is perfect for catching some fresh air while sipping a glass of wine. Take advantage of this great value before you are too late!
-
2007-12-31historical
-
2007-10-03$130,656
ⓘ Source: listings_history table (triggers on properties + properties_extension) + one-shot
backfill from property_details.listing_events for pre-trigger history.
Tax reassessment forecast FL · Resets to sale price
- Current annual tax
- $2,914 · $243/mo
- Projected year-2 tax
- $2,914 · $243/mo
- Expected delta
- $0/yr ($0/mo · -0.0%)
ⓘ Screening estimate from a state-policy table — verify with the county assessor before closing.
Climate risk First Street
- Flood 1/10 Low FEMA zone X (unshaded) · 0% chance over 30 yrs
- Wildfire 4/10 Moderate
- Heat 9/10 Extreme 7 d/yr ≥107°F today · 24 d/yr by 30 yrs out
- Wind 9/10 Extreme 99% chance of damaging wind over 30 yrs
- Air quality 2/10 Low 2 unhealthy d/yr today · 2 by 30 yrs out
Nearby sold comps map
Loading sold comps map…
Walkable amenities ~0.75 mi
Loading nearby amenities…
Taxation est. · year 1
- Rental income
- $19,038
- − Mortgage interest
- −$8,962
- − Property taxes
- −$2,914
- − Insurance
- −$800
- − Repairs & maintenance
- −$1,523
- − Management
- −$1,523
- − HOA
- −$4,128
- − Depreciation
- −$4,655
- Taxable loss
- −$5,467
- Est. tax savings @ 24.0%
- +$1,312
- After-tax cash flow
- $-1,559/yr
For passive investors: Depreciation is non-cash, so a rental often shows a tax loss while cash-flowing — sheltering income. Rental losses are passive: they offset passive income freely, and up to $25,000/yr can offset ordinary (W-2) income if you actively participate and your MAGI is under $100k (phasing out to $0 by $150k); unused losses carry forward. On sale, claimed depreciation is recaptured at up to 25%, and gains may owe capital-gains tax (a 1031 exchange can defer both). Figures are a year-1 estimate at your 24.0% rate — not tax advice; consult a CPA.
Schools (NCES district)
- District
- Marion
- NCES district ID
- 1201260
- Math proficiency
- 42% ▼ -7.00%
- Reading proficiency
- 43% ▼ -4.00%
- Median HH income
- $40,015
- Composite
- 35.61/100
- National rank
- #4890
- State rank
- #61 of 73 in FL
Livability — Ocala
- Score
- 69/100
- State rank
- #476
- US rank
- #8461
Category grades
Schools grade is shown separately in the Schools card above.
Census & demographics
- Census place
- Ocala, FL
- County
- Marion County · 315,796 people
- City population
- 263,375
- Metro
- Ocala, FL
- Population (ZIP)
- 20,258
- Household income
- $65,291
- Rent vs Own
- Severe rent burden
- 1062.0
Population outlook (Marion County) Hauer SSP2
- Today (2025)
- 365,905 people
- By 2030
- 376,768 · +3.0%
- By 2040
- 396,555 · +8.4%
- By 2050
- 412,723 · +12.8%
- By 2075
- 446,090 · +21.9%
- By 2100
- 436,193 · +19.2%
Race, ethnicity, and origin ACS 2023
- Neighborhood character
- Diverse neighborhood (Simpson 0.64)
- Race & ethnicity
- White 52% Hispanic / Latino 25% Black 13% Two or more races 8% Asian 8%
- Hispanic origin (detail)
- Mexican 2% Puerto Rican 10%
- Common ancestry
- Lithuanian 2% Romanian 2% Slovak 1%
- Foreign-born
- 21% · Canada, Jamaica, Vietnam
- Languages at home
- 71% English-only · Spanish 22% Other Indo-European 4% Vietnamese 1%
Political lean MEDSL · Marion
- 2024 margin
- Solid R (+31.6) · D 33.8% · R 65.5%
- 2008→2024 swing
- -20.0pp toward R · 2008: -11.6pp · 2024: -31.6pp
- All cycles
- 2024: R+31.6 2020: R+25.9 2016: R+26.2 2012: R+16.2 2008: R+11.6
Not yet ingested
- Civics
- —
Market trends
- HPI YoY
- ▼ -78.16%
- Current HPI
- 196.5607
- Rent YoY
- ▲ 0.12%
- Metro
- Ocala, FL
- State GDP YoY
- ▲ 3.28%
- F500 in state
- 36
Industry mix (Fortune 500 HQ in FL)
| Industry | F500 HQs | Revenue |
|---|---|---|
| Industrial Technology | 2 | $29B |
|
||
| Insurance | 2 | $17B |
|
||
| Retail | 1 | $60B |
|
||
| Technology Distribution | 1 | $58B |
|
||
| Homebuilding | 1 | $35B |
|
||
| Technology Manufacturing | 1 | $35B |
|
||
Price history
+22.5% since first listed19 events — show timeline
- 2026-06-05 Pending — Stellar MLS as Distributed by MLS Grid
- 2026-04-29 Listed $160,000 Stellar MLS as Distributed by MLS Grid
- 2026-04-25 Listing Removed — Stellar MLS as Distributed by MLS Grid
- 2026-03-31 Price Changed $160,000 Stellar MLS as Distributed by MLS Grid
- 2025-12-27 Relisted — Stellar MLS as Distributed by MLS Grid
- 2025-12-20 Pending — Stellar MLS as Distributed by MLS Grid
- 2025-10-12 Listed $170,000 Stellar MLS as Distributed by MLS Grid
- 2024-11-06 Rental Removed $1,325 STELLARMLS
- 2024-10-22 Price Changed $1,325 STELLARMLS
- 2024-09-21 Listed for Rent $1,375 STELLARMLS
- 2024-09-13 Rental Removed $1,375 STELLARMLS
- 2024-08-16 Price Changed $1,375 STELLARMLS
- 2024-08-08 Price Changed $1,425 STELLARMLS
- 2024-07-17 Listed for Rent $1,500 STELLARMLS
- 2019-10-10 Sold (Public Records) $115,000 Public Records
- 2019-10-08 Sold (MLS) $115,000 Stellar MLS as Distributed by MLS Grid
- 2019-09-03 Listed $114,900 Stellar MLS as Distributed by MLS Grid
- 2007-12-31 Listing Removed — Stellar MLS as Distributed by MLS Grid
- 2007-10-03 Listed $130,656 Stellar MLS as Distributed by MLS Grid
Property tax history
+10.6%/yrLatest (2025): $2,914 · +4.3% YoY. Source: county tax records.
Cash-flow waterfall
monthlySold comps — $/sqft
last 12 mo · ≤1 miLoading sold comps…