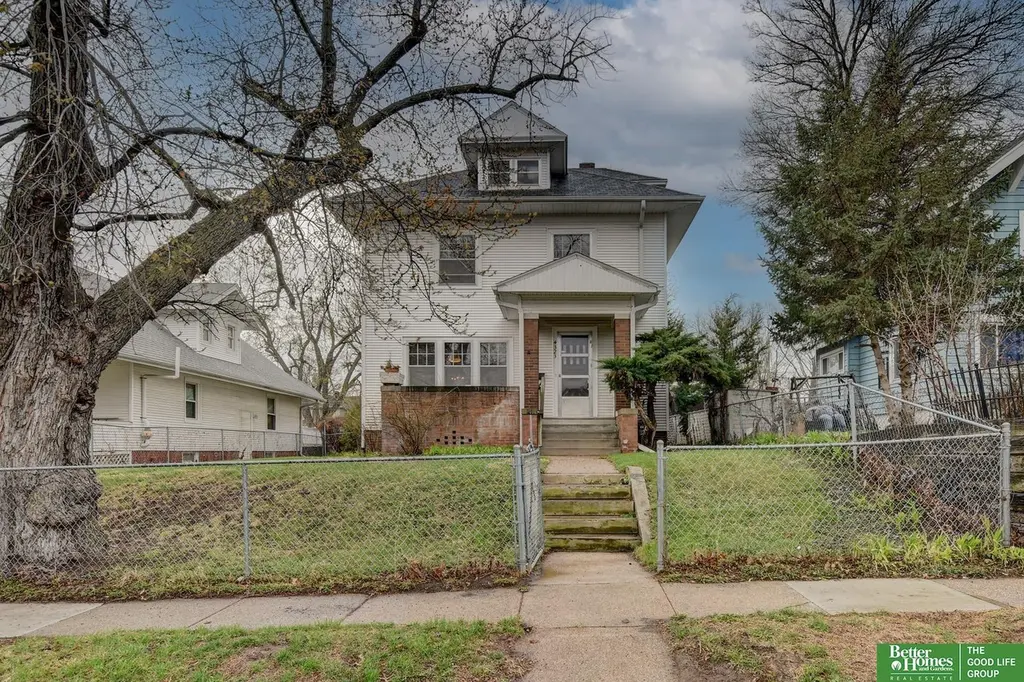
4323 Parker St · Omaha, NE
Flood risk 1/10 · Minimal
- FEMA flood zone
- X (unshaded)
- Chance of flooding over 30 yrs
- 0.0%
- Est. flood insurance / yr
- $473 – $860
Fire risk 1/10 · Minimal
- Est. fire insurance / yr
- $1,161 – $2,155
Heat risk 3/10 · Minor
- Hot days now (above 104°F)
- 7 days/yr
- Hot days in 30 yrs
- 14 days/yr
Wind risk 2/10 · Minimal
- Chance of severe wind over 30 yrs
- —
Air-quality risk 2/10 · Minimal
- Unhealthy air days now
- 0 days/yr
- Unhealthy air days in 30 yrs
- 1 days/yr
Risk factors via First Street. Map © Google.
Why this score? — see what drove the C+ grade
The composite is a weighted blend of 9 inputs, each scored 0–100. Each bar is that input's sub-score; the figure is the points it added to the 100-point composite (weight × sub-score).
- Cash flow +21.9/30.0
- Appreciation +10.0/10.0
- ARV discount +7.5/15.0
- DSCR +7.0/10.0
- 1% rule +6.0/10.0
- Livability +4.2/5.0
- Rent growth +3.3/5.0
- Condition / age +2.5/5.0
- Schools +2.1/10.0
$187,500
🖨 Deal sheet 📄 Offer letter ✓ Due diligence
Listing remarks MLS
Sold as is. All measurements approx. Decorative fireplace in living room, 2 porches, fenced yard.
Key facts
- Plate rail
- Sunroom
- Original woodwork
Tags
Property features AI
Exterior
- Parking: Detached covered garage (1 car)
- Utilities: Public water; Public sewer
- Home design: Single-family residence; 2.5-story; Built in 1914; Living area about 1,980 square feet
- Construction: Brick/mortar foundation
- Exterior features: Front porch; Partial fencing; Lot approximately 0.14 acres (about 50 x 150)
Interior
- Bedrooms: Master bedroom on 2nd floor; Additional bedrooms on 2nd floor
- Bathrooms: Two bathrooms total: one full and one half; One main level bathroom
- Heating & cooling: Natural gas forced-air heating; Central air conditioning
- Interior features: Walk-up basement access; No fireplaces
Neighborhood map
What this means for you Summary
Snapshot
- This is a 4-bed/1.5-bath other listed at $188k.
Deal economics
- At list price, monthly cash flow is $296 ($4k/yr) — positive.
- The deal already cash-flows at list — no discount required.
- Meets the 1% rule at list price ($2k rent vs $188k).
- Cap rate 8.2% vs local median 3.6% in Omaha — top-decile yield for the area; either an underpriced asset or a hidden risk that comps aren't pricing in. Stress-test before assuming the spread holds.
Location & tenants
- Location reads 84/100 on livability (#7 in NE, #663 nationally) — a professional / high-income tenant draw. Strengths: amenities A+, commute A+, cost of living A+; Watch: crime F.
- Omaha Public Schools (urban): math 20% / reading 28% proficiency, ranked #110 of 111 in NE (top 99%) — low school quality limits family demand, transient renter base, plan for 1-2y turnover; 62% free/reduced lunch — lower-income household profile, screen leases tightly.
- Zoned schools: Franklin Elementary School (math 12% / reading 22%, grade F, #471 of 502 statewide, top 95%, 275 students, 0% FRL); North High School (math 21% / reading 25%, grade F, #247 of 261 statewide, top 95%, 1,796 students, 0% FRL) — zoned schools average 0% FRL vs 62% district-wide (62 pts lower); this property's tenant base skews higher-income than the district average.
- Market conditions: Rents rising (+3.2%/yr); 139 active listings in the ZIP; 29 comparable units currently listed for rent nearby; rentals at typical pace (median 24d on market — plan ~3-4 weeks tenant-placement turnaround); 45% of comp listings sitting > 30 days — soft ceiling on asking rent; lower-income renter base — watch delinquency; 4,539 units permitted in Douglas County in 2024 (2,583 in 5+ unit buildings).
- At $2,057/mo this rent would consume 59% of the median local household income ($42k/yr) (locally 1913% of renters already pay >50% of income on rent) — very limited rent-growth headroom before tenants either downsize or default.
Forward outlook
- In year one you build about $20k of equity ($1k loan paydown + $19k appreciation (10.0% local appreciation)).
- Douglas County population projected at +28% by 2050 — long-run rental-demand tailwind backs the buy-and-hold thesis.
- At projected returns (10.0% appreciation + 3.2% rent growth), your $52k cash investment doubles in ~3 years — after that, you're playing with house money.
- By year 2, paydown + projected appreciation supports a ~$32k cash-out refi (75% LTV) — recoverable capital for the next deal without selling this one.
Negotiation context
- Only 4 days on market — expect competitive offers; lowballing is unlikely to land.
- 3 sale attempts since 20y ago with the ask held roughly flat each time — persistent listings suggest the price (not the market) is what's stuck; bring a comps-based counter.
- Current owner paid $110k; list at $188k implies a 70% gain — meaningful room to come down on a strong offer.
Risks & watch-outs
- Watch-outs: built in 1914 — expect roof / HVAC / electrical / plumbing capex.
Questions for the listing agent
- Built in 1914 — when were the roof, HVAC, electrical panel, plumbing, and water heater last replaced?
- Is there a deadline driving the sale (1031 exchange, divorce, estate, relocation)? That informs how much negotiation room exists.
- Crime grade is F in this area — have there been break-ins, vandalism, or insurance claims at this property in the last 3 years? What carrier currently insures it and at what premium?
- What's the average days-on-market for RENTAL listings here right now (not sales)? A rising rental-DOM trend means longer vacancies and softer asking-rent achievability than the comps imply.
- What's the recent tenant-quality profile in this submarket — average credit score on applications, eviction rate, late-payment / NSF rate, and stable-employment percentage? A property-management company in the area should have these aggregated.
- How much new for-sale + rental construction is in the pipeline within 1–3 miles? Heavy new supply typically softens prices + rents 12–24 months out; constrained supply supports both.
Investment metrics
- 1% rule
- 1.10% ✓
- Cap rate
- 8.18%
- Cash-on-cash
- 6.76%
- DSCR
- 1.30
- GRM
- 7.6
CMA / ARV
No comps found within radius.
Projected returns pro-forma
10.0% appreciation · 3.22% rent growth · sell at horizon
- IRR
- 29.3%
- Equity multiple
- 3.31×
- Total profit
- $121,452
- Equity at exit
- $168,915
- IRR
- 25.5%
- Equity multiple
- 7.55×
- Total profit
- $343,889
- Equity at exit
- $364,271
Cash invested: $52,500 (down + closing). Projections, not guarantees.
Landlord ↔ Tenant lean methodology
- Overall (STATE)
- 83 Strongly Landlord-Friendly
- State Nebraska
- 83 Strongly Landlord-Friendly · R+13
- County
- — inherits STATE
- City
- — inherits STATE
ZIP-level market 68111
- Home prices YoY
- 4.0%
- Rents YoY
- 3.2%
- Active inventory
- 139
- Price-to-rent
- 7.6×
Monthly cashflow live
- Estimated rent
- $2,057 high interval (Pro) →
- Mortgage (P&I)
- −$983
- Tax from tax record
- −$268 /mo · $3,220/yr
- Insurance
- −$78
- HOA
- −$0
- Vacancy / Maint / Mgmt
- −$432
- Net cashflow
- $296
Break-even live
UW: 25.0% down · 7.5% · 30yr · 1.5% tax · 5.0% vac · 8.0% maint · 8.0% mgmt
Financing live
Cash to close
- Down payment
- $46,875
- Closing costs
- $5,625
- Reserves months
- —
- Total cash needed
- —
Loan-product check · same deal, 3 products live
Conventional
25% down · 7.5% · 30yr
- Down + closing
- —
- Monthly P&I
- —
- Monthly cashflow
- —
- DSCR
- —
- Eligible?
- —
Personal DTI + credit; lowest rate.
DSCR
20% down · 8.5% · 30yr
- Down + closing
- —
- Monthly P&I
- —
- Monthly cashflow
- —
- DSCR
- —
- Eligible?
- —
No personal income docs; deal must DSCR.
Hard money
10% down · 12.0% · 12mo
- Down + closing
- —
- Monthly P&I
- —
- Monthly cashflow
- —
- DSCR
- —
- Eligible?
- —
Short-term bridge; refi at stabilization.
Rent comps 29 comps
| Address | Beds | Baths | Sqft | Rent | $/sqft | DOM | Units | Dist |
|---|---|---|---|---|---|---|---|---|
| 4542 Franklin St Unit Labs Omaha, NE | 5.0 | 2.5 | 2000 | $1,900 | $0.95 | 43d | 1 | 0.29mi |
| 4276 Binney St Omaha, NE | 4.0 | 1.0 | 1358 | $1,495 | $1.10 | 43d | 1 | 0.59mi |
| 5002 Lafayette Ave Omaha, NE | 5.0 | 2.0 | 2324 | $2,450 | $1.05 | 14d | 1 | 0.75mi |
| 3430 Seward St Omaha, NE | 3.0 | 1.0 | 1371 | $1,695 | $1.24 | 14d | 1 | 0.75mi |
| 5011 Miami St Omaha, NE | 3.0 | 3.0 | 2180 | $2,200 | $1.01 | 43d | 1 | 0.79mi |
| 3314 Franklin St Omaha, NE | 4.0 | 2.0 | 1635 | $1,600 | $0.98 | 43d | 1 | 0.83mi |
| 2914 N 49th Ave Omaha, NE | 3.0 | 1.0 | 1375 | $1,615 | $1.17 | 23d | 1 | 0.83mi |
| 620 N 46th St Omaha, NE | 3.0 | 2.5 | 2410 | $3,497 | $1.45 | 43d | 1 | 0.84mi |
| 4806 Webster St Omaha, NE | 3.0 | 2.5 | 1589 | $2,295 | $1.44 | 3d | 1 | 0.86mi |
| 4824 Webster St Unit 4824/4824 Omaha, NE | 4.0 | 1.0 | 1317 | $1,050 | $0.80 | 43d | 1 | 0.89mi |
| 5004 Webster St Omaha, NE | 4.0 | 3.0 | 2156 | $2,500 | $1.16 | 43d | 1 | 1.00mi |
| 3508 N 47th Ave Omaha, NE | 3.0 | 1.0 | 1425 | $1,600 | $1.12 | 19d | 1 | 1.01mi |
| 4182 Wakeley St Omaha, NE | 4.0 | 3.5 | 2472 | $2,775 | $1.12 | 11d | 1 | 1.02mi |
| 3535 N 45th Ave Omaha, NE | 3.0 | 1.0 | 1325 | $1,800 | $1.36 | 43d | 1 | 1.03mi |
| 4918 California St Omaha, NE | 3.0 | 1.0 | 1369 | $1,695 | $1.24 | 23d | 1 | 1.06mi |
| 140 N 41st St Omaha, NE | 3.0 | 2.5 | 1640 | $2,495 | $1.52 | 43d | 1 | 1.15mi |
| 303 N 38th St Omaha, NE | 4.0 | 1.5 | 1472 | $1,995 | $1.36 | 23d | 1 | 1.15mi |
| 120 N 40th St Omaha, NE | 3.0 | 1.0 | 1264 | $1,745 | $1.38 | 23d | 1 | 1.17mi |
| 612 N 33rd St Omaha, NE | 3.0 | 2.0 | 2370 | $1,650 | $0.70 | 14d | 1 | 1.17mi |
| 5610 Seward St Omaha, NE | 4.0 | 2.0 | 1682 | $2,200 | $1.31 | 43d | 1 | 1.19mi |
| 3808 N 48th St Omaha, NE | 3.0 | 2.0 | 1400 | $2,000 | $1.43 | 3d | 1 | 1.22mi |
| 110 N 38th St Unit 110 Omaha, NE | 3.0 | 2.0 | 1600 | $1,750 | $1.09 | 23d | 1 | 1.25mi |
| 132 N 35th Ave Omaha, NE | 5.0 | 2.0 | 1959 | $2,550 | $1.30 | 43d | 1 | 1.28mi |
| 4623 Douglas St Omaha, NE | 3.0 | 2.0 | 1510 | $1,750 | $1.16 | 21d | 1 | 1.31mi |
| 106 S 36th St Omaha, NE | 3.0 | 3.0 | 1750 | $2,275 | $1.30 | 3d | 1 | 1.35mi |
| 3919 Farnam St Unit 3915 Farnam Omaha, NE | 4.0 | 2.0 | 1700 | $2,350 | $1.38 | 43d | 1 | 1.36mi |
| 3204 N 56th St Omaha, NE | 3.0 | 2.0 | 1800 | $1,700 | $0.94 | 10d | 1 | 1.37mi |
| 2929 California St Omaha, NE | 1.0–4.0 | 1.0–3.0 | 1280 | $3,340 | $2.61 | 3d | 118 | 1.43mi |
| 411 S 38th Ave Omaha, NE | 3.0 | 3.0 | 1872 | $1,995 | $1.07 | 43d | 1 | 1.45mi |
Listing history 10 events
-
2026-04-13status Pending
-
2026-04-09$187,500 New
-
2009-11-23soldstatus $110,000
-
2008-11-29historical
-
2008-05-28$92,000
-
2006-11-20soldstatus $770,000
-
2006-11-17soldstatus $77,000 97-char remark
Show marketing remark (97 chars)
Sold as is. All measurements approx. Decorative fireplace in living room, 2 porches, fenced yard.
-
2006-11-01historical 97-char remark
Show marketing remark (97 chars)
Sold as is. All measurements approx. Decorative fireplace in living room, 2 porches, fenced yard.
-
2006-06-28$88,000 97-char remark
Show marketing remark (97 chars)
Sold as is. All measurements approx. Decorative fireplace in living room, 2 porches, fenced yard.
-
1996-05-24soldstatus $41,500
ⓘ Source: listings_history table (triggers on properties + properties_extension) + one-shot
backfill from property_details.listing_events for pre-trigger history.
Tax reassessment forecast NE · Resets to sale price
- Current annual tax
- $3,220 · $268/mo
- Projected year-2 tax
- $3,244 · $270/mo
- Expected delta
- +$24/yr (+$2/mo · 0.8%)
ⓘ Screening estimate from a state-policy table — verify with the county assessor before closing.
Climate risk First Street
- Flood 1/10 Low FEMA zone X (unshaded) · 0% chance over 30 yrs
- Wildfire 1/10 Low
- Heat 3/10 Moderate 7 d/yr ≥104°F today · 14 d/yr by 30 yrs out
- Wind 2/10 Low
- Air quality 2/10 Low 0 unhealthy d/yr today · 1 by 30 yrs out
Nearby sold comps map
Loading sold comps map…
Walkable amenities ~0.75 mi
Loading nearby amenities…
Taxation est. · year 1
- Rental income
- $24,688
- − Mortgage interest
- −$10,503
- − Property taxes
- −$3,220
- − Insurance
- −$938
- − Repairs & maintenance
- −$1,975
- − Management
- −$1,975
- − Depreciation
- −$5,455
- Taxable income
- $623
- Est. tax owed @ 24.0%
- −$150
- After-tax cash flow
- $3,398/yr
For passive investors: Depreciation is non-cash, so a rental often shows a tax loss while cash-flowing — sheltering income. Rental losses are passive: they offset passive income freely, and up to $25,000/yr can offset ordinary (W-2) income if you actively participate and your MAGI is under $100k (phasing out to $0 by $150k); unused losses carry forward. On sale, claimed depreciation is recaptured at up to 25%, and gains may owe capital-gains tax (a 1031 exchange can defer both). Figures are a year-1 estimate at your 24.0% rate — not tax advice; consult a CPA.
Schools (NCES district)
- District
- Omaha Public Schools
- NCES district ID
- 3174820
- Math proficiency
- 20% ▼ -10.00%
- Reading proficiency
- 28% ▼ -5.00%
- Median HH income
- $46,039
- Composite
- 20.83/100
- National rank
- #8502
- State rank
- #110 of 111 in NE
Livability — Omaha
- Score
- 84/100
- State rank
- #7
- US rank
- #663
Category grades
Schools grade is shown separately in the Schools card above.
Census & demographics
- Census place
- Omaha, NE
- County
- Douglas County · 538,646 people
- City population
- 552,986
- Metro
- Omaha-Council Bluffs, NE-IA
- Population (ZIP)
- 24,210
- Household income
- $42,185
- Rent vs Own
- Severe rent burden
- 1913.0
Population outlook (Douglas County) Hauer SSP2
- Today (2025)
- 625,245 people
- By 2030
- 661,613 · +5.8%
- By 2040
- 732,395 · +17.1%
- By 2050
- 801,988 · +28.3%
- By 2075
- 968,637 · +54.9%
- By 2100
- 1,101,871 · +76.2%
Race, ethnicity, and origin ACS 2023
- Neighborhood character
- Diverse neighborhood (Simpson 0.65)
- Race & ethnicity
- Black 52% Hispanic / Latino 21% White 17% Two or more races 15% Asian 3% Native American 1%
- Hispanic origin (detail)
- Mexican 14%
- Common ancestry
- Ukrainian 3% Lithuanian 0%
- Foreign-born
- 14% · Canada, Philippines
- Languages at home
- 75% English-only · Spanish 16% Other Asian/Pacific 3% French/Haitian/Cajun 1%
Political lean MEDSL · Douglas
- 2024 margin
- D (+10.2) · D 54.4% · R 44.2% · Other 1.4%
- 2008→2024 swing
- +5.5pp toward D · 2008: 4.6pp · 2024: 10.2pp
- All cycles
- 2024: D+10.2 2020: D+11.3 2016: D+1.4 2012: R+4.3 2008: D+4.6
Not yet ingested
- Civics
- —
Market trends
- HPI YoY
- ▲ 13.82%
- Current HPI
- 358.7174
- Rent YoY
- ▲ 3.22%
- Metro
- Omaha-Council Bluffs, NE-IA
- State GDP YoY
- ▲ 0.68%
- F500 in state
- 2
Industry mix (Fortune 500 HQ in NE)
| Industry | F500 HQs | Revenue |
|---|---|---|
| Conglomerate | 1 | $371B |
|
||
Price history
+351.8% since first listed10 events — show timeline
- 2026-04-13 Pending — GPRMLS
- 2026-04-09 Listed $187,500 GPRMLS
- 2009-11-23 Sold (Public Records) $110,000 Public Records
- 2008-11-29 Listing Removed — GPRMLS
- 2008-05-28 Listed $92,000 GPRMLS
- 2006-11-20 Sold (Public Records) $770,000 Public Records
- 2006-11-17 Sold (MLS) $77,000 GPRMLS
- 2006-11-01 Listing Removed — GPRMLS
- 2006-06-28 Listed $88,000 GPRMLS
- 1996-05-24 Sold (Public Records) $41,500 Public Records
Property tax history
+7.2%/yrLatest (2023): $3,220 · -1.2% YoY. Source: county tax records.
Cash-flow waterfall
monthlySold comps — $/sqft
last 12 mo · ≤1 miLoading sold comps…