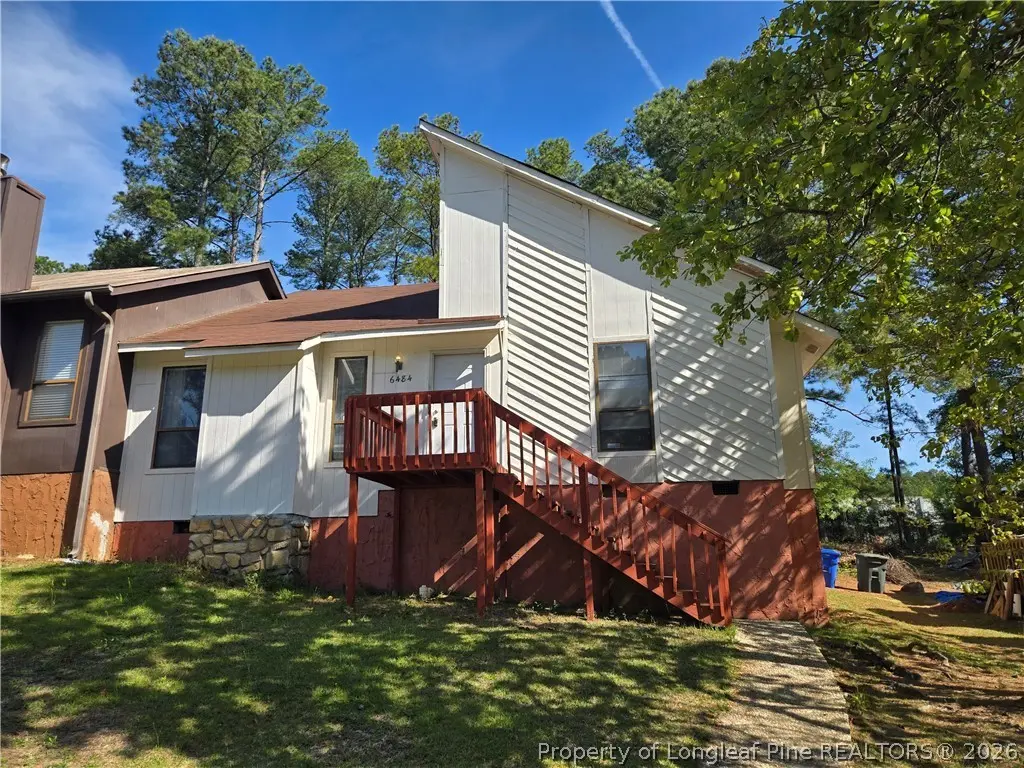
6484 Kelmscot Ct · Fayetteville, NC
Flood risk 1/10 · Minimal
- FEMA flood zone
- X (unshaded)
- Chance of flooding over 30 yrs
- 0.0%
- Est. flood insurance / yr
- $507 – $1,088
Fire risk 4/10 · Minor
- Est. fire insurance / yr
- $906 – $1,684
Heat risk 7/10 · Major
- Hot days now (above 106°F)
- 7 days/yr
- Hot days in 30 yrs
- 16 days/yr
Wind risk 6/10 · Moderate
- Chance of severe wind over 30 yrs
- 73.0%
Air-quality risk 2/10 · Minimal
- Unhealthy air days now
- 0 days/yr
- Unhealthy air days in 30 yrs
- 1 days/yr
Risk factors via First Street. Map © Google.
Why this score? — see what drove the D grade
The composite is a weighted blend of 9 inputs, each scored 0–100. Each bar is that input's sub-score; the figure is the points it added to the 100-point composite (weight × sub-score).
- Cash flow +13.7/30.0
- ARV discount +7.1/15.0
- DSCR +4.1/10.0
- Livability +3.8/5.0
- 1% rule +3.6/10.0
- Rent growth +3.3/5.0
- Schools +3.1/10.0
- Condition / age +2.5/5.0
- Appreciation +0.0/10.0
$175,000
🖨 Deal sheet (PDF) 📄 Offer letter ✓ Due diligence
Listing remarks
OWNER FINANCING AVAILABLE!!!! This unique 3 bedroom 3 bath townhome has everything you need. Close to shopping and restaurants. Hop skip and forget the jump away to Base. One bedroom and bath upstairs, perfect for the growing teen that needs space to themselves, or visiting family that dont want to be a burden. Get it before its gone.
Key facts
- Built 1985
- Listed 54 days
Property features AI
Exterior
- Utilities: Public water; Public sewer
- Home design: Townhouse; Residential property; Subdivision: FOUR SEASON
- Construction: Wood siding
- Exterior features: Back yard fencing
Interior
- Kitchen: Free-standing electric oven
- Flooring: Carpet; Laminate
- Bathrooms: 3 full bathrooms
- Heating & cooling: Heat pump heating; Central electric air conditioning
- Interior features: Eat-in kitchen; Vaulted ceilings; Factory-built wood-burning fireplace
- Laundry & utility: Washer hookup
Neighborhood map
What this means for you Summary
Snapshot
- This is a 3-bed/3.0-bath townhouse listed at $175k.
Deal economics
- At list price, monthly cash flow is $11 ($135/yr) — positive.
- The deal already cash-flows at list — no discount required.
- To meet the 1% rule (rent ≥ 1% of price), the offer needs to be $151k (13.5% below list).
- Recommended offer: $151k (13.5% below list) — sets the bar for 1% rule.
- Cap rate 6.4% vs local median 4.8% in Fayetteville — top-decile yield for the area; either an underpriced asset or a hidden risk that comps aren't pricing in. Stress-test before assuming the spread holds.
Location & tenants
- Location reads 75/100 on livability (#45 in NC, #4,031 nationally) — a middle-class / working-renter tenant base. Strengths: commute A+, cost of living A+, housing A+; Watch: crime F, employment D-.
- Cumberland County Schools (urban): math 32% / reading 41% proficiency, ranked #126 of 178 in NC (top 71%) — families likely to look elsewhere, expect single-tenant / working-renter base with shorter leases.
- Zoned schools: Benjamin J Martin Elementary (math 17% / reading 21%, grade F, #1,269 of 1,410 statewide, top 91%, 537 students, 99% FRL); Westover Middle (math 20% / reading 30%, grade F, #396 of 475 statewide, top 84%, 784 students, 100% FRL); Westover High (math 42% / reading 39%, grade F, #387 of 535 statewide, top 73%, 1,202 students, 100% FRL) — zoned schools average 100% FRL vs 55% district-wide (45 pts higher); higher-poverty schools than district average — tighter screening recommended.
- Market conditions: Rents rising (+3.0%/yr); 285 active listings in the ZIP; 40 comparable units currently listed for rent nearby; rentals at typical pace (median 26d on market — plan ~3-4 weeks tenant-placement turnaround); 1,125 units permitted in Cumberland County in 2024 (104 in 5+ unit buildings).
- This rent runs 31% of the median local income ($58k/yr) — at the standard rent-burdened threshold; future hikes will face affordability resistance.
Forward outlook
- Local home prices are declining (-3.0%/yr); year-one equity from $1k of loan paydown is wiped out by about $5k of value loss. Plan a longer hold.
Negotiation context
- It's been on market 55 days — a 3% lower offer ($170k) is reasonable based on typical stale-listing flexibility.
- 3 sale attempts since 5y ago; this cycle's ask has dropped $10k (5%) from the opening price — seller is motivated, your offer sets the floor, not the list.
- Current owner paid $32k; list at $175k implies a 456% gain — meaningful room to come down on a strong offer.
Risks & watch-outs
- Climate carrying-cost: major wind risk, 73% chance of damaging wind over 30y; extreme-heat days projected 7→16/yr by 2055 (HVAC capex compounding) — expect insurance premiums to compound above CPI over the hold.
Questions for the listing agent
- It's been on market 55 days. Have you received any prior offers? Is the seller open to a 14% concession, seller financing, or rate buy-down credit?
- Is there a deadline driving the sale (1031 exchange, divorce, estate, relocation)? That informs how much negotiation room exists.
- Crime grade is F in this area — have there been break-ins, vandalism, or insurance claims at this property in the last 3 years? What carrier currently insures it and at what premium?
- The area grade is low — what's the realistic commute time and amenity access for the typical tenant pool here? Any planned neighborhood developments (good or bad) we should know about?
- What's the average days-on-market for RENTAL listings here right now (not sales)? A rising rental-DOM trend means longer vacancies and softer asking-rent achievability than the comps imply.
- What's the recent tenant-quality profile in this submarket — average credit score on applications, eviction rate, late-payment / NSF rate, and stable-employment percentage? A property-management company in the area should have these aggregated.
- How much new for-sale + rental construction is in the pipeline within 1–3 miles? Heavy new supply typically softens prices + rents 12–24 months out; constrained supply supports both.
Investment metrics
- 1% rule
- 0.86% ✗
- Cap rate
- 6.37%
- Cash-on-cash
- 0.28%
- DSCR
- 1.01
- GRM
- 9.6
CMA / ARV
- ARV (on-the-fly)
- $173,312
- Comps found
- 7
Show comp detail 7 sales within ~0.75 mi
| Address | Dist | Beds/Ba | Sqft | Sold | Price | $/sf | Match |
|---|---|---|---|---|---|---|---|
| 6470 Pittsfield Dr Unit C | 0.12mi | 3/3.0 | 1,332 (-2%) | 2mo | $170,000 | $128 | 90 |
| 831 Danish Dr | 0.11mi | 3/3.0 | 1,354 (0%) | 14mo | $140,000 | $103 | 84 |
| 827 Danish Dr | 0.12mi | 3/3.0 | 1,353 (-0%) | 14mo | $140,000 | $103 | 83 |
| 801 Rumford Pl | 0.22mi | 3/3.0 | 1,396 (+3%) | 3mo | $176,200 | $126 | 82 |
| 830 Rumford Pl | 0.15mi | 3/3.0 | 1,407 (+4%) | 8mo | $209,000 | $149 | 80 |
| 6482 Pittsfield Dr | 0.09mi | 3/3.0 | 1,332 (-2%) | 22mo | $176,000 | $132 | 75 |
| 833 Danish Dr | 0.10mi | 3/3.5 | 1,538 (+14%) | 12mo | $217,000 | $141 | 61 |
Match score weights: distance 35% · size 25% · config 20% · recency 20%. Top-matched comps best support the ARV.
Projected returns pro-forma
-3.0% appreciation · 3.01% rent growth · sell at horizon
- IRR
- -15.9%
- Equity multiple
- 0.44×
- Total profit
- $-27,618
- Equity at exit
- $26,093
- IRR
- -7.4%
- Equity multiple
- 0.53×
- Total profit
- $-23,034
- Equity at exit
- $15,131
Cash invested: $49,000 (down + closing). Projections, not guarantees.
Landlord ↔ Tenant lean methodology
- Overall (STATE)
- 85 Strongly Landlord-Friendly
- State North Carolina
- 85 Strongly Landlord-Friendly · R+3
- County
- — inherits STATE
- City
- — inherits STATE
ZIP-level market 28303
- Home prices YoY
- -25.4%
- Rents YoY
- 3.0%
- Active inventory
- 285
- Price-to-rent
- 9.6×
Monthly cashflow live
- Estimated rent
- $1,513 high interval (Pro) →
- Mortgage (P&I)
- −$918
- Tax from tax record
- −$193 /mo · $2,320/yr
- Insurance
- −$73
- HOA
- −$0
- Vacancy / Maint / Mgmt
- −$318
- Net cashflow
- $11
Break-even live
Sensitivity live
| Price | -10% $110 | -5% $61 | +0% $11 | +5% $-38 | +10% $-88 |
|---|---|---|---|---|---|
| Rent | -10% $-108 | -5% $-48 | +0% $11 | +5% $71 | +10% $131 |
| Rate | -1.0pp $99 | -0.5pp $56 | base $11 | +0.5pp $-34 | +1.0pp $-80 |
UW: 25.0% down · 7.5% · 30yr · 1.5% tax · 5.0% vac · 8.0% maint · 8.0% mgmt
Financing live
Cash to close
- Down payment
- $43,750
- Closing costs
- $5,250
- Reserves months
- —
- Total cash needed
- —
Loan-product check · same deal, 3 products live
Conventional
25% down · 7.5% · 30yr
- Down + closing
- —
- Monthly P&I
- —
- Monthly cashflow
- —
- DSCR
- —
- Eligible?
- —
Personal DTI + credit; lowest rate.
DSCR
20% down · 8.5% · 30yr
- Down + closing
- —
- Monthly P&I
- —
- Monthly cashflow
- —
- DSCR
- —
- Eligible?
- —
No personal income docs; deal must DSCR.
Hard money
10% down · 12.0% · 12mo
- Down + closing
- —
- Monthly P&I
- —
- Monthly cashflow
- —
- DSCR
- —
- Eligible?
- —
Short-term bridge; refi at stabilization.
Rent comps 40 comps
| Address | Beds | Baths | Sqft | Rent | $/sqft | DOM | Units | Dist |
|---|---|---|---|---|---|---|---|---|
| 6466 Kelmscot Ct Fayetteville, NC | 3.0 | 3.0 | 1409 | $1,635 | $1.16 | 25d | 1 | 0.05mi |
| 824 Danish Dr Fayetteville, NC | 3.0 | 2.5 | 1310 | $1,400 | $1.07 | 25d | 1 | 0.13mi |
| 872 Danish Dr Fayetteville, NC | 3.0 | 2.0 | 1285 | $1,600 | $1.25 | 25d | 1 | 0.13mi |
| 894 Danish Dr Fayetteville, NC | 3.0 | 2.0 | 1475 | $1,695 | $1.15 | 25d | 1 | 0.19mi |
| 894 Danish Dr Unit 1 Fayetteville, NC | 3.0 | 2.5 | 1475 | $1,695 | $1.15 | 25d | 1 | 0.19mi |
| 1429 Bozeman Loop Fayetteville, NC | 1.0–3.0 | 1.0–2.0 | 1001 | $1,500 | $1.50 | 15d | 24 | 0.24mi |
| 7115 Enfield Dr Fayetteville, NC | 3.0 | 2.0 | 1700 | $1,500 | $0.88 | 23d | 1 | 0.28mi |
| 716 Windy Hill Cir Unit 716-A Fayetteville, NC | 2.0 | 1.5 | 1100 | $1,025 | $0.93 | 25d | 1 | 0.36mi |
| 6471 Yadkin Rd Fayetteville, NC | 2.0 | 1.5 | 900 | $750 | $0.83 | 25d | 1 | 0.36mi |
| 718 Windy Hill Cir Unit 718-B Fayetteville, NC | 2.0 | 1.5 | 1100 | $1,099 | $1.00 | 15d | 1 | 0.36mi |
| 6467 Yadkin Rd Fayetteville, NC | 2.0 | 1.5 | 900 | $850 | $0.94 | 25d | 1 | 0.37mi |
| 709 Windy Hill Cir Unit 709-D Fayetteville, NC | 2.0 | 1.5 | 1100 | $1,099 | $1.00 | 25d | 1 | 0.40mi |
| 726 Windy Hill Cir Unit 726-C Fayetteville, NC | 2.0 | 1.5 | 1100 | $1,099 | $1.00 | 25d | 1 | 0.44mi |
| 3627 Dornoch Dr Apt A Fayetteville, NC | 2.0 | 2.0 | 1000 | $1,025 | $1.02 | 25d | 1 | 0.45mi |
| 3627 Dornoch Dr Apt E Fayetteville, NC | 2.0 | 2.0 | 1000 | $950 | $0.95 | 25d | 1 | 0.45mi |
| 3619 Dornoch Dr Apt A Fayetteville, NC | 2.0 | 2.0 | 1000 | $1,025 | $1.02 | 15d | 1 | 0.46mi |
| 3633 Dornoch Dr Apt E Fayetteville, NC | 2.0 | 2.0 | 1000 | $1,025 | $1.02 | 25d | 1 | 0.46mi |
| 3639 Dornoch Dr Fayetteville, NC | 2.0 | 2.0 | 1000 | $1,025 | $1.02 | 25d | 1 | 0.47mi |
| 643 Wakefield Dr Fayetteville, NC | 3.0 | 2.0 | 1794 | $1,575 | $0.88 | 15d | 1 | 0.49mi |
| 422 Jamestown Ave Fayetteville, NC | 3.0 | 2.5 | 1409 | $2,000 | $1.42 | 25d | 1 | 0.57mi |
| 422 Jamestown Ave Fayetteville, NC | 3.0 | 2.5 | 1409 | $1,650 | $1.17 | 15d | 1 | 0.57mi |
| 841 Applewood Ln Unit 1 Fayetteville, NC | 2.0 | 2.0 | 1000 | $925 | $0.93 | 25d | 1 | 0.58mi |
| 7176 Fillyaw Rd Fayetteville, NC | 2.0 | 2.0 | 900 | $925 | $1.03 | 25d | 1 | 0.61mi |
| 909 Applewood Ln Fayetteville, NC | 2.0 | 2.0 | 915 | $925 | $1.01 | 25d | 1 | 0.61mi |
| 513 Roundtree Dr Fayetteville, NC | 3.0 | 2.0 | 1337 | $1,775 | $1.33 | 25d | 1 | 0.62mi |
| 390 Summer Hill Rd Fayetteville, NC | 3.0 | 2.5 | 1535 | $1,990 | $1.30 | 25d | 1 | 0.64mi |
| 338 Summer Hill Rd Fayetteville, NC | 4.0 | 2.0 | 1474 | $1,550 | $1.05 | 25d | 1 | 0.71mi |
| 7514 Telfair Dr Fayetteville, NC | 3.0 | 1.5 | 1204 | $1,300 | $1.08 | 25d | 1 | 0.93mi |
| 290 Lemont Dr Fayetteville, NC | 3.0 | 2.0 | 1782 | $1,775 | $1.00 | 15d | 1 | 1.04mi |
| 7521 Ascot Ave Fayetteville, NC | 2.0 | 1.5 | 1600 | $1,500 | $0.94 | 25d | 1 | 1.05mi |
| 7526 Bridgeman Dr Fayetteville, NC | 3.0 | 2.0 | 1300 | $1,450 | $1.12 | 25d | 1 | 1.11mi |
| 425 Dunmore Rd Fayetteville, NC | 3.0 | 2.0 | 1724 | $1,800 | $1.04 | 25d | 1 | 1.12mi |
| 833 Fresno Dr Fayetteville, NC | 3.0 | 1.5 | 1512 | $1,300 | $0.86 | 25d | 1 | 1.16mi |
| 890 Bedrock Dr Fayetteville, NC | 4.0 | 2.5 | 1484 | $1,650 | $1.11 | 25d | 1 | 1.24mi |
| 307 Family Lodge Dr Unit 5 Fayetteville, NC | 2.0 | 2.5 | 1200 | $1,100 | $0.92 | 15d | 1 | 1.25mi |
| 741 Galloway Dr Fayetteville, NC | 4.0 | 2.0 | 1551 | $1,750 | $1.13 | 15d | 1 | 1.33mi |
| 6213 Sabine Dr Fayetteville, NC | 3.0 | 1.5 | 1092 | $1,175 | $1.08 | 25d | 1 | 1.36mi |
| 6033 Santa Fe Dr Fayetteville, NC | 3.0 | 1.5 | 1325 | $1,500 | $1.13 | 25d | 1 | 1.39mi |
| 6445 Independence Pl Dr Fayetteville, NC | 1.0–3.0 | 1.0–3.0 | 1106 | $1,779 | $1.61 | 15d | 18 | 1.46mi |
| 7639 Fletcher Ave Fayetteville, NC | 3.0 | 2.0 | 1300 | $1,400 | $1.08 | 25d | 1 | 1.46mi |
Listing history 23 events
-
2026-06-21days on market $175,000 Active 55 DOM
-
2026-06-18days on market $175,000 Active 52 DOM
-
2026-06-17days on market $175,000 Active 51 DOM
-
2026-06-16days on market $175,000 Active 50 DOM
-
2026-06-15days on market $175,000 Active 49 DOM
-
2026-06-14days on market $175,000 Active 47 DOM
-
2026-06-13days on market $175,000 Active 46 DOM
-
2026-06-10days on market $175,000 Active 44 DOM
-
2026-06-09days on market $175,000 Active 43 DOM
-
2026-06-08days on market $175,000 Active 42 DOM
-
2026-06-07days on market $175,000 Active 41 DOM
-
2026-06-03days on market $175,000 Active 37 DOM
-
2026-06-02days on market $175,000 Active 36 DOM
-
2026-06-01days on market $175,000 Active 35 DOM
-
2026-05-31days on market $175,000 Active 34 DOM
-
2026-05-30days on market $175,000 Active 33 DOM
-
2026-04-28$185,000 Active
-
2026-04-27historical $185,000
-
2025-03-10historical $1,450
-
2025-03-06$1,450
-
2021-12-22$130,000
-
2017-12-21soldstatus $31,500
-
1992-03-09soldstatus $66,000
ⓘ Source: listings_history table (triggers on properties + properties_extension) + one-shot
backfill from property_details.listing_events for pre-trigger history.
Tax reassessment forecast NC · Resets to sale price
- Current annual tax
- $2,320 · $193/mo
- Projected year-2 tax
- $2,320 · $193/mo
- Expected delta
- $0/yr ($0/mo · 0.0%)
ⓘ Screening estimate from a state-policy table — verify with the county assessor before closing.
Climate risk First Street
- Flood 1/10 Low FEMA zone X (unshaded) · 0% chance over 30 yrs
- Wildfire 4/10 Moderate
- Heat 7/10 Severe 7 d/yr ≥106°F today · 16 d/yr by 30 yrs out
- Wind 6/10 Major 73% chance of damaging wind over 30 yrs
- Air quality 2/10 Low 0 unhealthy d/yr today · 1 by 30 yrs out
Nearby sold comps map
Loading sold comps map…
Walkable amenities ~0.75 mi
Loading nearby amenities…
Taxation est. · year 1
- Rental income
- $18,155
- − Mortgage interest
- −$9,803
- − Property taxes
- −$2,320
- − Insurance
- −$875
- − Repairs & maintenance
- −$1,452
- − Management
- −$1,452
- − Depreciation
- −$5,091
- Taxable loss
- −$2,838
- Est. tax savings @ 24.0%
- +$681
- After-tax cash flow
- $816/yr
For passive investors: Depreciation is non-cash, so a rental often shows a tax loss while cash-flowing — sheltering income. Rental losses are passive: they offset passive income freely, and up to $25,000/yr can offset ordinary (W-2) income if you actively participate and your MAGI is under $100k (phasing out to $0 by $150k); unused losses carry forward. On sale, claimed depreciation is recaptured at up to 25%, and gains may owe capital-gains tax (a 1031 exchange can defer both). Figures are a year-1 estimate at your 24.0% rate — not tax advice; consult a CPA.
Schools (NCES district)
- District
- Cumberland County Schools
- NCES district ID
- 3700011
- Math proficiency
- 32% ▼ -2.00%
- Reading proficiency
- 41% ▼ -1.00%
- Median HH income
- $44,168
- Composite
- 31.0/100
- National rank
- #6096
- State rank
- #126 of 178 in NC
Livability — Fayetteville
- Score
- 75/100
- State rank
- #45
- US rank
- #4031
Category grades
Schools grade is shown separately in the Schools card above.
Census & demographics
- Census place
- Fayetteville, NC
- County
- Cumberland County · 265,314 people
- City population
- 226,118
- Metro
- Fayetteville, NC
- Population (ZIP)
- 30,965
- Household income
- $58,223
- Rent vs Own
- Severe rent burden
- 1370.0
Population outlook (Cumberland County) Hauer SSP2
- Today (2025)
- 330,855 people
- By 2030
- 333,523 · +0.8%
- By 2040
- 335,583 · +1.4%
- By 2050
- 335,325 · +1.4%
- By 2075
- 342,853 · +3.6%
- By 2100
- 340,698 · +3.0%
Race, ethnicity, and origin ACS 2023
- Neighborhood character
- Diverse neighborhood (Simpson 0.70)
- Race & ethnicity
- White 39% Black 37% Two or more races 11% Hispanic / Latino 10% Asian 4% Pacific Islander 1%
- Hispanic origin (detail)
- Mexican 2% Puerto Rican 3%
- Common ancestry
- Slovak 3% Serbian 1% Lithuanian 1%
- Foreign-born
- 9% · Canada, South Korea, Vietnam
- Languages at home
- 86% English-only · Spanish 7% Other Asian/Pacific 2% Korean 1%
Political lean MEDSL · Cumberland
- 2024 margin
- D (+13.4) · D 56.1% · R 42.7% · Other 1.2%
- 2008→2024 swing
- -4.3pp toward R · 2008: 17.7pp · 2024: 13.4pp
- All cycles
- 2024: D+13.4 2020: D+16.6 2016: D+16.0 2012: D+19.7 2008: D+17.7
Not yet ingested
- Civics
- —
Market trends
- HPI YoY
- ▼ -77.14%
- Current HPI
- 226.5097
- Rent YoY
- ▲ 3.01%
- Metro
- Fayetteville, NC
- State GDP YoY
- ▲ 3.28%
- F500 in state
- 26
Industry mix (Fortune 500 HQ in NC)
| Industry | F500 HQs | Revenue |
|---|---|---|
| Financial Services | 2 | $213B |
|
||
| Retail | 2 | $95B |
|
||
| Industrial Conglomerate | 1 | $38B |
|
||
| Metals / Steel | 1 | $35B |
|
||
| Utilities | 1 | $30B |
|
||
| Industrial Machinery | 1 | $19B |
|
||
Price history
+180.3% since first listed7 events — show timeline
- 2026-04-28 Listed $185,000 LPRMLS
- 2026-04-27 Coming Soon $185,000 LPRMLS
- 2025-03-10 Rental Removed $1,450 RENTALBEAST
- 2025-03-06 Listed for Rent $1,450 RENTALBEAST
- 2021-12-22 Listed $130,000 LPRMLS
- 2017-12-21 Sold (Public Records) $31,500 Public Records
- 1992-03-09 Sold (Public Records) $66,000 Public Records
Property tax history
+7.1%/yrLatest (2025): $2,320 · +85.6% YoY. Source: county tax records.
Cash-flow waterfall
monthlySold comps — $/sqft
last 12 mo · ≤1 miLoading sold comps…