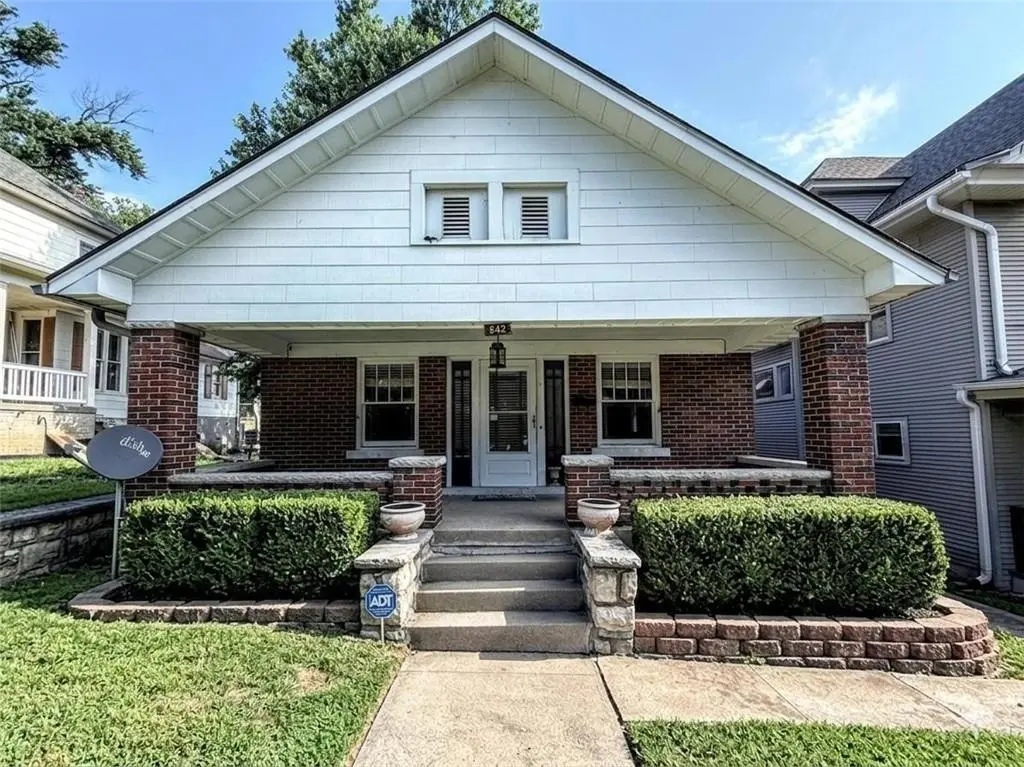
842 Barnett Ave · Kansas City, KS
Flood risk 1/10 · Minimal
- FEMA flood zone
- X (unshaded)
- Chance of flooding over 30 yrs
- 0.0%
- Est. flood insurance / yr
- $473 – $860
Fire risk 1/10 · Minimal
- Est. fire insurance / yr
- $1,154 – $2,142
Heat risk 4/10 · Minor
- Hot days now (above 107°F)
- 7 days/yr
- Hot days in 30 yrs
- 17 days/yr
Wind risk 2/10 · Minimal
- Chance of severe wind over 30 yrs
- —
Air-quality risk 3/10 · Minor
- Unhealthy air days now
- 2 days/yr
- Unhealthy air days in 30 yrs
- 3 days/yr
Risk factors via First Street. Map © Google.
Why this score? — see what drove the D- grade
The composite is a weighted blend of 9 inputs, each scored 0–100. Each bar is that input's sub-score; the figure is the points it added to the 100-point composite (weight × sub-score).
- Appreciation +10.0/10.0
- ARV discount +7.5/15.0
- Cash flow +6.6/30.0
- Livability +3.6/5.0
- Rent growth +2.5/5.0
- Condition / age +2.5/5.0
- 1% rule +1.2/10.0
- Schools +0.9/10.0
- DSCR +0.8/10.0
$199,950
🖨 Deal sheet 📄 Offer letter ✓ Due diligence
Listing remarks MLS
MOVE IN READY!!!! Hardwood floors very clean house for your first time buyer
Key facts
- Established area
- Major roadways
- Parks
Tags
Property features AI
Finance
- Other: Above- and below-grade finished areas reported (per public records); Total living area reported
- Financial info: Annual tax amount reported
Exterior
- Parking: Detached 1-car garage
- Utilities: Public water; Public sewer
- Home design: Single-family residence; Bungalow floor plan; Residential property
- Construction: Brick/mortar construction; Composition roof; Approximately 101+ years old
- Exterior features: Not in a flood plain; Lot approximately 4,792 square feet
Interior
- Bedrooms: 3 bedrooms
- Bathrooms: 2 full bathrooms
- Heating & cooling: Forced air heating (natural gas); Electric cooling
- Interior features: Full basement; Fireplace (1)
Neighborhood map
What this means for you Summary
Snapshot
- This is a 2-bed/1.0-bath single-family listed at $200k.
Deal economics
- At list price, monthly cash flow is $-331 ($-4k/yr) — negative.
- To cash-flow at today's rent, offer at most $141k (29.3% below list).
- To meet the 1% rule (rent ≥ 1% of price), the offer needs to be $124k (37.9% below list).
- Recommended offer: $124k (37.9% below list) — sets the bar for 1% rule.
Location & tenants
- Location reads 72/100 on livability (#103 in KS) — a middle-class / working-renter tenant base. Strengths: commute A+, cost of living A+, housing A+; Watch: schools F, crime F, employment D-.
- Kansas City (urban): math 8% / reading 15% proficiency, ranked #169 of 169 in KS (top 100%) — low school quality limits family demand, transient renter base, plan for 1-2y turnover; 81% free/reduced lunch — lower-income household profile, screen leases tightly.
- Market conditions: 42 active listings in the ZIP; lower-income renter base — watch delinquency; 369 units permitted in Wyandotte County in 2024 (236 in 5+ unit buildings).
- This rent runs 35% of the median local income ($43k/yr) — at the standard rent-burdened threshold; future hikes will face affordability resistance.
Forward outlook
- In year one you build about $21k of equity ($1k loan paydown + $20k appreciation (10.0% local appreciation)).
- Wyandotte County population projected at +17% by 2050 — long-run rental-demand tailwind backs the buy-and-hold thesis.
- By year 2, paydown + projected appreciation supports a ~$34k cash-out refi (75% LTV) — recoverable capital for the next deal without selling this one.
Negotiation context
- Only 14 days on market — expect competitive offers; lowballing is unlikely to land.
- 5 sale attempts since 13y ago; this cycle's ask has dropped $20k (9%) from the opening price — seller is motivated, your offer sets the floor, not the list.
- Current owner paid $30k; list at $200k implies a 566% gain — meaningful room to come down on a strong offer.
Risks & watch-outs
- Watch-outs: built in 1920 — expect roof / HVAC / electrical / plumbing capex.
Questions for the listing agent
- What do current leases actually rent for vs. the listed asking? Can we see a recent rent roll and the last 12 months of T-12 income?
- Built in 1920 — when were the roof, HVAC, electrical panel, plumbing, and water heater last replaced?
- Is there a deadline driving the sale (1031 exchange, divorce, estate, relocation)? That informs how much negotiation room exists.
- Schools are F-rated, which usually means shorter tenancies and higher turnover. Who's the typical renter profile here, and what's been the actual vacancy rate?
- Crime grade is F in this area — have there been break-ins, vandalism, or insurance claims at this property in the last 3 years? What carrier currently insures it and at what premium?
- The area grade is low — what's the realistic commute time and amenity access for the typical tenant pool here? Any planned neighborhood developments (good or bad) we should know about?
- What's the average days-on-market for RENTAL listings here right now (not sales)? A rising rental-DOM trend means longer vacancies and softer asking-rent achievability than the comps imply.
- What's the recent tenant-quality profile in this submarket — average credit score on applications, eviction rate, late-payment / NSF rate, and stable-employment percentage? A property-management company in the area should have these aggregated.
- How much new for-sale + rental construction is in the pipeline within 1–3 miles? Heavy new supply typically softens prices + rents 12–24 months out; constrained supply supports both.
Investment metrics
- 1% rule
- 0.62% ✗
- Cap rate
- 4.31%
- Cash-on-cash
- -7.10%
- DSCR
- 0.68
- GRM
- 13.4
CMA / ARV
No comps found within radius.
Projected returns pro-forma
10.0% appreciation · 3.0% rent growth · sell at horizon
- IRR
- 19.3%
- Equity multiple
- 2.57×
- Total profit
- $87,779
- Equity at exit
- $180,131
- IRR
- 17.8%
- Equity multiple
- 5.91×
- Total profit
- $275,035
- Equity at exit
- $388,459
Cash invested: $55,986 (down + closing). Projections, not guarantees.
Landlord ↔ Tenant lean methodology
- Overall (STATE)
- 83 Strongly Landlord-Friendly
- State Kansas
- 83 Strongly Landlord-Friendly · R+10
- County
- — inherits STATE
- City
- — inherits STATE
ZIP-level market 66101
- Home prices YoY
- 20.4%
- Active inventory
- 42
- Price-to-rent
- 13.4×
Monthly cashflow live
- Estimated rent
- $1,241 medium interval (Pro) →
- Mortgage (P&I)
- −$1,049
- Tax from tax record
- −$180 /mo · $2,155/yr
- Insurance
- −$83
- HOA
- −$0
- Vacancy / Maint / Mgmt
- −$261
- Net cashflow
- $-331
Break-even live
UW: 25.0% down · 7.5% · 30yr · 1.5% tax · 5.0% vac · 8.0% maint · 8.0% mgmt
Financing live
Cash to close
- Down payment
- $49,988
- Closing costs
- $5,998
- Reserves months
- —
- Total cash needed
- —
Loan-product check · same deal, 3 products live
Conventional
25% down · 7.5% · 30yr
- Down + closing
- —
- Monthly P&I
- —
- Monthly cashflow
- —
- DSCR
- —
- Eligible?
- —
Personal DTI + credit; lowest rate.
DSCR
20% down · 8.5% · 30yr
- Down + closing
- —
- Monthly P&I
- —
- Monthly cashflow
- —
- DSCR
- —
- Eligible?
- —
No personal income docs; deal must DSCR.
Hard money
10% down · 12.0% · 12mo
- Down + closing
- —
- Monthly P&I
- —
- Monthly cashflow
- —
- DSCR
- —
- Eligible?
- —
Short-term bridge; refi at stabilization.
Listing history 27 events
-
2026-06-18days on market $199,950 Active 14 DOM
-
2026-06-17days on market $199,950 Active 13 DOM
-
2026-06-16days on market $199,950 Active 12 DOM
-
2026-06-15days on market $199,950 Active 11 DOM
-
2026-06-13days on market $199,950 Active 9 DOM
-
2026-06-13days on market $199,950 Active 8 DOM
-
2026-06-09days on market $199,950 Active 5 DOM
-
2026-06-08days on market $199,950 Active 4 DOM
-
2026-06-07days on market $199,950 Active 3 DOM
-
2026-06-05remarks 681-char remark
-
2026-06-05pricedays on market $199,950 Active 1 DOM
-
2026-04-12price $205,000
-
2026-03-25price $215,000
-
2026-03-17status Active
-
2026-03-05status Pending
-
2026-02-05$220,000 Active
-
2026-02-03historical $220,000
-
2025-09-08soldstatus Closed
-
2025-08-15soldstatus
-
2025-07-03status Pending
-
2025-07-03$181,500 Active
-
2014-02-07soldstatus 76-char remark
Show marketing remark (76 chars)
MOVE IN READY!!!! Hardwood floors very clean house for your first time buyer
-
2013-11-06$69,900 76-char remark
Show marketing remark (76 chars)
MOVE IN READY!!!! Hardwood floors very clean house for your first time buyer
-
2013-11-01historical
-
2013-08-16$69,900
-
2013-06-07soldstatus
-
1988-10-01soldstatus $30,000
ⓘ Source: listings_history table (triggers on properties + properties_extension) + one-shot
backfill from property_details.listing_events for pre-trigger history.
Tax reassessment forecast KS · Resets to sale price
- Current annual tax
- $2,155 · $180/mo
- Projected year-2 tax
- $2,819 · $235/mo
- Expected delta
- +$664/yr (+$55/mo · 30.8%)
ⓘ Screening estimate from a state-policy table — verify with the county assessor before closing.
Climate risk First Street
- Flood 1/10 Low FEMA zone X (unshaded) · 0% chance over 30 yrs
- Wildfire 1/10 Low
- Heat 4/10 Moderate 7 d/yr ≥107°F today · 17 d/yr by 30 yrs out
- Wind 2/10 Low
- Air quality 3/10 Moderate 2 unhealthy d/yr today · 3 by 30 yrs out
Nearby sold comps map
Loading sold comps map…
Walkable amenities ~0.75 mi
Loading nearby amenities…
Taxation est. · year 1
- Rental income
- $14,890
- − Mortgage interest
- −$11,200
- − Property taxes
- −$2,155
- − Insurance
- −$1,000
- − Repairs & maintenance
- −$1,191
- − Management
- −$1,191
- − Depreciation
- −$5,817
- Taxable loss
- −$7,664
- Est. tax savings @ 24.0%
- +$1,839
- After-tax cash flow
- $-2,135/yr
For passive investors: Depreciation is non-cash, so a rental often shows a tax loss while cash-flowing — sheltering income. Rental losses are passive: they offset passive income freely, and up to $25,000/yr can offset ordinary (W-2) income if you actively participate and your MAGI is under $100k (phasing out to $0 by $150k); unused losses carry forward. On sale, claimed depreciation is recaptured at up to 25%, and gains may owe capital-gains tax (a 1031 exchange can defer both). Figures are a year-1 estimate at your 24.0% rate — not tax advice; consult a CPA.
Schools (NCES district)
- District
- Kansas City
- NCES district ID
- 2007950
- Math proficiency
- 8% ▼ -10.00%
- Reading proficiency
- 15% ▼ -4.00%
- Median HH income
- $34,774
- Composite
- 9.38/100
- National rank
- #9856
- State rank
- #169 of 169 in KS
Livability — Kansas City
- Score
- 72/100
- State rank
- #103
- US rank
- #6054
Category grades
Schools grade is shown separately in the Schools card above.
Census & demographics
- Census place
- Kansas City, KS
- County
- Wyandotte County · 130,206 people
- City population
- 130,206
- Metro
- Kansas City, MO-KS
- Population (ZIP)
- 12,556
- Household income
- $42,551
- Rent vs Own
- Severe rent burden
- 457.0
Population outlook (Wyandotte County) Hauer SSP2
- Today (2025)
- 177,063 people
- By 2030
- 183,212 · +3.5%
- By 2040
- 195,697 · +10.5%
- By 2050
- 207,897 · +17.4%
- By 2075
- 236,169 · +33.4%
- By 2100
- 255,790 · +44.5%
Race, ethnicity, and origin ACS 2023
- Neighborhood character
- Diverse neighborhood (Simpson 0.66)
- Race & ethnicity
- Hispanic / Latino 47% Black 30% White 16% Two or more races 10% Asian 4% Native American 2%
- Hispanic origin (detail)
- Mexican 40%
- Common ancestry
- Romanian 1% Lithuanian 1% Slovak 1%
- Foreign-born
- 29% · Canada, India
- Languages at home
- 53% English-only · Spanish 39% Other Asian/Pacific 2%
Political lean MEDSL · Wyandotte
- 2024 margin
- Strong D (+23.9) · D 61.1% · R 37.3% · Other 1.6%
- 2008→2024 swing
- -17.0pp toward R · 2008: 40.9pp · 2024: 23.9pp
- All cycles
- 2024: D+23.9 2020: D+30.9 2016: D+29.1 2012: D+36.4 2008: D+40.9
Not yet ingested
- Civics
- —
Market trends
- HPI YoY
- ▲ 77.98%
- Current HPI
- 460.4303
- Rent YoY
- —
- Metro
- Kansas City, MO-KS
- State GDP YoY
- —
- F500 in state
- 0
Price history
+583.3% since first listed16 events — show timeline
- 2026-04-12 Price Changed $205,000 Heartland MLS as Distributed by MLS Grid
- 2026-03-25 Price Changed $215,000 Heartland MLS as Distributed by MLS Grid
- 2026-03-17 Relisted — Heartland MLS as Distributed by MLS Grid
- 2026-03-05 Pending — Heartland MLS as Distributed by MLS Grid
- 2026-02-05 Listed $220,000 Heartland MLS as Distributed by MLS Grid
- 2026-02-03 Coming Soon $220,000 Heartland MLS as Distributed by MLS Grid
- 2025-09-08 Sold (MLS) — Heartland MLS as Distributed by MLS Grid
- 2025-08-15 Sold (Public Records) — Public Records
- 2025-07-03 Pending — Heartland MLS as Distributed by MLS Grid
- 2025-07-03 Listed $181,500 Heartland MLS as Distributed by MLS Grid
- 2014-02-07 Sold (MLS) — Heartland MLS as Distributed by MLS Grid
- 2013-11-06 Listed $69,900 Heartland MLS as Distributed by MLS Grid
- 2013-11-01 Listing Removed — Heartland MLS as Distributed by MLS Grid
- 2013-08-16 Listed $69,900 Heartland MLS as Distributed by MLS Grid
- 2013-06-07 Sold (Public Records) — Public Records
- 1988-10-01 Sold (Public Records) $30,000 Public Records
Property tax history
+7.4%/yrLatest (2025): $2,155 · +19.3% YoY. Source: county tax records.
Cash-flow waterfall
monthlySold comps — $/sqft
last 12 mo · ≤1 miLoading sold comps…