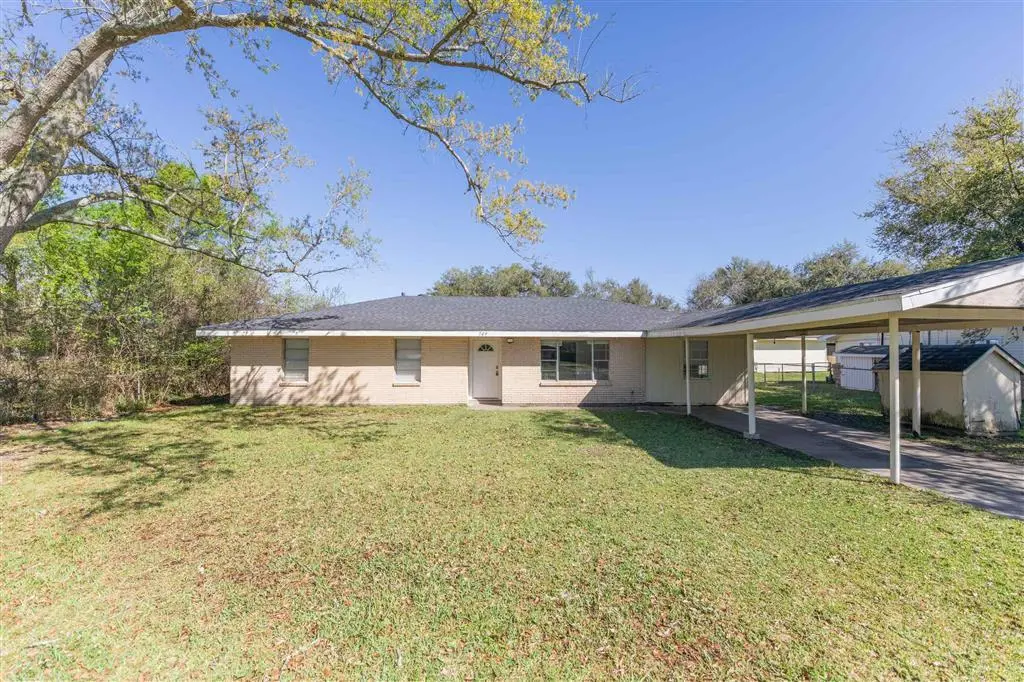
709 Sundale Dr · Lake Charles, LA
Flood risk 6/10 · Moderate
- FEMA flood zone
- AE
- Chance of flooding over 30 yrs
- 0.73%
- Est. flood insurance / yr
- $1,737 – $8,500
Fire risk 2/10 · Minimal
- Est. fire insurance / yr
- $1,269 – $2,357
Heat risk 9/10 · Severe
- Hot days now (above 109°F)
- 7 days/yr
- Hot days in 30 yrs
- 22 days/yr
Wind risk 9/10 · Severe
- Chance of severe wind over 30 yrs
- 99.0%
Air-quality risk 2/10 · Minimal
- Unhealthy air days now
- 1 days/yr
- Unhealthy air days in 30 yrs
- 1 days/yr
Risk factors via First Street. Map © Google.
Why this score? — see what drove the B+ grade
The composite is a weighted blend of 9 inputs, each scored 0–100. Each bar is that input's sub-score; the figure is the points it added to the 100-point composite (weight × sub-score).
- Cash flow +30.0/30.0
- ARV discount +15.0/15.0
- 1% rule +10.0/10.0
- DSCR +10.0/10.0
- Rent growth +4.6/5.0
- Livability +3.4/5.0
- Schools +3.1/10.0
- Condition / age +2.5/5.0
- Appreciation +0.0/10.0
$110,000
🖨 Deal sheet 📄 Offer letter ✓ Due diligence
Listing remarks MLS
Calling all investors! With the open floor plan, split bedroom layout and the generous sized yard, this home has great potential. The location is close to McNeese University, which is only 5 minutes away. This could be a great investment property.
Key facts
- Open floor plan
- Generous sized yard
- Split bedroom layout
Tags
Neighborhood map
What this means for you Summary
Snapshot
- This is a 3-bed/1.0-bath single-family listed at $110k.
Deal economics
- At list price, monthly cash flow is $705 ($8k/yr) — positive.
- The deal already cash-flows at list — no discount required.
- Meets the 1% rule at list price ($2k rent vs $110k).
- Recommended offer: $100k (9.0% below list) — sets the bar for market timing.
- Cap rate 18.6% vs local median 4.3% in Lake Charles — top-decile yield for the area; either an underpriced asset or a hidden risk that comps aren't pricing in. Stress-test before assuming the spread holds.
Location & tenants
- Location reads 68/100 on livability (#95 in LA) — a middle-class / working-renter tenant base. Strengths: commute A+, cost of living A+, housing A+; Watch: crime F, amenities F, employment D-.
- Calcasieu Parish (other): math 30% / reading 44% proficiency, ranked #29 of 98 in LA (top 30%) — families likely to look elsewhere, expect single-tenant / working-renter base with shorter leases.
- Market conditions: Rents rising fast (+8.6%/yr); 567 active listings in the ZIP; 2 comparable units currently listed for rent nearby; 1,298 units permitted in Calcasieu Parish in 2024 (526 in 5+ unit buildings).
- At $2,357/mo this rent would consume 47% of the median local household income ($60k/yr) (locally 1267% of renters already pay >50% of income on rent) — very limited rent-growth headroom before tenants either downsize or default.
Forward outlook
- Local home prices are declining (-3.0%/yr); year-one equity from $761 of loan paydown is wiped out by about $3k of value loss. Plan a longer hold.
- Calcasieu County population projected at +11% by 2050 — modest demand growth; plan on rents tracking national, not racing it.
- At projected returns (-3.0% appreciation + 8.0% rent growth), your $31k cash investment doubles in ~4 years — after that, you're playing with house money.
Negotiation context
- It's been on market 98 days — a 9% lower offer ($100k) is reasonable based on typical stale-listing flexibility.
- 2 sale attempts since 4y ago; this cycle's ask has dropped $10k (8%) from the opening price — seller is motivated, your offer sets the floor, not the list.
- Current owner paid $89k; 24% above their basis — modest negotiation headroom, anchor on the comps not their cost.
Risks & watch-outs
- Watch-outs: flood insurance adds $427/mo.
- Climate carrying-cost: in FEMA flood zone AE (mandatory federal flood insurance); severe wind risk, 99% chance of damaging wind over 30y; extreme-heat days projected 7→22/yr by 2055 (HVAC capex compounding) — expect insurance premiums to compound above CPI over the hold.
Questions for the listing agent
- It's been on market 98 days. Have you received any prior offers? Is the seller open to a 9% concession, seller financing, or rate buy-down credit?
- Built in 1970 — when were the roof, HVAC, electrical panel, plumbing, and water heater last replaced?
- What's the actual annual flood-insurance premium (NFIP or private), and is the property in a SFHA with mandatory coverage?
- Why hasn't it sold? Are there any deal-killer items the seller is aware of (foundation, flood, title, zoning, code violations)?
- Is there a deadline driving the sale (1031 exchange, divorce, estate, relocation)? That informs how much negotiation room exists.
- Schools are B-rated — typically a magnet for longer-tenancy family renters. What's the average tenant stay here, and is there a school-zone premium baked into asking?
- Crime grade is F in this area — have there been break-ins, vandalism, or insurance claims at this property in the last 3 years? What carrier currently insures it and at what premium?
- What's the average days-on-market for RENTAL listings here right now (not sales)? A rising rental-DOM trend means longer vacancies and softer asking-rent achievability than the comps imply.
- What's the recent tenant-quality profile in this submarket — average credit score on applications, eviction rate, late-payment / NSF rate, and stable-employment percentage? A property-management company in the area should have these aggregated.
- How much new for-sale + rental construction is in the pipeline within 1–3 miles? Heavy new supply typically softens prices + rents 12–24 months out; constrained supply supports both.
Investment metrics
- 1% rule
- 2.14% ✓
- Cap rate
- 18.64%
- Cash-on-cash
- 44.10%
- DSCR
- 2.96
- GRM
- 3.9
CMA / ARV
- ARV (median comp)
- $187,008
- List price
- $110,000
- Delta
- -41.18%
- Verdict
- UNDERPRICED
- Comps
- 20 within 1.0 mi
Show comp detail 12 sales within ~0.75 mi
| Address | Dist | Beds/Ba | Sqft | Sold | Price | $/sf | Match |
|---|---|---|---|---|---|---|---|
| 714 Rampart St St | 0.43mi | 3/2.0 | 1,869 (+2%) | 3mo | $172,500 | $92 | 69 |
| 857 Desoto St St | 0.50mi | 4/2.0 (+1) | 1,858 (+2%) | 1mo | $292,200 | $157 | 64 |
| 731 Rampart St | 0.50mi | 3/2.0 | 1,842 (+1%) | 13mo | $285,000 | $155 | 60 |
| 115 Greenway St | 0.52mi | 4/2.0 (+1) | 1,900 (+4%) | 2mo | $263,400 | $139 | 58 |
| 588 Jefferson Dr | 0.50mi | 3/2.0 | 1,769 (-3%) | 16mo | $186,000 | $105 | 54 |
| 209 Vanessa Ave | 0.47mi | 3/2.0 | 1,974 (+8%) | 11mo | $255,000 | $129 | 51 |
| 505 Fontenot Rd | 0.30mi | 3/2.0 | 1,560 (-14%) | 10mo | $149,000 | $96 | 50 |
| 869 Desoto St | 0.54mi | 4/2.0 (+1) | 1,858 (+2%) | 16mo | $249,900 | $134 | 49 |
| 220 Windsor St | 0.61mi | 3/2.0 | 1,905 (+4%) | 17mo | $159,000 | $83 | 46 |
| 313 Greenway | 0.73mi | 3/2.0 | 1,771 (-3%) | 13mo | $160,000 | $90 | 46 |
| 732 Iberville St | 0.75mi | 3/2.0 | 1,598 (-12%) | 3mo | $213,000 | $133 | 38 |
| 308 Dolby St | 0.67mi | 3/2.0 | 1,572 (-14%) | 16mo | $190,000 | $121 | 28 |
Match score weights: distance 35% · size 25% · config 20% · recency 20%. Top-matched comps best support the ARV.
Projected returns pro-forma
-3.0% appreciation · 8.0% rent growth · sell at horizon
- IRR
- 28.6%
- Equity multiple
- 2.29×
- Total profit
- $39,841
- Equity at exit
- $16,401
- IRR
- 39.5%
- Equity multiple
- 5.88×
- Total profit
- $150,379
- Equity at exit
- $9,511
Cash invested: $30,800 (down + closing). Projections, not guarantees.
Landlord ↔ Tenant lean methodology
- Overall (STATE)
- 90 Strongly Landlord-Friendly
- State Louisiana
- 90 Strongly Landlord-Friendly · R+12
- County
- — inherits STATE
- City
- — inherits STATE
ZIP-level market 70607
- Rents YoY
- 8.6%
- Active inventory
- 567
- Price-to-rent
- 3.9×
Monthly cashflow live
- Estimated rent
- $2,357 medium interval (Pro) →
- Mortgage (P&I)
- −$577
- Tax from tax record
- −$108 /mo · $1,291/yr
- Insurance
- −$46
- Flood insurance flood zone
- −$427 /mo · $5,118/yr
- HOA
- −$0
- Vacancy / Maint / Mgmt
- −$495
- Net cashflow
- $705
Break-even live
UW: 25.0% down · 7.5% · 30yr · 1.5% tax · 5.0% vac · 8.0% maint · 8.0% mgmt
Financing live
Cash to close
- Down payment
- $27,500
- Closing costs
- $3,300
- Reserves months
- —
- Total cash needed
- —
Loan-product check · same deal, 3 products live
Conventional
25% down · 7.5% · 30yr
- Down + closing
- —
- Monthly P&I
- —
- Monthly cashflow
- —
- DSCR
- —
- Eligible?
- —
Personal DTI + credit; lowest rate.
DSCR
20% down · 8.5% · 30yr
- Down + closing
- —
- Monthly P&I
- —
- Monthly cashflow
- —
- DSCR
- —
- Eligible?
- —
No personal income docs; deal must DSCR.
Hard money
10% down · 12.0% · 12mo
- Down + closing
- —
- Monthly P&I
- —
- Monthly cashflow
- —
- DSCR
- —
- Eligible?
- —
Short-term bridge; refi at stabilization.
Rent comps 2 comps
| Address | Beds | Baths | Sqft | Rent | $/sqft | DOM | Units | Dist |
|---|---|---|---|---|---|---|---|---|
| 155 Heather St Lake Charles, LA | 3.0 | 2.0 | 1316 | $1,650 | $1.25 | 13d | 1 | 0.90mi |
| 716 Dianne Ln Lake Charles, LA | 3.0 | 2.0 | 2200 | $5,000 | $2.27 | 43d | 1 | 1.09mi |
Listing history 22 events
-
2026-06-19days on market $110,000 Active 98 DOM
-
2026-06-18days on market $110,000 Active 97 DOM
-
2026-06-17days on market $110,000 Active 96 DOM
-
2026-06-16days on market $110,000 Active 95 DOM
-
2026-06-15days on market $110,000 Active 94 DOM
-
2026-06-14days on market $110,000 Active 92 DOM
-
2026-06-13days on market $110,000 Active 91 DOM
-
2026-06-10days on market $110,000 Active 89 DOM
-
2026-06-09days on market $110,000 Active 88 DOM
-
2026-06-08days on market $110,000 Active 87 DOM
-
2026-06-07days on market $110,000 Active 86 DOM
-
2026-06-05days on market $110,000 Active 83 DOM
-
2026-06-02days on market $110,000 Active 81 DOM
-
2026-06-01days on market $110,000 Active 80 DOM
-
2026-05-31days on market $110,000 Active 79 DOM
-
2026-05-30days on market $110,000 Active 78 DOM
-
2026-05-15price $110,000 247-char remark
Show marketing remark (247 chars)
Calling all investors! With the open floor plan, split bedroom layout and the generous sized yard, this home has great potential. The location is close to McNeese University, which is only 5 minutes away. This could be a great investment property.
-
2026-03-13$120,000 Active 247-char remark
Show marketing remark (247 chars)
Calling all investors! With the open floor plan, split bedroom layout and the generous sized yard, this home has great potential. The location is close to McNeese University, which is only 5 minutes away. This could be a great investment property.
-
2022-03-15soldstatus $89,000
-
2022-03-14soldstatus 23-char remark
Show marketing remark (23 chars)
One time show and sell.
-
2022-03-14$89,000 23-char remark
Show marketing remark (23 chars)
One time show and sell.
-
1993-05-25soldstatus $30,305
ⓘ Source: listings_history table (triggers on properties + properties_extension) + one-shot
backfill from property_details.listing_events for pre-trigger history.
Tax reassessment forecast LA · Resets to sale price
- Current annual tax
- $1,291 · $108/mo
- Projected year-2 tax
- $1,291 · $108/mo
- Expected delta
- $0/yr ($0/mo · 0.0%)
ⓘ Screening estimate from a state-policy table — verify with the county assessor before closing.
Climate risk First Street
- Flood 6/10 Major FEMA zone AE · 73% chance over 30 yrs
- Wildfire 2/10 Low
- Heat 9/10 Extreme 7 d/yr ≥109°F today · 22 d/yr by 30 yrs out
- Wind 9/10 Extreme 99% chance of damaging wind over 30 yrs
- Air quality 2/10 Low 1 unhealthy d/yr today · 1 by 30 yrs out
Nearby sold comps map
Loading sold comps map…
Walkable amenities ~0.75 mi
Loading nearby amenities…
Taxation est. · year 1
- Rental income
- $28,287
- − Mortgage interest
- −$6,162
- − Property taxes
- −$1,291
- − Insurance
- −$5,668
- − Repairs & maintenance
- −$2,263
- − Management
- −$2,263
- − Depreciation
- −$3,200
- Taxable income
- $7,440
- Est. tax owed @ 24.0%
- −$1,786
- After-tax cash flow
- $6,679/yr
For passive investors: Depreciation is non-cash, so a rental often shows a tax loss while cash-flowing — sheltering income. Rental losses are passive: they offset passive income freely, and up to $25,000/yr can offset ordinary (W-2) income if you actively participate and your MAGI is under $100k (phasing out to $0 by $150k); unused losses carry forward. On sale, claimed depreciation is recaptured at up to 25%, and gains may owe capital-gains tax (a 1031 exchange can defer both). Figures are a year-1 estimate at your 24.0% rate — not tax advice; consult a CPA.
Schools (NCES district)
- District
- Calcasieu Parish
- NCES district ID
- 2200330
- Math proficiency
- 30% ▼ -39.00%
- Reading proficiency
- 44% ▼ -33.00%
- Median HH income
- $44,700
- Composite
- 31.45/100
- National rank
- #5979
- State rank
- #29 of 98 in LA
Livability — Lake Charles
- Score
- 68/100
- State rank
- #95
- US rank
- #9820
Category grades
Schools grade is shown separately in the Schools card above.
Census & demographics
- County
- Calcasieu Parish · 170,889 people
- City population
- 133,538
- Metro
- Lake Charles, LA
- Population (ZIP)
- 27,080
- Household income
- $60,351
- Rent vs Own
- Severe rent burden
- 1267.0
Population outlook (Calcasieu County) Hauer SSP2
- Today (2025)
- 212,179 people
- By 2030
- 218,199 · +2.8%
- By 2040
- 228,486 · +7.7%
- By 2050
- 236,208 · +11.3%
- By 2075
- 251,696 · +18.6%
- By 2100
- 247,848 · +16.8%
Race, ethnicity, and origin ACS 2023
- Neighborhood character
- Diverse neighborhood (Simpson 0.65)
- Race & ethnicity
- White 46% Black 36% Two or more races 11% Hispanic / Latino 6% Asian 2%
- Hispanic origin (detail)
- Mexican 1%
- Common ancestry
- Lithuanian 10% Serbian 1%
- Foreign-born
- 5% · Canada, Vietnam
- Languages at home
- 93% English-only · Spanish 4% French/Haitian/Cajun 2% Other Indo-European 1%
Political lean MEDSL · Calcasieu
- 2024 margin
- Solid R (+39.6) · D 29.5% · R 69.0% · Other 1.5%
- 2008→2024 swing
- -15.0pp toward R · 2008: -24.6pp · 2024: -39.6pp
- All cycles
- 2024: R+39.6 2020: R+35.2 2016: R+33.3 2012: R+28.7 2008: R+24.6
Not yet ingested
- Civics
- —
Market trends
- HPI YoY
- ▼ -91.59%
- Current HPI
- 93.679
- Rent YoY
- ▲ 8.55%
- Metro
- Lake Charles, LA
- State GDP YoY
- ▲ 3.29%
- F500 in state
- 10
Industry mix (Fortune 500 HQ in LA)
| Industry | F500 HQs | Revenue |
|---|---|---|
| Telecommunications | 2 | $23B |
|
||
| Utilities | 1 | $12B |
|
||
| Wholesale / Distribution | 1 | $5B |
|
||
| Advertising | 1 | $2B |
|
||
Price history
+263.0% since first listed6 events — show timeline
- 2026-05-15 Price Changed $110,000 SWLAR
- 2026-03-13 Listed $120,000 SWLAR
- 2022-03-15 Sold (Public Records) $89,000 Public Records
- 2022-03-14 Listed $89,000 SWLAR
- 2022-03-14 Sold (MLS) — SWLAR
- 1993-05-25 Sold (Public Records) $30,305 Public Records
Property tax history
+7.1%/yrLatest (2025): $1,291 · +1.2% YoY. Source: county tax records.
Cash-flow waterfall
monthlySold comps — $/sqft
last 12 mo · ≤1 miLoading sold comps…