 Multi-family
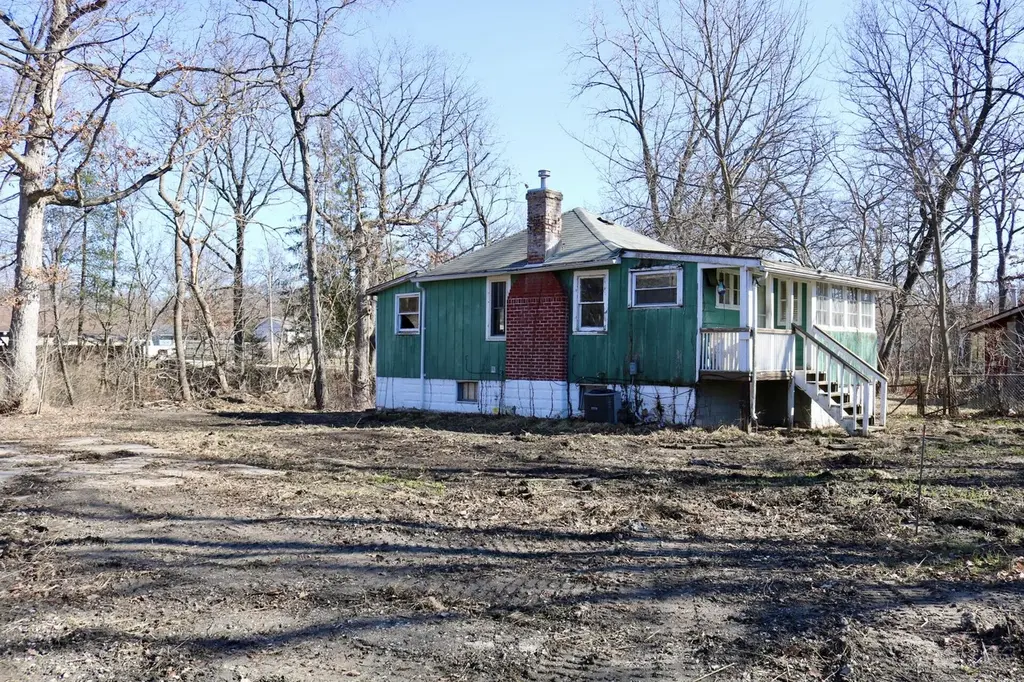
7111 W 128th Ln · Cedar Lake, IN
Flood risk 1/10 · Minimal
- FEMA flood zone
- X (unshaded)
- Chance of flooding over 30 yrs
- 0.0%
- Est. flood insurance / yr
- $473 – $860
Fire risk 1/10 · Minimal
- Est. fire insurance / yr
- $717 – $1,331
Heat risk 2/10 · Minimal
- Hot days now (above 100°F)
- 7 days/yr
- Hot days in 30 yrs
- 16 days/yr
Wind risk 2/10 · Minimal
- Chance of severe wind over 30 yrs
- 0.0%
Air-quality risk 2/10 · Minimal
- Unhealthy air days now
- 1 days/yr
- Unhealthy air days in 30 yrs
- 1 days/yr
Risk factors via First Street. Map © Google.
Why this score? — see what drove the B+ grade
The composite is a weighted blend of 9 inputs, each scored 0–100. Each bar is that input's sub-score; the figure is the points it added to the 100-point composite (weight × sub-score).
- Cash flow +30.0/30.0
- ARV discount +15.0/15.0
- 1% rule +10.0/10.0
- DSCR +10.0/10.0
- Schools +5.0/10.0
- Livability +3.2/5.0
- Rent growth +2.5/5.0
- Condition / age +2.5/5.0
- Appreciation +0.0/10.0
$89,000
🖨 Deal sheet 📄 Offer letter ✓ Due diligence
Multi-family units
County records classify this as Multi-Family (2-4 Unit). Listing-text estimate: 1 unit. estimate disagrees with records
Listing remarks MLS
Investor special! Secluded lot overlooking a wooded ravine, located within 1 mile of the Cedar Lake shoreline and in the Crown Point School District. The home has been gutted to the studs, offering a blank slate for your next project. Ideal opportunity for a fix-and-flip, rental, or Airbnb. Enjoy a private setting with scenic views while still being close to local amenities. Property is located on Bridge Ct behind 7112. Cash offers only.
Key facts
- Gutted to the studs
- Secluded lot
- Wooded ravine
Tags
Neighborhood map
What this means for you Summary
Snapshot
- This is a 2-bed/1.0-bath multifamily listed at $89k.
Deal economics
- At list price, monthly cash flow is $677 ($8k/yr) — positive.
- The deal already cash-flows at list — no discount required.
- Meets the 1% rule at list price ($2k rent vs $89k).
- Recommended offer: $81k (9.0% below list) — sets the bar for market timing.
- Cap rate 15.4% vs local median 3.5% in Cedar Lake — top-decile yield for the area; either an underpriced asset or a hidden risk that comps aren't pricing in. Stress-test before assuming the spread holds.
Location & tenants
- Location reads 65/100 on livability (#354 in IN) — a middle-class / working-renter tenant base. Strengths: crime A+, cost of living A+, housing A+; Watch: amenities F, commute F, health & safety F.
- Crown Point Community School Corporation (suburban): math 51% / reading 61% proficiency, ranked #23 of 301 in IN (top 8%) — acceptable for families but not a draw, mixed tenant base, ~2y average lease; only 18% free/reduced lunch — higher-income household profile.
- Market conditions: 265 active listings in the ZIP; 1 comparable units currently listed for rent nearby; solid renter incomes; 1,642 units permitted in Lake County in 2024 (14 in 5+ unit buildings).
Forward outlook
- Local home prices are declining (-3.0%/yr); year-one equity from $615 of loan paydown is wiped out by about $3k of value loss. Plan a longer hold.
- Lake County population projected to shrink 7% by 2050 — rents likely to lag national; underwrite the cash flow, not the appreciation.
- At projected returns (-3.0% appreciation + 3.0% rent growth), your $25k cash investment doubles in ~4 years — after that, you're playing with house money.
Negotiation context
- It's been on market 99 days — a 9% lower offer ($81k) is reasonable based on typical stale-listing flexibility.
- 2 sale attempts since 2y ago; this cycle's ask has dropped $10k (10%) from the opening price — seller is motivated, your offer sets the floor, not the list.
- Current owner paid $70k; 27% above their basis — modest negotiation headroom, anchor on the comps not their cost.
Risks & watch-outs
- Watch-outs: built in 1918 — expect roof / HVAC / electrical / plumbing capex.
Questions for the listing agent
- It's been on market 99 days. Have you received any prior offers? Is the seller open to a 9% concession, seller financing, or rate buy-down credit?
- Built in 1918 — when were the roof, HVAC, electrical panel, plumbing, and water heater last replaced?
- Why hasn't it sold? Are there any deal-killer items the seller is aware of (foundation, flood, title, zoning, code violations)?
- Is there a deadline driving the sale (1031 exchange, divorce, estate, relocation)? That informs how much negotiation room exists.
- What's the average days-on-market for RENTAL listings here right now (not sales)? A rising rental-DOM trend means longer vacancies and softer asking-rent achievability than the comps imply.
- What's the recent tenant-quality profile in this submarket — average credit score on applications, eviction rate, late-payment / NSF rate, and stable-employment percentage? A property-management company in the area should have these aggregated.
- How much new apartment / multifamily construction is in the pipeline within 1–3 miles? Heavy new supply (>2% of stock underway) typically softens rents 12–24 months out; light construction supports rent growth.
Investment metrics
- 1% rule
- 1.79% ✓
- Cap rate
- 15.43%
- Cash-on-cash
- 32.62%
- DSCR
- 2.45
- GRM
- 4.7
CMA / ARV
- ARV (median comp)
- $170,200
- List price
- $89,000
- Delta
- -47.71%
- Verdict
- UNDERPRICED
- Comps
- 20 within 1.0 mi
Projected returns pro-forma
-3.0% appreciation · 3.0% rent growth · sell at horizon
- IRR
- 27.7%
- Equity multiple
- 2.15×
- Total profit
- $28,726
- Equity at exit
- $13,270
- IRR
- 35.2%
- Equity multiple
- 4.23×
- Total profit
- $80,585
- Equity at exit
- $7,695
Cash invested: $24,920 (down + closing). Projections, not guarantees.
Landlord ↔ Tenant lean methodology
- Overall (STATE)
- 90 Strongly Landlord-Friendly
- State Indiana
- 90 Strongly Landlord-Friendly · R+11
- County
- — inherits STATE
- City
- — inherits STATE
ZIP-level market 46303
- Active inventory
- 265
- Price-to-rent
- 4.7×
Monthly cashflow live
- Estimated rent
- $1,595 medium interval (Pro) →
- Mortgage (P&I)
- −$467
- Tax from tax record
- −$79 /mo · $943/yr
- Insurance
- −$37
- HOA
- −$0
- Vacancy / Maint / Mgmt
- −$335
- Net cashflow
- $677
Break-even live
UW: 25.0% down · 7.5% · 30yr · 1.5% tax · 5.0% vac · 8.0% maint · 8.0% mgmt
Financing live
Cash to close
- Down payment
- $22,250
- Closing costs
- $2,670
- Reserves months
- —
- Total cash needed
- —
Loan-product check · same deal, 3 products live
Conventional
25% down · 7.5% · 30yr
- Down + closing
- —
- Monthly P&I
- —
- Monthly cashflow
- —
- DSCR
- —
- Eligible?
- —
Personal DTI + credit; lowest rate.
DSCR
20% down · 8.5% · 30yr
- Down + closing
- —
- Monthly P&I
- —
- Monthly cashflow
- —
- DSCR
- —
- Eligible?
- —
No personal income docs; deal must DSCR.
Hard money
10% down · 12.0% · 12mo
- Down + closing
- —
- Monthly P&I
- —
- Monthly cashflow
- —
- DSCR
- —
- Eligible?
- —
Short-term bridge; refi at stabilization.
Rent comps 1 comps
| Address | Beds | Baths | Sqft | Rent | $/sqft | DOM | Units | Dist |
|---|---|---|---|---|---|---|---|---|
| 13328 Edison St Cedar Lake, IN | 3.0 | 2.0 | 1125 | $2,095 | $1.86 | 1d | 1 | 0.73mi |
Listing history 18 events
-
2026-06-18days on market $89,000 Active 99 DOM
-
2026-06-17days on market $89,000 Active 98 DOM
-
2026-06-16days on market $89,000 Active 97 DOM
-
2026-06-15days on market $89,000 Active 96 DOM
-
2026-06-13days on market $89,000 Active 94 DOM
-
2026-06-13days on market $89,000 Active 93 DOM
-
2026-06-09days on market $89,000 Active 90 DOM
-
2026-06-08days on market $89,000 Active 89 DOM
-
2026-06-07days on market $89,000 Active 88 DOM
-
2026-06-04days on market $89,000 Active 85 DOM
-
2026-06-03days on market $89,000 Active 84 DOM
-
2026-06-02days on market $89,000 Active 83 DOM
-
2026-06-01pricedays on market $89,000 Active 82 DOM
-
2026-05-31days on market $99,000 Active 81 DOM
-
2026-03-11$99,000 Active 441-char remark
Show marketing remark (441 chars)
Investor special! Secluded lot overlooking a wooded ravine, located within 1 mile of the Cedar Lake shoreline and in the Crown Point School District. The home has been gutted to the studs, offering a blank slate for your next project. Ideal opportunity for a fix-and-flip, rental, or Airbnb. Enjoy a private setting with scenic views while still being close to local amenities. Property is located on Bridge Ct behind 7112. Cash offers only.
-
2024-02-13soldstatus $70,000 Closed 293-char remark
Show marketing remark (293 chars)
Great Area ! SECLUDED , SCENIC LOT with view of a wooded ravine. Close to the new and improved MacArthur Elementary School. THIS HOUSE is habitable but, NEEDS WORK. Be sure to TURN on BRIDGE CT. You will NOT find this address on the main road. ( it is located BEHIND 7112 ) CASH OFFERS ONLY.
-
2024-01-31status Pending 293-char remark
Show marketing remark (293 chars)
Great Area ! SECLUDED , SCENIC LOT with view of a wooded ravine. Close to the new and improved MacArthur Elementary School. THIS HOUSE is habitable but, NEEDS WORK. Be sure to TURN on BRIDGE CT. You will NOT find this address on the main road. ( it is located BEHIND 7112 ) CASH OFFERS ONLY.
-
2024-01-25$73,900 Active 293-char remark
Show marketing remark (293 chars)
Great Area ! SECLUDED , SCENIC LOT with view of a wooded ravine. Close to the new and improved MacArthur Elementary School. THIS HOUSE is habitable but, NEEDS WORK. Be sure to TURN on BRIDGE CT. You will NOT find this address on the main road. ( it is located BEHIND 7112 ) CASH OFFERS ONLY.
ⓘ Source: listings_history table (triggers on properties + properties_extension) + one-shot
backfill from property_details.listing_events for pre-trigger history.
Tax reassessment forecast IN · Partial reset (capped growth)
- Current annual tax
- $943 · $79/mo
- Projected year-2 tax
- $943 · $79/mo
- Expected delta
- $0/yr ($0/mo · 0.0%)
ⓘ Screening estimate from a state-policy table — verify with the county assessor before closing.
Climate risk First Street
- Flood 1/10 Low FEMA zone X (unshaded) · 0% chance over 30 yrs
- Wildfire 1/10 Low
- Heat 2/10 Low 7 d/yr ≥100°F today · 16 d/yr by 30 yrs out
- Wind 2/10 Low 0% chance of damaging wind over 30 yrs
- Air quality 2/10 Low 1 unhealthy d/yr today · 1 by 30 yrs out
Nearby sold comps map
Loading sold comps map…
Walkable amenities ~0.75 mi
Loading nearby amenities…
Taxation est. · year 1
- Rental income
- $19,136
- − Mortgage interest
- −$4,985
- − Property taxes
- −$943
- − Insurance
- −$445
- − Repairs & maintenance
- −$1,531
- − Management
- −$1,531
- − Depreciation
- −$2,589
- Taxable income
- $7,112
- Est. tax owed @ 24.0%
- −$1,707
- After-tax cash flow
- $6,422/yr
For passive investors: Depreciation is non-cash, so a rental often shows a tax loss while cash-flowing — sheltering income. Rental losses are passive: they offset passive income freely, and up to $25,000/yr can offset ordinary (W-2) income if you actively participate and your MAGI is under $100k (phasing out to $0 by $150k); unused losses carry forward. On sale, claimed depreciation is recaptured at up to 25%, and gains may owe capital-gains tax (a 1031 exchange can defer both). Figures are a year-1 estimate at your 24.0% rate — not tax advice; consult a CPA.
Schools (NCES district)
- District
- Crown Point Community School Corporation
- NCES district ID
- 1802490
- Math proficiency
- 51% ▼ -9.00%
- Reading proficiency
- 61% ▼ -8.00%
- Median HH income
- $69,148
- Composite
- 49.55/100
- National rank
- #1990
- State rank
- #23 of 301 in IN
Livability — Cedar Lake
- Score
- 65/100
- State rank
- #354
- US rank
- #13482
Category grades
Schools grade is shown separately in the Schools card above.
Census & demographics
- Census place
- Cedar Lake, IN
- County
- Lake County · 422,878 people
- City population
- 17,680
- Metro
- Chicago-Naperville-Elgin, IL-IN-WI
- Population (ZIP)
- 17,680
- Household income
- $84,211
- Rent vs Own
- Severe rent burden
- 84.0
Population outlook (Lake County) Hauer SSP2
- Today (2025)
- 484,026 people
- By 2030
- 478,091 · -1.2%
- By 2040
- 462,974 · -4.3%
- By 2050
- 449,894 · -7.1%
- By 2075
- 436,169 · -9.9%
- By 2100
- 426,607 · -11.9%
Race, ethnicity, and origin ACS 2023
- Neighborhood character
- Predominantly White (88%)
- Race & ethnicity
- White 88% Hispanic / Latino 8% Two or more races 7%
- Hispanic origin (detail)
- Mexican 7%
- Common ancestry
- Romanian 16% Iranian 9% Italian 1%
- Foreign-born
- 2% · China
- Languages at home
- 95% English-only · Other Indo-European 2% Russian/Polish/Slavic 2% Spanish 2%
Political lean MEDSL · Lake
- 2024 margin
- Lean D (+5.6) · D 52.1% · R 46.5% · Other 1.5%
- 2008→2024 swing
- -28.6pp toward R · 2008: 34.3pp · 2024: 5.6pp
- All cycles
- 2024: D+5.6 2020: D+15.1 2016: D+20.6 2012: D+31.0 2008: D+34.3
Not yet ingested
- Civics
- —
Market trends
- HPI YoY
- ▼ -182.94%
- Current HPI
- 267.4434
- Rent YoY
- —
- Metro
- Chicago-Naperville-Elgin, IL-IN-WI
- State GDP YoY
- ▲ 2.90%
- F500 in state
- 18
Industry mix (Fortune 500 HQ in IN)
| Industry | F500 HQs | Revenue |
|---|---|---|
| Industrial Machinery | 2 | $37B |
|
||
| Healthcare | 1 | $177B |
|
||
| Pharmaceuticals | 1 | $45B |
|
||
| Metals / Steel | 1 | $18B |
|
||
| Agriculture | 1 | $17B |
|
||
| Packaging | 1 | $12B |
|
||
Price history
+34.0% since first listed4 events — show timeline
- 2026-03-11 Listed $99,000 NIRA MLS as Distributed by MLS Grid
- 2024-02-13 Sold (MLS) $70,000 NIRA MLS as Distributed by MLS Grid
- 2024-01-31 Pending — NIRA MLS as Distributed by MLS Grid
- 2024-01-25 Listed $73,900 NIRA MLS as Distributed by MLS Grid
Property tax history
+12.2%/yrLatest (2024): $943 · +2.4% YoY. Source: county tax records.
Cash-flow waterfall
monthlySold comps — $/sqft
last 12 mo · ≤1 miLoading sold comps…