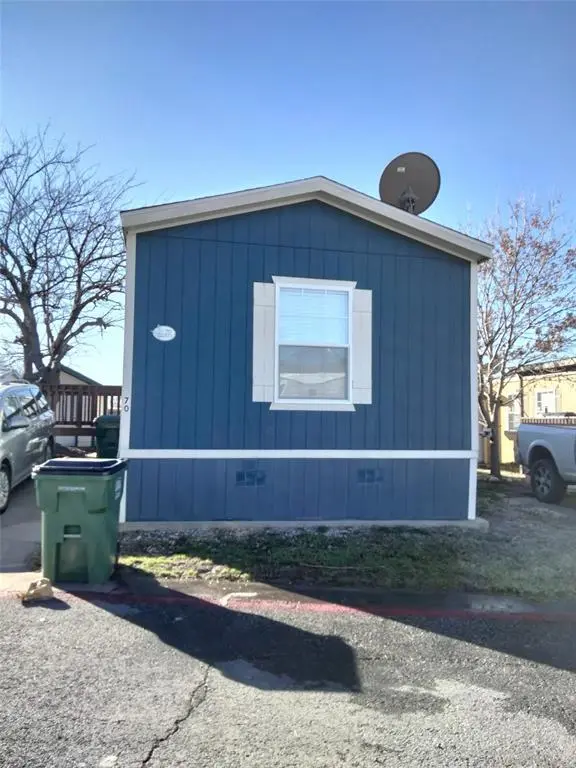
709 N Collins Fwy #70 · Howe, TX
Flood risk No data
- FEMA flood zone
- —
- Chance of flooding over 30 yrs
- —
- Est. flood insurance / yr
- —
Fire risk No data
- Est. fire insurance / yr
- —
Heat risk No data
- Hot days now (above threshold)
- —
- Hot days in 30 yrs
- —
Wind risk No data
- Chance of severe wind over 30 yrs
- —
Air-quality risk No data
- Unhealthy air days now
- —
- Unhealthy air days in 30 yrs
- —
Risk factors via First Street. Map © Google.
Why this score? — see what drove the B grade
The composite is a weighted blend of 9 inputs, each scored 0–100. Each bar is that input's sub-score; the figure is the points it added to the 100-point composite (weight × sub-score).
- Cash flow +30.0/30.0
- 1% rule +10.0/10.0
- DSCR +10.0/10.0
- ARV discount +7.5/15.0
- Schools +4.3/10.0
- Livability +3.5/5.0
- Rent growth +2.5/5.0
- Condition / age +2.2/5.0
- Appreciation +0.0/10.0
$50,000
🖨 Deal sheet 📄 Offer letter ✓ Due diligence
Listing remarks MLS
This home features 3 bedrooms, 2 bathrooms, and an outside shed. This home was built in 2018. This home is being sold as-is or minor maintenance work could be completed depending on agreed terms. This property allows for access to a community swimming pool and fenced in park.
Key facts
- Outside shed
- Fenced in park
- Pool
Tags
Neighborhood map
What this means for you Summary
Snapshot
- This is a 3-bed/2.0-bath manufactured listed at $50k. Condition is rated fair.
Deal economics
- At list price, monthly cash flow is $895 ($11k/yr) — positive.
- The deal already cash-flows at list — no discount required.
- Meets the 1% rule at list price ($2k rent vs $50k).
- Recommended offer: $44k (12.0% below list) — sets the bar for market timing.
- Cap rate 27.8% vs local median 4.5% in Howe — top-decile yield for the area; either an underpriced asset or a hidden risk that comps aren't pricing in. Stress-test before assuming the spread holds.
Location & tenants
- Location reads 70/100 on livability (#368 in TX) — a middle-class / working-renter tenant base. Strengths: crime A+, cost of living A+, housing A+; Watch: schools D+, amenities F, commute F.
- Howe ISD (rural): math 47% / reading 51% proficiency, ranked #180 of 826 in TX (top 22%) — families likely to look elsewhere, expect single-tenant / working-renter base with shorter leases.
- Market conditions: 142 active listings in the ZIP; 1 comparable units currently listed for rent nearby; 2,272 units permitted in Grayson County in 2024 (750 in 5+ unit buildings).
Forward outlook
- Local home prices are declining (-3.0%/yr); year-one equity from $346 of loan paydown is wiped out by about $2k of value loss. Plan a longer hold.
- Grayson County population projected at +12% by 2050 — modest demand growth; plan on rents tracking national, not racing it.
- At projected returns (-3.0% appreciation + 3.0% rent growth), your $14k cash investment doubles in ~2 years — after that, you're playing with house money.
Negotiation context
- It's been on market 130 days — a 12% lower offer ($44k) is reasonable based on typical stale-listing flexibility.
Questions for the listing agent
- It's been on market 130 days. Have you received any prior offers? Is the seller open to a 12% concession, seller financing, or rate buy-down credit?
- Have any recent inspections been done? Can we get a copy of the seller's disclosures and any deferred-maintenance estimates?
- Why hasn't it sold? Are there any deal-killer items the seller is aware of (foundation, flood, title, zoning, code violations)?
- Is there a deadline driving the sale (1031 exchange, divorce, estate, relocation)? That informs how much negotiation room exists.
- Schools are D-rated, which usually means shorter tenancies and higher turnover. Who's the typical renter profile here, and what's been the actual vacancy rate?
- What's the average days-on-market for RENTAL listings here right now (not sales)? A rising rental-DOM trend means longer vacancies and softer asking-rent achievability than the comps imply.
- What's the recent tenant-quality profile in this submarket — average credit score on applications, eviction rate, late-payment / NSF rate, and stable-employment percentage? A property-management company in the area should have these aggregated.
- How much new for-sale + rental construction is in the pipeline within 1–3 miles? Heavy new supply typically softens prices + rents 12–24 months out; constrained supply supports both.
Investment metrics
- 1% rule
- 3.14% ✓
- Cap rate
- 27.77%
- Cash-on-cash
- 76.69%
- DSCR
- 4.41
- GRM
- 2.7
CMA / ARV
No comps found within radius.
Projected returns pro-forma
-3.0% appreciation · 3.0% rent growth · sell at horizon
- IRR
- 76.7%
- Equity multiple
- 4.49×
- Total profit
- $48,909
- Equity at exit
- $7,455
- IRR
- 80.3%
- Equity multiple
- 9.29×
- Total profit
- $116,067
- Equity at exit
- $4,323
Cash invested: $14,000 (down + closing). Projections, not guarantees.
Landlord ↔ Tenant lean methodology
- Overall (STATE)
- 87 Strongly Landlord-Friendly
- State Texas
- 87 Strongly Landlord-Friendly · R+5
- County
- — inherits STATE
- City
- — inherits STATE
ZIP-level market 75459
- Home prices YoY
- -18.5%
- Active inventory
- 142
- Price-to-rent
- 2.7×
Monthly cashflow live
- Estimated rent
- $1,570 medium interval (Pro) →
- Mortgage (P&I)
- −$262
- Tax est. 1.5%
- −$62 /mo · $750/yr
- Insurance
- −$21
- HOA
- −$0
- Vacancy / Maint / Mgmt
- −$330
- Net cashflow
- $895
Break-even live
UW: 25.0% down · 7.5% · 30yr · 1.5% tax · 5.0% vac · 8.0% maint · 8.0% mgmt
Financing live
Cash to close
- Down payment
- $12,500
- Closing costs
- $1,500
- Reserves months
- —
- Total cash needed
- —
Loan-product check · same deal, 3 products live
Conventional
25% down · 7.5% · 30yr
- Down + closing
- —
- Monthly P&I
- —
- Monthly cashflow
- —
- DSCR
- —
- Eligible?
- —
Personal DTI + credit; lowest rate.
DSCR
20% down · 8.5% · 30yr
- Down + closing
- —
- Monthly P&I
- —
- Monthly cashflow
- —
- DSCR
- —
- Eligible?
- —
No personal income docs; deal must DSCR.
Hard money
10% down · 12.0% · 12mo
- Down + closing
- —
- Monthly P&I
- —
- Monthly cashflow
- —
- DSCR
- —
- Eligible?
- —
Short-term bridge; refi at stabilization.
Rent comps 1 comps
| Address | Beds | Baths | Sqft | Rent | $/sqft | DOM | Units | Dist |
|---|---|---|---|---|---|---|---|---|
| 116 N Western Hills Dr Howe, TX | 1.0–3.0 | 1.0–2.0 | 852 | $1,570 | $1.84 | 1d | 19 | 0.84mi |
Listing history 18 events
-
2026-06-19days on market $50,000 Active 130 DOM
-
2026-06-18days on market $50,000 Active 129 DOM
-
2026-06-17days on market $50,000 Active 128 DOM
-
2026-06-16days on market $50,000 Active 127 DOM
-
2026-06-15days on market $50,000 Active 126 DOM
-
2026-06-14days on market $50,000 Active 124 DOM
-
2026-06-13days on market $50,000 Active 123 DOM
-
2026-06-10days on market $50,000 Active 121 DOM
-
2026-06-09days on market $50,000 Active 120 DOM
-
2026-06-08days on market $50,000 Active 119 DOM
-
2026-06-07days on market $50,000 Active 118 DOM
-
2026-06-05days on market $50,000 Active 115 DOM
-
2026-06-02days on market $50,000 Active 113 DOM
-
2026-06-01days on market $50,000 Active 112 DOM
-
2026-05-31days on market $50,000 Active 111 DOM
-
2026-05-30days on market $50,000 Active 110 DOM
-
2026-02-21price $55,000 276-char remark
Show marketing remark (276 chars)
This home features 3 bedrooms, 2 bathrooms, and an outside shed. This home was built in 2018. This home is being sold as-is or minor maintenance work could be completed depending on agreed terms. This property allows for access to a community swimming pool and fenced in park.
-
2026-02-06$60,000 Active 276-char remark
Show marketing remark (276 chars)
This home features 3 bedrooms, 2 bathrooms, and an outside shed. This home was built in 2018. This home is being sold as-is or minor maintenance work could be completed depending on agreed terms. This property allows for access to a community swimming pool and fenced in park.
ⓘ Source: listings_history table (triggers on properties + properties_extension) + one-shot
backfill from property_details.listing_events for pre-trigger history.
Nearby sold comps map
Loading sold comps map…
Walkable amenities ~0.75 mi
Loading nearby amenities…
Taxation est. · year 1
- Rental income
- $18,840
- − Mortgage interest
- −$2,801
- − Property taxes
- −$750
- − Insurance
- −$250
- − Repairs & maintenance
- −$1,507
- − Management
- −$1,507
- − Depreciation
- −$1,455
- Taxable income
- $10,570
- Est. tax owed @ 24.0%
- −$2,537
- After-tax cash flow
- $8,200/yr
For passive investors: Depreciation is non-cash, so a rental often shows a tax loss while cash-flowing — sheltering income. Rental losses are passive: they offset passive income freely, and up to $25,000/yr can offset ordinary (W-2) income if you actively participate and your MAGI is under $100k (phasing out to $0 by $150k); unused losses carry forward. On sale, claimed depreciation is recaptured at up to 25%, and gains may owe capital-gains tax (a 1031 exchange can defer both). Figures are a year-1 estimate at your 24.0% rate — not tax advice; consult a CPA.
Condition & rehab AI · 12 photos
This manufactured home requires moderate repairs and maintenance, particularly to the exterior and landscaping, to improve its condition and value.
Repairs flagged
- Major Stairs — Worn and may need repair
- Major Playground fence — Aged and may need replacement
- Major Landscaping — Sparse and needs maintenance
Value-add opportunities
- Both Playground renovation — Enhances community appeal and safety
- Both Landscaping improvement — Enhances curb appeal and property value
- Both Playground fence replacement — Improves safety and property value
Renovation cost estimate screening
| Repair item | Severity | Est. cost |
|---|---|---|
| Stairs · Worn and may need repair | Major | $15,000–50,000 |
| Playground fence · Aged and may need replacement | Major | $15,000–50,000 |
| Landscaping · Sparse and needs maintenance | Major | $15,000–50,000 |
| Total estimated repair cost · 3 items | $45,000–150,000 |
Value-add ROI direction
- Both Playground renovation — Enhances community appeal and safety ↑
- Both Landscaping improvement — Enhances curb appeal and property value ↑
- Both Playground fence replacement — Improves safety and property value ↑
ⓘ Cost ranges are severity-bucket heuristics (US national rule-of-thumb). Get contractor quotes + a written scope before underwriting a rehab budget.
Schools (NCES district)
- District
- Howe ISD
- NCES district ID
- 4823670
- Math proficiency
- 47% ▼ -2.00%
- Reading proficiency
- 51% ▲ 1.00%
- Median HH income
- $60,164
- Composite
- 42.92/100
- National rank
- #3119
- State rank
- #180 of 826 in TX
Livability — Howe
- Score
- 70/100
- State rank
- #368
- US rank
- #7804
Category grades
Schools grade is shown separately in the Schools card above.
Census & demographics
- Census place
- Howe, TX
- Population (ZIP)
- 6,620
Population outlook (Grayson County) Hauer SSP2
- Today (2025)
- 134,540 people
- By 2030
- 138,653 · +3.1%
- By 2040
- 145,958 · +8.5%
- By 2050
- 151,218 · +12.4%
- By 2075
- 161,802 · +20.3%
- By 2100
- 159,036 · +18.2%
Race, ethnicity, and origin ACS 2023
- Neighborhood character
- Majority White (65%)
- Race & ethnicity
- White 65% Hispanic / Latino 28% Two or more races 9% Black 5%
- Hispanic origin (detail)
- Mexican 27%
- Common ancestry
- Slovak 4% Lithuanian 3% Italian 1%
- Foreign-born
- 11% · Canada
- Languages at home
- 82% English-only · Spanish 17%
Political lean MEDSL · Grayson
- 2024 margin
- Solid R (+54.3) · D 22.5% · R 76.7%
- 2008→2024 swing
- -16.4pp toward R · 2008: -37.9pp · 2024: -54.3pp
- All cycles
- 2024: R+54.3 2020: R+49.9 2016: R+53.1 2012: R+48.0 2008: R+37.9
Not yet ingested
- Civics
- —
Market trends
- HPI YoY
- ▼ -56.75%
- Current HPI
- 249.7211
- Rent YoY
- —
- Metro
- —
- State GDP YoY
- ▲ 3.95%
- F500 in state
- 110
Industry mix (Fortune 500 HQ in TX)
| Industry | F500 HQs | Revenue |
|---|---|---|
| Energy | 16 | $1,198B |
|
||
| Technology | 5 | $198B |
|
||
| Engineering / Construction | 4 | $72B |
|
||
| Energy Services | 3 | $60B |
|
||
| Utilities | 3 | $41B |
|
||
| Healthcare | 2 | $330B |
|
||
Price history
-8.3% since first listed2 events — show timeline
- 2026-02-21 Price Changed $55,000 NTREIS
- 2026-02-06 Listed $60,000 NTREIS
Cash-flow waterfall
monthlySold comps — $/sqft
last 12 mo · ≤1 miLoading sold comps…