4401 Wren Pl · Valparaiso, IN
Flood risk 1/10 · Minimal
- FEMA flood zone
- X (unshaded)
- Chance of flooding over 30 yrs
- 0.0%
- Est. flood insurance / yr
- $507 – $1,088
Fire risk 2/10 · Minimal
- Est. fire insurance / yr
- $717 – $1,331
Heat risk 2/10 · Minimal
- Hot days now (above 101°F)
- 7 days/yr
- Hot days in 30 yrs
- 15 days/yr
Wind risk 2/10 · Minimal
- Chance of severe wind over 30 yrs
- 1.0%
Air-quality risk 2/10 · Minimal
- Unhealthy air days now
- 1 days/yr
- Unhealthy air days in 30 yrs
- 2 days/yr
Risk factors via First Street. Map © Google.
Why this score? — see what drove the D+ grade
The composite is a weighted blend of 9 inputs, each scored 0–100. Each bar is that input's sub-score; the figure is the points it added to the 100-point composite (weight × sub-score).
- ARV discount +15.0/15.0
- Cash flow +11.7/30.0
- Schools +5.2/10.0
- Livability +4.1/5.0
- Condition / age +4.0/5.0
- DSCR +3.5/10.0
- 1% rule +3.4/10.0
- Rent growth +2.5/5.0
- Appreciation +0.0/10.0
$360,746
🖨 Deal sheet 📄 Offer letter ✓ Due diligence
Listing remarks MLS
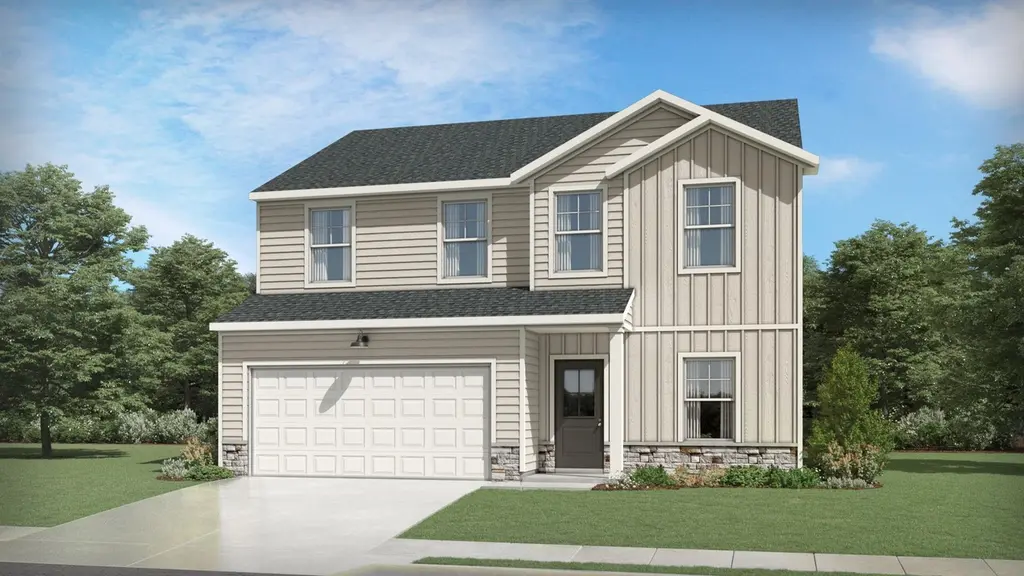
Welcome home to the Jade, a thoughtfully designed floorplan that blends modern comfort with everyday affordability. Featuring 5 bedrooms, 2.5 baths, a flexible office-ready space, and an open-concept kitchen and Great Room with quartz countertops, stainless steel appliances, and luxury vinyl flooring, the Jade is built for the way you live today. Enjoy a private Owner's Suite with a walk-in shower and closet, plus smart upgrades like 9-foot first-floor ceilings, a tankless water heater, and full yard landscaping-all wrapped into one beautiful home.
Key facts
- Open-concept kitchen
- Walk-in closet
- Smart upgrades
Tags
Neighborhood map
What this means for you Summary
Snapshot
- This is a 5-bed/2.5-bath single-family listed at $361k. Condition is rated good.
Deal economics
- At list price, monthly cash flow is $-104 ($-1k/yr) — negative.
- To cash-flow at today's rent, offer at most $346k (4.2% below list).
- To meet the 1% rule (rent ≥ 1% of price), the offer needs to be $302k (16.2% below list).
- Recommended offer: $302k (16.2% below list) — sets the bar for 1% rule.
- Cap rate 5.9% vs local median 2.8% in Valparaiso — top-decile yield for the area; either an underpriced asset or a hidden risk that comps aren't pricing in. Stress-test before assuming the spread holds.
Location & tenants
- Location reads 82/100 on livability (#12 in IN, #1,149 nationally) — a professional / high-income tenant draw. Strengths: schools A+, crime A+, cost of living A+; Watch: amenities D-, commute F.
- Valparaiso Community Schools (suburban): math 56% / reading 64% proficiency, ranked #18 of 301 in IN (top 6%) — acceptable for families but not a draw, mixed tenant base, ~2y average lease.
- Market conditions: 375 active listings in the ZIP; 2 comparable units currently listed for rent nearby; solid renter incomes; 542 units permitted in Porter County in 2024 (0 in 5+ unit buildings).
- This rent runs 37% of the median local income ($99k/yr) — at the standard rent-burdened threshold; future hikes will face affordability resistance.
Forward outlook
- Local home prices are declining (-3.0%/yr); year-one equity from $2k of loan paydown is wiped out by about $11k of value loss. Plan a longer hold.
- Porter County population projected at +6% by 2050 — modest demand growth; plan on rents tracking national, not racing it.
Negotiation context
- It's been on market 61 days — a 6% lower offer ($339k) is reasonable based on typical stale-listing flexibility.
Questions for the listing agent
- What do current leases actually rent for vs. the listed asking? Can we see a recent rent roll and the last 12 months of T-12 income?
- It's been on market 61 days. Have you received any prior offers? Is the seller open to a 16% concession, seller financing, or rate buy-down credit?
- Why hasn't it sold? Are there any deal-killer items the seller is aware of (foundation, flood, title, zoning, code violations)?
- Is there a deadline driving the sale (1031 exchange, divorce, estate, relocation)? That informs how much negotiation room exists.
- Schools are A-rated — typically a magnet for longer-tenancy family renters. What's the average tenant stay here, and is there a school-zone premium baked into asking?
- The area grade is low — what's the realistic commute time and amenity access for the typical tenant pool here? Any planned neighborhood developments (good or bad) we should know about?
- What's the average days-on-market for RENTAL listings here right now (not sales)? A rising rental-DOM trend means longer vacancies and softer asking-rent achievability than the comps imply.
- What's the recent tenant-quality profile in this submarket — average credit score on applications, eviction rate, late-payment / NSF rate, and stable-employment percentage? A property-management company in the area should have these aggregated.
- How much new for-sale + rental construction is in the pipeline within 1–3 miles? Heavy new supply typically softens prices + rents 12–24 months out; constrained supply supports both.
Investment metrics
- 1% rule
- 0.84% ✗
- Cap rate
- 5.95%
- Cash-on-cash
- -1.23%
- DSCR
- 0.95
- GRM
- 9.9
CMA / ARV
- ARV (median comp)
- $459,348
- List price
- $360,746
- Delta
- -21.47%
- Verdict
- UNDERPRICED
- Comps
- 20 within 1.0 mi
Show comp detail 12 sales within ~0.75 mi
| Address | Dist | Beds/Ba | Sqft | Sold | Price | $/sf | Match |
|---|---|---|---|---|---|---|---|
| 4208 Iron Gate Dr | 0.09mi | 4/2.5 (-1) | 2,387 (+10%) | 5mo | $420,000 | $176 | 70 |
| 528 Hampton Manor Ct | 0.36mi | 4/2.5 (-1) | 2,282 (+5%) | 1mo | $463,900 | $203 | 69 |
| 3756 Fender St | 0.45mi | 4/2.5 (-1) | 2,203 (+2%) | 7mo | $388,405 | $176 | 65 |
| 3522 Brander Dr | 0.52mi | 4/2.5 (-1) | 2,203 (+2%) | 4mo | $400,000 | $182 | 65 |
| 3631 Brander Dr | 0.50mi | 4/2.5 (-1) | 2,201 (+2%) | 12mo | $420,000 | $191 | 59 |
| 3858 Fender St | 0.54mi | 5/2.5 | 2,279 (+5%) | 9mo | $428,760 | $188 | 59 |
| 543 Chicory Ln | 0.48mi | 4/2.5 (-1) | 2,015 (-7%) | 4mo | $395,500 | $196 | 58 |
| 549 Marilyn Way | 0.42mi | 4/2.5 (-1) | 2,352 (+9%) | 5mo | $489,000 | $208 | 57 |
| 208 Sweetbay St | 0.28mi | 4/2.5 (-1) | 2,464 (+14%) | 3mo | $472,000 | $192 | 56 |
| 3857 Fender St | 0.49mi | 4/2.5 (-1) | 2,263 (+4%) | 10mo | $404,990 | $179 | 56 |
| 3525 Brander Dr | 0.55mi | 4/2.5 (-1) | 2,193 (+1%) | 13mo | $419,990 | $192 | 56 |
| 3760 Fender St | 0.54mi | 4/2.5 (-1) | 2,386 (+10%) | 8mo | $403,000 | $169 | 46 |
Match score weights: distance 35% · size 25% · config 20% · recency 20%. Top-matched comps best support the ARV.
Projected returns pro-forma
-3.0% appreciation · 3.0% rent growth · sell at horizon
- IRR
- -18.3%
- Equity multiple
- 0.36×
- Total profit
- $-65,009
- Equity at exit
- $53,788
- IRR
- -10.6%
- Equity multiple
- 0.36×
- Total profit
- $-64,920
- Equity at exit
- $31,191
Cash invested: $101,009 (down + closing). Projections, not guarantees.
Landlord ↔ Tenant lean methodology
- Overall (STATE)
- 90 Strongly Landlord-Friendly
- State Indiana
- 90 Strongly Landlord-Friendly · R+11
- County
- — inherits STATE
- City
- — inherits STATE
ZIP-level market 46385
- Active inventory
- 375
- Price-to-rent
- 9.9×
Monthly cashflow live
- Estimated rent
- $3,025 medium interval (Pro) →
- Mortgage (P&I)
- −$1,892
- Tax est. 1.5%
- −$451 /mo · $5,411/yr
- Insurance
- −$150
- HOA
- −$0
- Vacancy / Maint / Mgmt
- −$635
- Net cashflow
- $-104
Break-even live
UW: 25.0% down · 7.5% · 30yr · 1.5% tax · 5.0% vac · 8.0% maint · 8.0% mgmt
Financing live
Cash to close
- Down payment
- $90,186
- Closing costs
- $10,822
- Reserves months
- —
- Total cash needed
- —
Loan-product check · same deal, 3 products live
Conventional
25% down · 7.5% · 30yr
- Down + closing
- —
- Monthly P&I
- —
- Monthly cashflow
- —
- DSCR
- —
- Eligible?
- —
Personal DTI + credit; lowest rate.
DSCR
20% down · 8.5% · 30yr
- Down + closing
- —
- Monthly P&I
- —
- Monthly cashflow
- —
- DSCR
- —
- Eligible?
- —
No personal income docs; deal must DSCR.
Hard money
10% down · 12.0% · 12mo
- Down + closing
- —
- Monthly P&I
- —
- Monthly cashflow
- —
- DSCR
- —
- Eligible?
- —
Short-term bridge; refi at stabilization.
Rent comps 2 comps
| Address | Beds | Baths | Sqft | Rent | $/sqft | DOM | Units | Dist |
|---|---|---|---|---|---|---|---|---|
| 3522 Brander Dr Valparaiso, IN | 4.0 | 3.0 | 2203 | $3,100 | $1.41 | 22d | 1 | 0.53mi |
| 2707 Westwind Dr Valparaiso, IN | 4.0 | 2.5 | 2902 | $2,800 | $0.96 | 12d | 1 | 1.38mi |
Listing history 16 events
-
2026-06-18days on market $360,746 Active 61 DOM
-
2026-06-17days on market $360,746 Active 60 DOM
-
2026-06-16days on market $360,746 Active 59 DOM
-
2026-06-15days on market $360,746 Active 58 DOM
-
2026-06-13days on market $360,746 Active 56 DOM
-
2026-06-13days on market $360,746 Active 55 DOM
-
2026-06-09days on market $360,746 Active 52 DOM
-
2026-06-08days on market $360,746 Active 51 DOM
-
2026-06-07days on market $360,746 Active 50 DOM
-
2026-06-04days on market $360,746 Active 47 DOM
-
2026-06-03days on market $360,746 Active 46 DOM
-
2026-06-02days on market $360,746 Active 45 DOM
-
2026-06-01days on market $360,746 Active 44 DOM
-
2026-05-31days on market $360,746 Active 43 DOM
-
2026-05-19price $360,746 554-char remark
Show marketing remark (554 chars)
Welcome home to the Jade, a thoughtfully designed floorplan that blends modern comfort with everyday affordability. Featuring 5 bedrooms, 2.5 baths, a flexible office-ready space, and an open-concept kitchen and Great Room with quartz countertops, stainless steel appliances, and luxury vinyl flooring, the Jade is built for the way you live today. Enjoy a private Owner's Suite with a walk-in shower and closet, plus smart upgrades like 9-foot first-floor ceilings, a tankless water heater, and full yard landscaping-all wrapped into one beautiful home.
-
2026-04-19$356,746 Active 554-char remark
Show marketing remark (554 chars)
Welcome home to the Jade, a thoughtfully designed floorplan that blends modern comfort with everyday affordability. Featuring 5 bedrooms, 2.5 baths, a flexible office-ready space, and an open-concept kitchen and Great Room with quartz countertops, stainless steel appliances, and luxury vinyl flooring, the Jade is built for the way you live today. Enjoy a private Owner's Suite with a walk-in shower and closet, plus smart upgrades like 9-foot first-floor ceilings, a tankless water heater, and full yard landscaping-all wrapped into one beautiful home.
ⓘ Source: listings_history table (triggers on properties + properties_extension) + one-shot
backfill from property_details.listing_events for pre-trigger history.
Climate risk First Street
- Flood 1/10 Low FEMA zone X (unshaded) · 0% chance over 30 yrs
- Wildfire 2/10 Low
- Heat 2/10 Low 7 d/yr ≥101°F today · 15 d/yr by 30 yrs out
- Wind 2/10 Low 100% chance of damaging wind over 30 yrs
- Air quality 2/10 Low 1 unhealthy d/yr today · 2 by 30 yrs out
Nearby sold comps map
Loading sold comps map…
Walkable amenities ~0.75 mi
Loading nearby amenities…
Taxation est. · year 1
- Rental income
- $36,295
- − Mortgage interest
- −$20,207
- − Property taxes
- −$5,411
- − Insurance
- −$1,804
- − Repairs & maintenance
- −$2,904
- − Management
- −$2,904
- − Depreciation
- −$10,494
- Taxable loss
- −$7,429
- Est. tax savings @ 24.0%
- +$1,783
- After-tax cash flow
- $540/yr
For passive investors: Depreciation is non-cash, so a rental often shows a tax loss while cash-flowing — sheltering income. Rental losses are passive: they offset passive income freely, and up to $25,000/yr can offset ordinary (W-2) income if you actively participate and your MAGI is under $100k (phasing out to $0 by $150k); unused losses carry forward. On sale, claimed depreciation is recaptured at up to 25%, and gains may owe capital-gains tax (a 1031 exchange can defer both). Figures are a year-1 estimate at your 24.0% rate — not tax advice; consult a CPA.
Condition & rehab AI · 2 photos
This home is in good condition with a good exterior and interior. It has a good curb appeal and is ready for a new owner.
Value-add opportunities
- Both Paint exterior trim — Enhances curb appeal and adds value
- Both Clean and maintain gutters — Keeps the home looking well-maintained and prevents water damage
Renovation cost estimate screening
Value-add ROI direction
- Both Paint exterior trim — Enhances curb appeal and adds value ↑
- Both Clean and maintain gutters — Keeps the home looking well-maintained and prevents water damage ↑
ⓘ Cost ranges are severity-bucket heuristics (US national rule-of-thumb). Get contractor quotes + a written scope before underwriting a rehab budget.
Schools (NCES district)
- District
- Valparaiso Community Schools
- NCES district ID
- 1811970
- Math proficiency
- 56% ▼ -9.00%
- Reading proficiency
- 64% ▼ -6.00%
- Median HH income
- $56,736
- Composite
- 51.69/100
- National rank
- #1691
- State rank
- #18 of 301 in IN
Livability — Valparaiso
- Score
- 82/100
- State rank
- #12
- US rank
- #1149
Category grades
Schools grade is shown separately in the Schools card above.
Census & demographics
- County
- Porter County · 151,647 people
- City population
- 83,039
- Metro
- Chicago-Naperville-Elgin, IL-IN-WI
- Population (ZIP)
- 40,856
- Household income
- $98,957
- Rent vs Own
- Severe rent burden
- 304.0
Population outlook (Porter County) Hauer SSP2
- Today (2025)
- 177,804 people
- By 2030
- 181,552 · +2.1%
- By 2040
- 185,830 · +4.5%
- By 2050
- 187,498 · +5.5%
- By 2075
- 189,585 · +6.6%
- By 2100
- 183,722 · +3.3%
Race, ethnicity, and origin ACS 2023
- Neighborhood character
- Predominantly White (83%)
- Race & ethnicity
- White 83% Hispanic / Latino 9% Two or more races 7% Black 2% Asian 2%
- Hispanic origin (detail)
- Mexican 6% Puerto Rican 2%
- Common ancestry
- Romanian 9% Italian 2% Lithuanian 2%
- Foreign-born
- 3% · Canada, Philippines
- Languages at home
- 94% English-only · Spanish 2% Other Indo-European 1% Russian/Polish/Slavic 1%
Political lean MEDSL · Porter
- 2024 margin
- R (+10.5) · D 43.8% · R 54.3% · Other 1.8%
- 2008→2024 swing
- -17.7pp toward R · 2008: 7.2pp · 2024: -10.5pp
- All cycles
- 2024: R+10.5 2020: R+6.1 2016: R+6.8 2012: D+3.8 2008: D+7.2
Not yet ingested
- Civics
- —
Market trends
- HPI YoY
- ▼ -151.11%
- Current HPI
- 201.7039
- Rent YoY
- —
- Metro
- Chicago-Naperville-Elgin, IL-IN-WI
- State GDP YoY
- ▲ 2.90%
- F500 in state
- 18
Industry mix (Fortune 500 HQ in IN)
| Industry | F500 HQs | Revenue |
|---|---|---|
| Industrial Machinery | 2 | $37B |
|
||
| Healthcare | 1 | $177B |
|
||
| Pharmaceuticals | 1 | $45B |
|
||
| Metals / Steel | 1 | $18B |
|
||
| Agriculture | 1 | $17B |
|
||
| Packaging | 1 | $12B |
|
||
Price history
+1.1% since first listed2 events — show timeline
- 2026-05-19 Price Changed $360,746 Zillow
- 2026-04-19 Listed $356,746 Zillow
Cash-flow waterfall
monthlySold comps — $/sqft
last 12 mo · ≤1 miLoading sold comps…