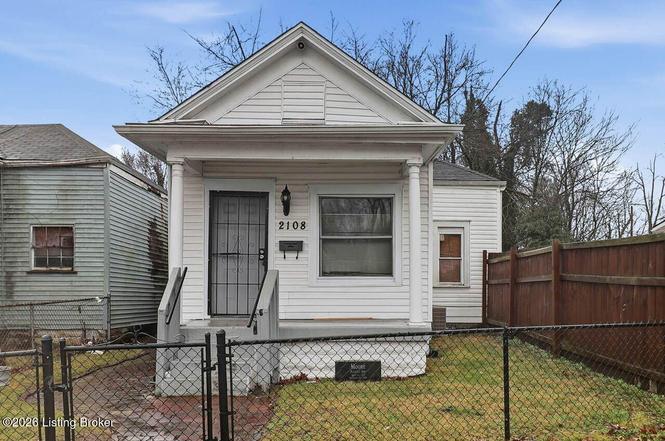
2108 Wilson Ave · Louisville, KY
Flood risk 6/10 · Moderate
- FEMA flood zone
- X (shaded)
- Chance of flooding over 30 yrs
- 0.69%
- Est. flood insurance / yr
- $507 – $1,088
Fire risk 1/10 · Minimal
- Est. fire insurance / yr
- $839 – $1,559
Heat risk 5/10 · Moderate
- Hot days now (above 105°F)
- 7 days/yr
- Hot days in 30 yrs
- 19 days/yr
Wind risk 2/10 · Minimal
- Chance of severe wind over 30 yrs
- 1.0%
Air-quality risk 2/10 · Minimal
- Unhealthy air days now
- 1 days/yr
- Unhealthy air days in 30 yrs
- 3 days/yr
Risk factors via First Street. Map © Google.
Why this score? — see what drove the B+ grade
The composite is a weighted blend of 9 inputs, each scored 0–100. Each bar is that input's sub-score; the figure is the points it added to the 100-point composite (weight × sub-score).
- Cash flow +30.0/30.0
- DSCR +10.0/10.0
- Appreciation +10.0/10.0
- 1% rule +9.8/10.0
- Rent growth +4.5/5.0
- Livability +3.2/5.0
- ARV discount +3.1/15.0
- Condition / age +2.5/5.0
- Schools +2.3/10.0
$69,900
🖨 Deal sheet 📄 Offer letter ✓ Due diligence
Listing remarks
Instant cash flow and a stress-free addition to any portfolio. This updated 2 bed, 1 bath home comes with a year lease already in place, delivering immediate income from day one. Well-maintained and tenant occupied, it's a dependable, turnkey investment with minimal oversight required. Opportunities like this—clean, cash producing, and ready to go—don't come around often.
Key facts
- 4,200 sq ft lot
- Built 1900
- Listed 105 days
Property features AI
Finance
- Other: Lot dimensions approximately 29.8 x 140 feet; Lot size about 0.1 acre; Total building area reported as 950 sq ft
- HOA & community: No association fee
Exterior
- Parking: No dedicated parking
- Utilities: Electricity connected
- Home design: Single-family residence; Shotgun architectural style; One story
- Construction: Built in 1900; Wood frame construction; Shingle roof
- Exterior features: Cleared lot; Privacy fencing; Wood fencing; Chain link fencing
Interior
- Kitchen: Kitchen on the first floor
- Bedrooms: Two bedrooms total (both on the first floor)
- Bathrooms: One full bathroom
- Heating & cooling: Forced air heating
- Interior features: Five total rooms; Two closets; No basement; No fireplaces; First-floor primary bedroom; First-floor bedrooms
- Laundry & utility: First-floor laundry
Neighborhood map
What this means for you Summary
Snapshot
- This is a 2-bed/1.0-bath single-family listed at $70k.
Deal economics
- At list price, monthly cash flow is $395 ($5k/yr) — positive.
- The deal already cash-flows at list — no discount required.
- Meets the 1% rule at list price ($1k rent vs $70k).
- Recommended offer: $64k (9.0% below list) — sets the bar for market timing.
- Cap rate 13.1% vs local median 5.0% in Louisville — top-decile yield for the area; either an underpriced asset or a hidden risk that comps aren't pricing in. Stress-test before assuming the spread holds.
Location & tenants
- Location reads 63/100 on livability (#333 in KY) — a middle-class / working-renter tenant base. Strengths: cost of living A+, housing A+; Watch: employment C-, health & safety D+, schools D-.
- Jefferson County (urban): math 19% / reading 35% proficiency, ranked #121 of 165 in KY (top 73%) — low school quality limits family demand, transient renter base, plan for 1-2y turnover.
- Market conditions: Rents rising fast (+8.1%/yr); 91 active listings in the ZIP; 40 comparable units currently listed for rent nearby; rentals at typical pace (median 24d on market — plan ~3-4 weeks tenant-placement turnaround); lower-income renter base — watch delinquency; 2,836 units permitted in Jefferson County in 2024 (1,558 in 5+ unit buildings).
Forward outlook
- In year one you build about $7k of equity ($483 loan paydown + $7k appreciation (10.0% local appreciation)).
- Jefferson County population projected at +13% by 2050 — modest demand growth; plan on rents tracking national, not racing it.
- At projected returns (10.0% appreciation + 8.0% rent growth), your $20k cash investment doubles in ~2 years — after that, you're playing with house money.
- By year 5, paydown + projected appreciation supports a ~$35k cash-out refi (75% LTV) — recoverable capital for the next deal without selling this one.
Negotiation context
- It's been on market 105 days — a 9% lower offer ($64k) is reasonable based on typical stale-listing flexibility.
- 3 sale attempts since 20y ago with the ask held roughly flat each time — persistent listings suggest the price (not the market) is what's stuck; bring a comps-based counter.
- Current owner paid $16k; list at $70k implies a 337% gain — meaningful room to come down on a strong offer.
Risks & watch-outs
- Watch-outs: built in 1900 — expect roof / HVAC / electrical / plumbing capex.
- Climate carrying-cost: major flood risk; extreme-heat days projected 7→19/yr by 2055 (HVAC capex compounding) — expect insurance premiums to compound above CPI over the hold.
Questions for the listing agent
- It's been on market 105 days. Have you received any prior offers? Is the seller open to a 9% concession, seller financing, or rate buy-down credit?
- Built in 1900 — when were the roof, HVAC, electrical panel, plumbing, and water heater last replaced?
- Why hasn't it sold? Are there any deal-killer items the seller is aware of (foundation, flood, title, zoning, code violations)?
- Is there a deadline driving the sale (1031 exchange, divorce, estate, relocation)? That informs how much negotiation room exists.
- Schools are D-rated, which usually means shorter tenancies and higher turnover. Who's the typical renter profile here, and what's been the actual vacancy rate?
- Crime grade is F in this area — have there been break-ins, vandalism, or insurance claims at this property in the last 3 years? What carrier currently insures it and at what premium?
- What's the average days-on-market for RENTAL listings here right now (not sales)? A rising rental-DOM trend means longer vacancies and softer asking-rent achievability than the comps imply.
- What's the recent tenant-quality profile in this submarket — average credit score on applications, eviction rate, late-payment / NSF rate, and stable-employment percentage? A property-management company in the area should have these aggregated.
- How much new for-sale + rental construction is in the pipeline within 1–3 miles? Heavy new supply typically softens prices + rents 12–24 months out; constrained supply supports both.
Investment metrics
- 1% rule
- 1.48% ✓
- Cap rate
- 13.08%
- Cash-on-cash
- 24.23%
- DSCR
- 2.08
- GRM
- 5.6
CMA / ARV
- ARV (on-the-fly)
- $63,650
- Comps found
- 12
Show comp detail 12 sales within ~0.75 mi
| Address | Dist | Beds/Ba | Sqft | Sold | Price | $/sf | Match |
|---|---|---|---|---|---|---|---|
| 2307 Woodland Ave | 0.17mi | 1/1.0 (-1) | 940 (-1%) | 7mo | $17,000 | $18 | 80 |
| 2504 Standard Ave | 0.34mi | 2/1.0 | 963 (+1%) | 7mo | $169,000 | $175 | 76 |
| 2306 Standard Ave | 0.27mi | 2/1.0 | 900 (-5%) | 4mo | $38,000 | $42 | 75 |
| 2130 W Gaulbert Ave | 0.50mi | 2/1.0 | 982 (+3%) | 3mo | $60,000 | $61 | 68 |
| 2645 Grand Ave | 0.56mi | 2/1.0 | 926 (-2%) | 3mo | $62,000 | $67 | 67 |
| 2108 Bolling Ave | 0.37mi | 3/1.0 (+1) | 1,011 (+6%) | 7mo | $52,000 | $51 | 62 |
| 1712 Saint Louis Ave | 0.31mi | 2/1.0 | 1,072 (+13%) | 4mo | $45,000 | $42 | 61 |
| 2615 Greenwood Ave | 0.59mi | 3/1.0 (+1) | 988 (+4%) | 3mo | $71,000 | $72 | 59 |
| 1320 S 17th St | 0.45mi | 3/2.0 (+1) | 1,003 (+6%) | 3mo | $118,000 | $118 | 58 |
| 1601 Prentice St | 0.72mi | 3/1.0 (+1) | 1,009 (+6%) | 1mo | $93,999 | $93 | 50 |
| 1714 Bolling Ave | 0.51mi | 3/2.0 (+1) | 1,068 (+12%) | 4mo | $110,000 | $103 | 43 |
| 848 S 23rd St | 0.72mi | 3/2.0 (+1) | 1,029 (+8%) | 6mo | $64,750 | $63 | 38 |
Match score weights: distance 35% · size 25% · config 20% · recency 20%. Top-matched comps best support the ARV.
Projected returns pro-forma
10.0% appreciation · 8.0% rent growth · sell at horizon
- IRR
- 45.2%
- Equity multiple
- 4.51×
- Total profit
- $68,697
- Equity at exit
- $62,971
- IRR
- 41.1%
- Equity multiple
- 11.02×
- Total profit
- $196,031
- Equity at exit
- $135,800
Cash invested: $19,572 (down + closing). Projections, not guarantees.
Landlord ↔ Tenant lean methodology
- Overall (STATE)
- 83 Strongly Landlord-Friendly
- State Kentucky
- 83 Strongly Landlord-Friendly · R+16
- County
- — inherits STATE
- City
- — inherits STATE
ZIP-level market 40210
- Home prices YoY
- 12.1%
- Rents YoY
- 8.1%
- Active inventory
- 91
- Price-to-rent
- 5.6×
Monthly cashflow live
- Estimated rent
- $1,036 high interval (Pro) →
- Mortgage (P&I)
- −$367
- Tax from tax record
- −$28 /mo · $333/yr
- Insurance
- −$29
- HOA
- −$0
- Vacancy / Maint / Mgmt
- −$218
- Net cashflow
- $395
Break-even live
UW: 25.0% down · 7.5% · 30yr · 1.5% tax · 5.0% vac · 8.0% maint · 8.0% mgmt
Financing live
Cash to close
- Down payment
- $17,475
- Closing costs
- $2,097
- Reserves months
- —
- Total cash needed
- —
Loan-product check · same deal, 3 products live
Conventional
25% down · 7.5% · 30yr
- Down + closing
- —
- Monthly P&I
- —
- Monthly cashflow
- —
- DSCR
- —
- Eligible?
- —
Personal DTI + credit; lowest rate.
DSCR
20% down · 8.5% · 30yr
- Down + closing
- —
- Monthly P&I
- —
- Monthly cashflow
- —
- DSCR
- —
- Eligible?
- —
No personal income docs; deal must DSCR.
Hard money
10% down · 12.0% · 12mo
- Down + closing
- —
- Monthly P&I
- —
- Monthly cashflow
- —
- DSCR
- —
- Eligible?
- —
Short-term bridge; refi at stabilization.
Rent comps 40 comps
| Address | Beds | Baths | Sqft | Rent | $/sqft | DOM | Units | Dist |
|---|---|---|---|---|---|---|---|---|
| 1854 W Ormsby Ave Louisville, KY | 2.0 | 2.0 | 1094 | $800 | $0.73 | 16d | 1 | 0.06mi |
| 1333 S 22nd St Louisville, KY | 2.0 | 1.0 | 744 | $1,200 | $1.61 | 23d | 1 | 0.06mi |
| 1710 Saint Louis Ave Louisville, KY | 2.0 | 1.0 | 720 | $1,000 | $1.39 | 3d | 1 | 0.31mi |
| 2614 Virginia Ave Louisville, KY | 2.0 | 1.0 | 975 | $925 | $0.95 | 23d | 1 | 0.37mi |
| 1842 Bolling Ave Louisville, KY | 1.0 | 1.0 | 900 | $895 | $0.99 | 14d | 1 | 0.39mi |
| 1349 Olive St Unit 3 Louisville, KY | 1.0 | 1.0 | 600 | $695 | $1.16 | 3d | 1 | 0.44mi |
| 1349 Olive St Unit 4 Louisville, KY | 1.0 | 1.0 | 600 | $725 | $1.21 | 23d | 1 | 0.44mi |
| 1349 Olive St Unit 4 Louisville, KY | 1.0 | 1.0 | 550 | $650 | $1.18 | 3d | 1 | 0.44mi |
| 1148 S 17th St Unit 2 Louisville, KY | 3.0 | 1.0 | 1000 | $895 | $0.90 | 23d | 1 | 0.45mi |
| 1305 S 17th St Louisville, KY | 2.0 | 1.0 | 750 | $950 | $1.27 | 23d | 1 | 0.48mi |
| 2706 Hale Ave Unit 1 Louisville, KY | 3.0 | 1.0 | 1100 | $1,400 | $1.27 | 23d | 1 | 0.48mi |
| 2706 Hale Ave Unit 2 Louisville, KY | 2.0 | 1.0 | 900 | $1,250 | $1.39 | 23d | 1 | 0.48mi |
| 1768 W Hill St Louisville, KY | 2.0 | 1.0 | 675 | $925 | $1.37 | 23d | 1 | 0.50mi |
| 1339 S 28th St Unit 3 Louisville, KY | 3.0 | 1.0 | 1125 | $1,175 | $1.04 | 20d | 1 | 0.50mi |
| 1792 W Gaulbert Ave Louisville, KY | 2.0 | 1.0 | 915 | $950 | $1.04 | 23d | 1 | 0.53mi |
| 2807 Dumesnil St Unit 101 Louisville, KY | 1.0 | 1.0 | 750 | $950 | $1.27 | 23d | 1 | 0.55mi |
| 1616 Gallagher St Louisville, KY | 3.0 | 1.5 | 1056 | $1,400 | $1.33 | 23d | 1 | 0.57mi |
| 1714 W Hill St Louisville, KY | 3.0 | 1.0 | 1050 | $1,045 | $1.00 | 23d | 1 | 0.57mi |
| 2708 Greenwood Ave Apt 1 Louisville, KY | 3.0 | 1.0 | 1100 | $1,300 | $1.18 | 23d | 1 | 0.61mi |
| 1708 W Gaulbert Ave Louisville, KY | 3.0 | 1.0 | 936 | $975 | $1.04 | 23d | 1 | 0.63mi |
| 2513 Date St Unit 2 Louisville, KY | 1.0 | 1.0 | 700 | $745 | $1.06 | 3d | 1 | 0.63mi |
| 2913 Dumesnil St Apt 3 Louisville, KY | 3.0 | 1.0 | 1112 | $740 | $0.67 | 10d | 1 | 0.64mi |
| 1644 W Kentucky St Unit 3 Louisville, KY | 3.0 | 1.0 | 900 | $950 | $1.06 | 23d | 1 | 0.66mi |
| 2400 Burwell Ave Louisville, KY | 2.0 | 1.0 | 972 | $895 | $0.92 | 16d | 1 | 0.66mi |
| 2710 W Kentucky St Apt 2 Louisville, KY | 3.0 | 1.0 | 1015 | $1,300 | $1.28 | 23d | 1 | 0.69mi |
| 848 S 23rd St Louisville, KY | 3.0 | 1.5 | 1050 | $1,450 | $1.38 | 23d | 1 | 0.70mi |
| 2821 Greenwood Ave #1 Louisville, KY | 3.0 | 1.0 | 1113 | $1,300 | $1.17 | 23d | 1 | 0.74mi |
| 1439 Beech St Apt 1 Louisville, KY | 3.0 | 1.5 | 1000 | $820 | $0.82 | 23d | 1 | 0.76mi |
| 1418 Beech St Unit 2 Louisville, KY | 2.0 | 1.0 | 1000 | $980 | $0.98 | 21d | 1 | 0.78mi |
| 2724 Garland Ave Unit 202 Louisville, KY | 2.0 | 1.0 | 950 | $745 | $0.78 | 3d | 1 | 0.78mi |
| 1816 Gregg Ave Louisville, KY | 2.0 | 2.0 | 773 | $1,100 | $1.42 | 16d | 1 | 0.79mi |
| 1836 Algonquin Pkwy Unit 2 Louisville, KY | 1.0 | 1.0 | 600 | $650 | $1.08 | 23d | 1 | 0.85mi |
| 1836 Algonquin Pkwy Unit 1 Louisville, KY | 1.0 | 1.0 | 650 | $650 | $1.00 | 14d | 1 | 0.85mi |
| 2706 Wyandotte Ave Louisville, KY | 2.0 | 1.0 | 756 | $1,295 | $1.71 | 3d | 1 | 0.92mi |
| 1443 S 32nd St Unit 2 Louisville, KY | 1.0 | 1.0 | 550 | $780 | $1.42 | 23d | 1 | 0.93mi |
| 3215 Virginia Ave Louisville, KY | 3.0 | 1.0 | 975 | $924 | $0.95 | 23d | 1 | 0.96mi |
| 2310 W Broadway Unit 1 Louisville, KY | 1.0 | 1.0 | 1100 | $975 | $0.89 | 3d | 1 | 0.97mi |
| 3122 W Kentucky St Louisville, KY | 3.0 | 1.0 | 1030 | $1,150 | $1.12 | 23d | 1 | 0.98mi |
| 1606 Algonquin Pkwy Unit 22 Louisville, KY | 2.0 | 1.0 | 626 | $750 | $1.20 | 23d | 1 | 0.98mi |
| 3004 Wyandotte Ave Louisville, KY | 2.0 | 1.0 | 700 | $1,200 | $1.71 | 16d | 1 | 1.06mi |
Listing history 19 events
-
2026-06-18days on market $69,900 Active 105 DOM
-
2026-06-17days on market $69,900 Active 104 DOM
-
2026-06-16days on market $69,900 Active 103 DOM
-
2026-06-15days on market $69,900 Active 102 DOM
-
2026-06-13days on market $69,900 Active 100 DOM
-
2026-06-10days on market $69,900 Active 97 DOM
-
2026-06-09days on market $69,900 Active 96 DOM
-
2026-06-08days on market $69,900 Active 95 DOM
-
2026-06-07days on market $69,900 Active 94 DOM
-
2026-06-03days on market $69,900 Active 90 DOM
-
2026-06-02days on market $69,900 Active 89 DOM
-
2026-06-01days on market $69,900 Active 88 DOM
-
2026-05-31days on market $69,900 Active 87 DOM
-
2026-03-05$69,900 Active
-
2009-01-08historical
-
2008-07-08$43,000
-
2007-07-07historical
-
2006-10-07$55,000
-
2004-09-08soldstatus $16,000
ⓘ Source: listings_history table (triggers on properties + properties_extension) + one-shot
backfill from property_details.listing_events for pre-trigger history.
Tax reassessment forecast KY · Resets to sale price
- Current annual tax
- $333 · $28/mo
- Projected year-2 tax
- $601 · $50/mo
- Expected delta
- +$268/yr (+$22/mo · 80.7%)
ⓘ Screening estimate from a state-policy table — verify with the county assessor before closing.
Climate risk First Street
- Flood 6/10 Major FEMA zone X (shaded) · 69% chance over 30 yrs
- Wildfire 1/10 Low
- Heat 5/10 Major 7 d/yr ≥105°F today · 19 d/yr by 30 yrs out
- Wind 2/10 Low 100% chance of damaging wind over 30 yrs
- Air quality 2/10 Low 1 unhealthy d/yr today · 3 by 30 yrs out
Nearby sold comps map
Loading sold comps map…
Walkable amenities ~0.75 mi
Loading nearby amenities…
Taxation est. · year 1
- Rental income
- $12,435
- − Mortgage interest
- −$3,915
- − Property taxes
- −$333
- − Insurance
- −$350
- − Repairs & maintenance
- −$995
- − Management
- −$995
- − Depreciation
- −$2,033
- Taxable income
- $3,814
- Est. tax owed @ 24.0%
- −$915
- After-tax cash flow
- $3,827/yr
For passive investors: Depreciation is non-cash, so a rental often shows a tax loss while cash-flowing — sheltering income. Rental losses are passive: they offset passive income freely, and up to $25,000/yr can offset ordinary (W-2) income if you actively participate and your MAGI is under $100k (phasing out to $0 by $150k); unused losses carry forward. On sale, claimed depreciation is recaptured at up to 25%, and gains may owe capital-gains tax (a 1031 exchange can defer both). Figures are a year-1 estimate at your 24.0% rate — not tax advice; consult a CPA.
Schools (NCES district)
- District
- Jefferson County
- NCES district ID
- 2102990
- Math proficiency
- 19% ▼ -17.00%
- Reading proficiency
- 35% ▼ -11.00%
- Median HH income
- $47,885
- Composite
- 23.45/100
- National rank
- #7884
- State rank
- #121 of 165 in KY
Livability — Louisville
- Score
- 63/100
- State rank
- #333
- US rank
- #15887
Category grades
Schools grade is shown separately in the Schools card above.
Census & demographics
- Census place
- Louisville, KY
- County
- Jefferson County · 790,184 people
- City population
- 769,292
- Metro
- Louisville/Jefferson County, KY-IN
- Population (ZIP)
- 13,518
- Household income
- $35,347
- Rent vs Own
- Severe rent burden
- 815.0
Population outlook (Jefferson County) Hauer SSP2
- Today (2025)
- 823,112 people
- By 2030
- 849,343 · +3.2%
- By 2040
- 895,696 · +8.8%
- By 2050
- 933,630 · +13.4%
- By 2075
- 1,028,262 · +24.9%
- By 2100
- 1,072,675 · +30.3%
Race, ethnicity, and origin ACS 2023
- Neighborhood character
- Predominantly Black (84%)
- Race & ethnicity
- Black 84% White 8% Two or more races 5% Hispanic / Latino 3%
- Common ancestry
- Iranian 1%
- Foreign-born
- 4% · Canada
- Languages at home
- 93% English-only · Spanish 3%
Political lean MEDSL · Jefferson
- 2024 margin
- D (+16.6) · D 57.4% · R 40.9% · Other 1.7%
- 2008→2024 swing
- +4.5pp toward D · 2008: 12.0pp · 2024: 16.6pp
- All cycles
- 2024: D+16.6 2020: D+20.1 2016: D+13.3 2012: D+11.1 2008: D+12.0
Not yet ingested
- Civics
- —
Market trends
- HPI YoY
- ▲ 28.45%
- Current HPI
- 264.0146
- Rent YoY
- ▲ 8.05%
- Metro
- Louisville/Jefferson County, KY-IN
- State GDP YoY
- ▲ 1.81%
- F500 in state
- 4
Industry mix (Fortune 500 HQ in KY)
| Industry | F500 HQs | Revenue |
|---|---|---|
| Healthcare | 1 | $118B |
|
||
| Food / Beverage | 1 | $7B |
|
||
Price history
+336.9% since first listed6 events — show timeline
- 2026-03-05 Listed $69,900 Metro Search MLS
- 2009-01-08 Listing Removed — Metro Search MLS
- 2008-07-08 Listed $43,000 Metro Search MLS
- 2007-07-07 Listing Removed — Metro Search MLS
- 2006-10-07 Listed $55,000 Metro Search MLS
- 2004-09-08 Sold (Public Records) $16,000 Public Records
Property tax history
+1.9%/yrLatest (2025): $333 · -1.9% YoY. Source: county tax records.
Cash-flow waterfall
monthlySold comps — $/sqft
last 12 mo · ≤1 miLoading sold comps…