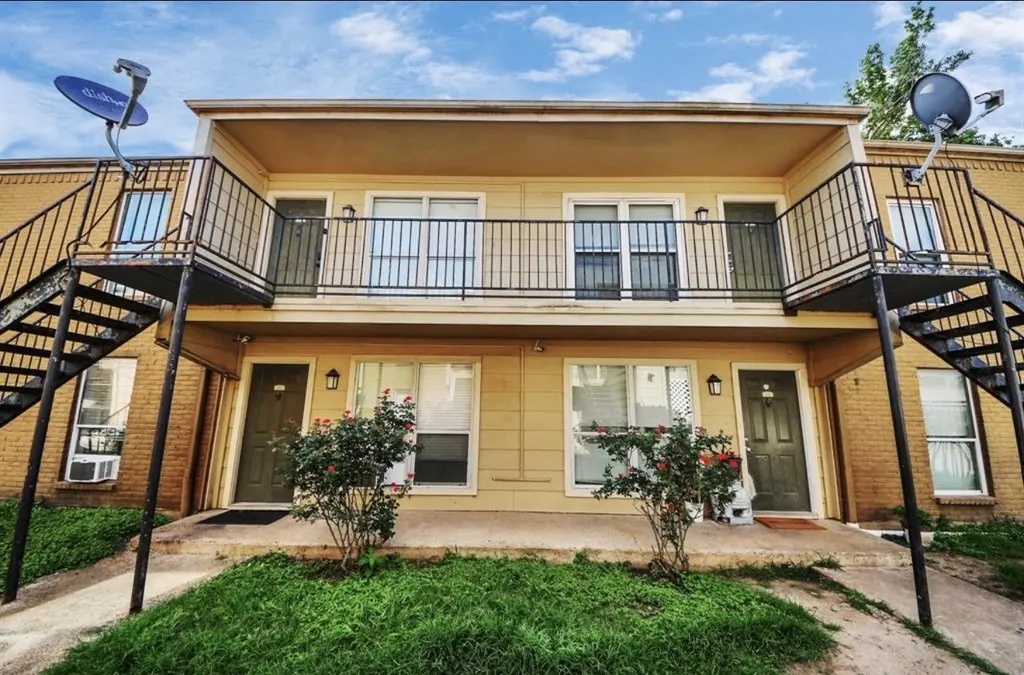
8100 Creekbend Dr #104 · Houston, TX
Flood risk 8/10 · Major
- FEMA flood zone
- X (unshaded)
- Chance of flooding over 30 yrs
- 0.99%
- Est. flood insurance / yr
- $507 – $1,088
Fire risk 1/10 · Minimal
- Est. fire insurance / yr
- $1,222 – $2,270
Heat risk 9/10 · Severe
- Hot days now (above 110°F)
- 7 days/yr
- Hot days in 30 yrs
- 23 days/yr
Wind risk 9/10 · Severe
- Chance of severe wind over 30 yrs
- 99.0%
Air-quality risk 2/10 · Minimal
- Unhealthy air days now
- 2 days/yr
- Unhealthy air days in 30 yrs
- 2 days/yr
Risk factors via First Street. Map © Google.
Why this score? — see what drove the D+ grade
The composite is a weighted blend of 9 inputs, each scored 0–100. Each bar is that input's sub-score; the figure is the points it added to the 100-point composite (weight × sub-score).
- Cash flow +17.9/30.0
- 1% rule +10.0/10.0
- DSCR +5.6/10.0
- Appreciation +4.6/10.0
- Livability +3.7/5.0
- Schools +2.7/10.0
- Condition / age +2.5/5.0
- Rent growth +2.1/5.0
- ARV discount +0.0/15.0
$90,000
🖨 Deal sheet (PDF) 📄 Offer letter ✓ Due diligence
Listing remarks
A well-maintained three-bedroom, two-bath condo offering strong investment potential. Currently tenant-occupied, this property provides immediate rental income. The unit features spacious bedrooms with walk-in closets, updated bathrooms with modern finishes, and a large living area with plenty of natural light. The layout is functional with easy-to-maintain flooring throughout. A private patio adds outdoor space, and the unit includes a washer, dryer, and refrigerator for added convenience. Located just minutes from the Galleria with quick access to Highway 59 and Beltway 8, this property offers easy access to shopping, dining, and major employment areas. Situated in a gated community with
Key facts
- Gated community
- Private patio
- Pool
Tags
Property features AI
Finance
- Other: Lot approximately 145,495 square feet
- Financial info: Lease not considered
- HOA & community: Braeswood Forest community; Monthly association fee of $328 (includes water and sewer); Community pool; Guarded community
Exterior
- Security: Guard at the community
- Utilities: Water included in association fee; Sewer included in association fee
- Home design: Residential property; Single-story; Built in 1976; Entry on slab foundation
- Construction: Construction materials: Unknown
- Exterior features: Community pool; Guarded community
Interior
- Kitchen: Electric cooktop; Electric oven; Refrigerator; Dishwasher not listed
- Bedrooms: 3 total rooms
- Bathrooms: 2 full bathrooms
- Heating & cooling: Central heating (gas); Central electric cooling
- Interior features: Dryer; Electric cooktop; Electric oven; Refrigerator; Washer
- Laundry & utility: Washer and dryer included
Neighborhood map
What this means for you Summary
Snapshot
- This is a 3-bed/2.0-bath condo listed at $90k.
Deal economics
- At list price, monthly cash flow is $10 ($115/yr) — positive.
- The deal already cash-flows at list — no discount required.
- Meets the 1% rule at list price ($1k rent vs $90k).
- Recommended offer: $87k (3.0% below list) — sets the bar for market timing.
- Cap rate 7.3% vs local median 3.2% in Houston — top-decile yield for the area; either an underpriced asset or a hidden risk that comps aren't pricing in. Stress-test before assuming the spread holds.
Location & tenants
- Location reads 74/100 on livability (#184 in TX, #4,771 nationally) — a middle-class / working-renter tenant base. Strengths: amenities A+, cost of living A+, housing A+; Watch: crime F.
- Houston ISD (urban): math 27% / reading 35% proficiency, ranked #593 of 826 in TX (top 72%) — families likely to look elsewhere, expect single-tenant / working-renter base with shorter leases; 71% free/reduced lunch — lower-income household profile, screen leases tightly.
- Zoned schools: Milne El (math 8% / reading 17%, grade F, #4,180 of 4,322 statewide, top 97%, 482 students, 94% FRL); Welch Middle (math 11% / reading 21%, grade F, #1,543 of 1,662 statewide, top 94%, 645 students, 97% FRL); Sharpstown H S (math 7% / reading 23%, grade F, #1,507 of 1,632 statewide, top 93%, 1,855 students, 89% FRL) — zoned schools average 93% FRL vs 71% district-wide (22 pts higher); higher-poverty schools than district average — tighter screening recommended.
- Zoned-school proficiency averages 14% at this address vs 31% district-wide (-17 pts) — the specific schools serving this property underperform the Houston ISD average; the district grade overstates school quality for this exact location.
- Market conditions: Rents soft (-1.5%/yr); 136 active listings in the ZIP; 40 comparable units currently listed for rent nearby; rentals at typical pace (median 26d on market — plan ~3-4 weeks tenant-placement turnaround); 29,883 units permitted in Harris County in 2024 (8,621 in 5+ unit buildings).
Forward outlook
- Local home prices are declining (-0.7%/yr); year-one equity from $622 of loan paydown is wiped out by about $654 of value loss. Plan a longer hold.
- Harris County population projected at +47% by 2050 — long-run rental-demand tailwind backs the buy-and-hold thesis.
Negotiation context
- It's been on market 47 days — a 3% lower offer ($87k) is reasonable based on typical stale-listing flexibility.
- 7 sale attempts since 10y ago with the ask held roughly flat each time — persistent listings suggest the price (not the market) is what's stuck; bring a comps-based counter.
Risks & watch-outs
- Watch-outs: flood insurance adds $66/mo; HOA is 24% of rent.
- Climate carrying-cost: severe flood risk; severe wind risk, 99% chance of damaging wind over 30y; extreme-heat days projected 7→23/yr by 2055 (HVAC capex compounding) — expect insurance premiums to compound above CPI over the hold.
Questions for the listing agent
- It's been on market 47 days. Have you received any prior offers? Is the seller open to a 3% concession, seller financing, or rate buy-down credit?
- Built in 1976 — when were the roof, HVAC, electrical panel, plumbing, and water heater last replaced?
- What's the actual annual flood-insurance premium (NFIP or private), and is the property in a SFHA with mandatory coverage?
- What does the HOA fee cover, when was the last increase, and are there any pending special assessments or reserve-fund shortfalls?
- Any open or pending special assessments — roof, HVAC, plumbing, elevator, façade? What's the per-unit balance and payoff schedule, and is the seller paying it off at close or rolling it to the buyer?
- Is there a deadline driving the sale (1031 exchange, divorce, estate, relocation)? That informs how much negotiation room exists.
- Schools are D-rated, which usually means shorter tenancies and higher turnover. Who's the typical renter profile here, and what's been the actual vacancy rate?
- Crime grade is F in this area — have there been break-ins, vandalism, or insurance claims at this property in the last 3 years? What carrier currently insures it and at what premium?
- The area grade is low — what's the realistic commute time and amenity access for the typical tenant pool here? Any planned neighborhood developments (good or bad) we should know about?
- What's the average days-on-market for RENTAL listings here right now (not sales)? A rising rental-DOM trend means longer vacancies and softer asking-rent achievability than the comps imply.
- What's the recent tenant-quality profile in this submarket — average credit score on applications, eviction rate, late-payment / NSF rate, and stable-employment percentage? A property-management company in the area should have these aggregated.
- How much new apartment / multifamily construction is in the pipeline within 1–3 miles? Heavy new supply (>2% of stock underway) typically softens rents 12–24 months out; light construction supports rent growth.
Investment metrics
- 1% rule
- 1.50% ✓
- Cap rate
- 7.31%
- Cash-on-cash
- 3.62%
- DSCR
- 1.16
- GRM
- 5.6
CMA / ARV
- ARV (median comp)
- $71,312
- List price
- $90,000
- Delta
- 26.21%
- Verdict
- OVERPRICED
- Comps
- 20 within 1.0 mi
Projected returns pro-forma
-0.73% appreciation · 0.0% rent growth · sell at horizon
- IRR
- -8.1%
- Equity multiple
- 0.65×
- Total profit
- $-8,725
- Equity at exit
- $22,908
- IRR
- -5.9%
- Equity multiple
- 0.51×
- Total profit
- $-12,448
- Equity at exit
- $25,079
Cash invested: $25,200 (down + closing). Projections, not guarantees.
Landlord ↔ Tenant lean methodology
- Overall (STATE)
- 87 Strongly Landlord-Friendly
- State Texas
- 87 Strongly Landlord-Friendly · R+5
- County
- — inherits STATE
- City
- — inherits STATE
ZIP-level market 77071
- Home prices YoY
- -0.3%
- Rents YoY
- -1.5%
- Active inventory
- 136
- Price-to-rent
- 5.6×
Monthly cashflow live
- Estimated rent
- $1,351 high interval (Pro) →
- Mortgage (P&I)
- −$472
- Tax from tax record
- −$154 /mo · $1,843/yr
- Insurance
- −$38
- Flood insurance flood zone
- −$66 /mo · $798/yr
- HOA
- −$328
- Vacancy / Maint / Mgmt
- −$284
- Net cashflow
- $10
Break-even live
Sensitivity live
| Price | -10% $61 | -5% $35 | +0% $10 | +5% $-16 | +10% $-41 |
|---|---|---|---|---|---|
| Rent | -10% $-97 | -5% $-44 | +0% $10 | +5% $63 | +10% $116 |
| Rate | -1.0pp $55 | -0.5pp $32 | base $10 | +0.5pp $-14 | +1.0pp $-37 |
UW: 25.0% down · 7.5% · 30yr · 1.5% tax · 5.0% vac · 8.0% maint · 8.0% mgmt
Financing live
Cash to close
- Down payment
- $22,500
- Closing costs
- $2,700
- Reserves months
- —
- Total cash needed
- —
Loan-product check · same deal, 3 products live
Conventional
25% down · 7.5% · 30yr
- Down + closing
- —
- Monthly P&I
- —
- Monthly cashflow
- —
- DSCR
- —
- Eligible?
- —
Personal DTI + credit; lowest rate.
DSCR
20% down · 8.5% · 30yr
- Down + closing
- —
- Monthly P&I
- —
- Monthly cashflow
- —
- DSCR
- —
- Eligible?
- —
No personal income docs; deal must DSCR.
Hard money
10% down · 12.0% · 12mo
- Down + closing
- —
- Monthly P&I
- —
- Monthly cashflow
- —
- DSCR
- —
- Eligible?
- —
Short-term bridge; refi at stabilization.
Rent comps 40 comps
| Address | Beds | Baths | Sqft | Rent | $/sqft | DOM | Units | Dist |
|---|---|---|---|---|---|---|---|---|
| 8110 Creekbend Dr Apt 305 Houston, TX | 3.0 | 1.5 | 747 | $1,007 | $1.35 | 26d | 1 | 0.16mi |
| 8110 Creekbend Dr Apt 115 Houston, TX | 2.0 | 1.0 | 850 | $1,181 | $1.39 | 26d | 1 | 0.16mi |
| 8110 Creekbend Dr Unit 113 Houston, TX | 2.0 | 2.0 | 915 | $1,260 | $1.38 | 26d | 1 | 0.16mi |
| 8243 Creekbend Dr Houston, TX | 2.0 | 2.0 | 1150 | $1,350 | $1.17 | 26d | 1 | 0.22mi |
| 7900 Creekbend Dr Houston, TX | 2.0 | 2.0 | 1000 | $1,065 | $1.06 | 45d | 1 | 0.27mi |
| 10965 S Gessner Rd Houston, TX | 2.0 | 2.0 | 1322 | $1,229 | $0.93 | 18d | 1 | 0.45mi |
| 10222 S Gessner Rd Unit 2112 Houston, TX | 2.0 | 2.0 | 910 | $1,064 | $1.17 | 0d | 1 | 0.47mi |
| 10222 S Gessner Rd Unit 422 Houston, TX | 2.0 | 2.0 | 910 | $1,080 | $1.19 | 9d | 1 | 0.47mi |
| 10222 S Gessner Rd Unit 2162 Houston, TX | 2.0 | 2.0 | 910 | $1,080 | $1.19 | 7d | 1 | 0.47mi |
| 10222 S Gessner Rd Houston, TX | 2.0 | 2.0 | 1030 | $1,239 | $1.20 | 45d | 1 | 0.49mi |
| 10965 S Gessner Rd Unit 1110 Houston, TX | 2.0 | 2.0 | 1322 | $1,229 | $0.93 | 26d | 1 | 0.51mi |
| 9600 Braes Bayou Dr Houston, TX | 1.0–2.0 | 1.0–2.0 | 950 | $1,029 | $1.08 | 1d | 10 | 0.61mi |
| 8700 Gustine Ln Houston, TX | 1.0–2.0 | 1.0–2.0 | 752 | $1,004 | $1.33 | 1d | 27 | 0.68mi |
| 8700 Gustine Ln Houston, TX | 1.0–2.0 | 1.0–2.0 | 752 | $1,035 | $1.38 | 45d | 20 | 0.68mi |
| 9707 S Gessner Rd Houston, TX | 2.0 | 1.0–2.0 | 726 | $1,189 | $1.64 | 1d | 75 | 0.70mi |
| 8201 W Bellfort Ave Unit 2162 Houston, TX | 2.0 | 2.0 | 848 | $955 | $1.13 | 7d | 1 | 0.74mi |
| 8201 W Bellfort Ave Unit 422 Houston, TX | 2.0 | 2.0 | 848 | $955 | $1.13 | 9d | 1 | 0.74mi |
| 8201 W Bellfort Ave Unit 510 Houston, TX | 3.0 | 2.0 | 1203 | $1,149 | $0.96 | 0d | 1 | 0.74mi |
| 10750 Westbrae Pkwy Unit 2165 Houston, TX | 2.0 | 2.0 | 838 | $1,119 | $1.34 | 0d | 1 | 0.75mi |
| 10750 Westbrae Pkwy Unit 422 Houston, TX | 2.0 | 2.0 | 838 | $1,135 | $1.35 | 9d | 1 | 0.75mi |
| 10750 Westbrae Pkwy Unit 10807 Houston, TX | 2.0 | 2.0 | 838 | $1,159 | $1.38 | 12d | 1 | 0.75mi |
| 8207 W Bellfort Ave Houston, TX | 2.0 | 2.0 | 982 | $990 | $1.01 | 20d | 1 | 0.75mi |
| 8207 W Bellfort Ave Houston, TX | 2.0 | 2.0 | 982 | $990 | $1.01 | 45d | 1 | 0.75mi |
| 10750 Westbrae Pkwy Unit 2047 Houston, TX | 2.0 | 2.0 | 838 | $1,159 | $1.38 | 5d | 1 | 0.75mi |
| 10756 Westbrae Pkwy Houston, TX | 2.0 | 2.0 | 838 | $1,145 | $1.37 | 45d | 1 | 0.76mi |
| 8888 Benning Dr Houston, TX | 3.0 | 3.0 | 1472 | $1,750 | $1.19 | 45d | 1 | 0.77mi |
| 7809 Wolfield Ln Houston, TX | 2.0 | 2.0 | 1208 | $1,390 | $1.15 | 45d | 1 | 0.83mi |
| 9707 Braeburn Glen Blvd Houston, TX | 1.0–3.0 | 1.0–2.0 | 905 | $1,330 | $1.47 | 9d | 15 | 0.89mi |
| 10919 Fondren Rd Houston, TX | 2.0 | 2.0 | 1250 | $1,400 | $1.12 | 45d | 1 | 0.90mi |
| 10919 Fondren Rd Apt 422 Houston, TX | 2.0 | 2.0 | 920 | $1,035 | $1.12 | 9d | 1 | 0.90mi |
| 10919 Fondren Rd Unit 10952 Houston, TX | 3.0 | 2.0 | 1287 | $1,299 | $1.01 | 0d | 1 | 0.90mi |
| 10007 Larkwood Dr Houston, TX | 3.0 | 2.0 | 1263 | $1,349 | $1.07 | 45d | 1 | 0.95mi |
| 10402 Sandpiper Dr Apt 220 Houston, TX | 3.0 | 2.0 | 1175 | $1,482 | $1.26 | 26d | 1 | 0.97mi |
| 10402 Sandpiper Dr Unit 10435 Houston, TX | 3.0 | 2.0 | 1175 | $1,496 | $1.27 | 12d | 1 | 0.97mi |
| 10402 Sandpiper Dr Unit 11-156 Houston, TX | 2.0 | 1.0 | 865 | $999 | $1.15 | 26d | 1 | 0.97mi |
| 10402 Sandpiper Dr Houston, TX | 1.0–3.0 | 1.0–2.0 | 769 | $1,403 | $1.82 | 1d | 24 | 0.98mi |
| 8901 Bissonnet St Unit 038 Houston, TX | 2.0 | 1.0 | 950 | $800 | $0.84 | 45d | 1 | 0.98mi |
| 8901 Bissonnet St Unit 129 Houston, TX | 2.0 | 1.0 | 750 | $740 | $0.99 | 45d | 1 | 0.98mi |
| 8901 Bissonnet St Apt 253 Houston, TX | 2.0 | 2.0 | 1100 | $900 | $0.82 | 45d | 1 | 0.98mi |
| 8901 Bissonnet St Unit 068 Houston, TX | 2.0 | 2.0 | 1175 | $950 | $0.81 | 45d | 1 | 0.98mi |
HOA detail condo
- Monthly dues
- $328 · $3,936/yr
- Likely covers
- security
- Assessments
- None detected in remarks — confirm with the listing agent.
Listing history 30 events
-
2026-06-21days on market $90,000 Active 47 DOM
-
2026-06-18days on market $90,000 Active 44 DOM
-
2026-06-17days on market $90,000 Active 43 DOM
-
2026-06-16days on market $90,000 Active 42 DOM
-
2026-06-15days on market $90,000 Active 41 DOM
-
2026-06-13days on market $90,000 Active 39 DOM
-
2026-06-10days on market $90,000 Active 35 DOM
-
2026-06-08days on market $90,000 Active 34 DOM
-
2026-06-07days on market $90,000 Active 33 DOM
-
2026-06-04days on market $90,000 Active 30 DOM
-
2026-06-01days on market $90,000 Active 27 DOM
-
2026-05-31days on market $90,000 Active 26 DOM
-
2026-05-05$90,000 Active 746-char remark
-
2026-04-30historical
-
2026-01-11$90,000 Active
-
2025-11-30historical
-
2025-08-01$100,000 Active
-
2025-07-28historical $1,350
-
2025-07-08$1,350
-
2025-06-27historical
-
2025-06-03$110,000 Active
-
2024-02-26soldstatus Sold
-
2024-02-26soldstatus
-
2024-02-12status Pending
-
2024-02-02$75,000 Active
-
2016-08-29soldstatus
-
2016-08-26soldstatus Sold
-
2016-08-06status Pending
-
2016-07-30status Option Pending
-
2016-07-21$45,000 Active
ⓘ Source: listings_history table (triggers on properties + properties_extension) + one-shot
backfill from property_details.listing_events for pre-trigger history.
Tax reassessment forecast TX · Resets to sale price
- Current annual tax
- $1,843 · $154/mo
- Projected year-2 tax
- $1,843 · $154/mo
- Expected delta
- $0/yr ($0/mo · 0.0%)
ⓘ Screening estimate from a state-policy table — verify with the county assessor before closing.
Climate risk First Street
- Flood 8/10 Severe FEMA zone X (unshaded) · 99% chance over 30 yrs
- Wildfire 1/10 Low
- Heat 9/10 Extreme 7 d/yr ≥110°F today · 23 d/yr by 30 yrs out
- Wind 9/10 Extreme 99% chance of damaging wind over 30 yrs
- Air quality 2/10 Low 2 unhealthy d/yr today · 2 by 30 yrs out
Nearby sold comps map
Loading sold comps map…
Walkable amenities ~0.75 mi
Loading nearby amenities…
Taxation est. · year 1
- Rental income
- $16,209
- − Mortgage interest
- −$5,041
- − Property taxes
- −$1,843
- − Insurance
- −$1,248
- − Repairs & maintenance
- −$1,297
- − Management
- −$1,297
- − HOA
- −$3,936
- − Depreciation
- −$2,618
- Taxable loss
- −$1,071
- Est. tax savings @ 24.0%
- +$257
- After-tax cash flow
- $372/yr
For passive investors: Depreciation is non-cash, so a rental often shows a tax loss while cash-flowing — sheltering income. Rental losses are passive: they offset passive income freely, and up to $25,000/yr can offset ordinary (W-2) income if you actively participate and your MAGI is under $100k (phasing out to $0 by $150k); unused losses carry forward. On sale, claimed depreciation is recaptured at up to 25%, and gains may owe capital-gains tax (a 1031 exchange can defer both). Figures are a year-1 estimate at your 24.0% rate — not tax advice; consult a CPA.
Schools (NCES district)
- District
- Houston ISD
- NCES district ID
- 4823640
- Math proficiency
- 27% ▼ -18.00%
- Reading proficiency
- 35% ▼ -6.00%
- Median HH income
- $46,054
- Composite
- 26.63/100
- National rank
- #7173
- State rank
- #593 of 826 in TX
Livability — Houston
- Score
- 74/100
- State rank
- #184
- US rank
- #4771
Category grades
Schools grade is shown separately in the Schools card above.
Census & demographics
- Census place
- Houston, TX
- County
- Harris County · 4,702,590 people
- City population
- 3,226,434
- Metro
- Houston-The Woodlands-Sugar Land, TX
- Population (ZIP)
- 27,056
- Household income
- $54,139
- Rent vs Own
- Severe rent burden
- 1242.0
Population outlook (Harris County) Hauer SSP2
- Today (2025)
- 5,571,493 people
- By 2030
- 6,089,821 · +9.3%
- By 2040
- 7,142,806 · +28.2%
- By 2050
- 8,185,864 · +46.9%
- By 2075
- 10,574,329 · +89.8%
- By 2100
- 12,109,958 · +117.4%
Race, ethnicity, and origin ACS 2023
- Neighborhood character
- Diverse neighborhood (Simpson 0.69)
- Race & ethnicity
- Black 46% Hispanic / Latino 26% White 17% Two or more races 8% Asian 7%
- Hispanic origin (detail)
- Mexican 13%
- Common ancestry
- Romanian 2% Scotch-Irish 1% Lithuanian 1%
- Foreign-born
- 33% · Canada, Vietnam, China
- Languages at home
- 58% English-only · Spanish 25% Vietnamese 3% Chinese 2%
Political lean MEDSL · Harris
- 2024 margin
- Lean D (+5.5) · D 52.0% · R 46.4% · Other 1.6%
- 2008→2024 swing
- +3.9pp toward D · 2008: 1.6pp · 2024: 5.5pp
- All cycles
- 2024: D+5.5 2020: D+13.3 2016: D+12.4 2012: D+0.1 2008: D+1.6
Not yet ingested
- Civics
- —
Market trends
- HPI YoY
- ▼ -0.73%
- Current HPI
- 250.0788
- Rent YoY
- ▼ -1.51%
- Metro
- Houston-The Woodlands-Sugar Land, TX
- State GDP YoY
- ▲ 3.95%
- F500 in state
- 110
Industry mix (Fortune 500 HQ in TX)
| Industry | F500 HQs | Revenue |
|---|---|---|
| Energy | 16 | $1,198B |
|
||
| Technology | 5 | $198B |
|
||
| Engineering / Construction | 4 | $72B |
|
||
| Energy Services | 3 | $60B |
|
||
| Utilities | 3 | $41B |
|
||
| Healthcare | 2 | $330B |
|
||
Price history
+100.0% since first listed18 events — show timeline
- 2026-05-05 Listed $90,000 HARMLS
- 2026-04-30 Listing Removed — HARMLS
- 2026-01-11 Listed $90,000 HARMLS
- 2025-11-30 Listing Removed — HARMLS
- 2025-08-01 Listed $100,000 HARMLS
- 2025-07-28 Rental Removed $1,350 HARMLS
- 2025-07-08 Listed for Rent $1,350 HARMLS
- 2025-06-27 Listing Removed — HARMLS
- 2025-06-03 Listed $110,000 HARMLS
- 2024-02-26 Sold (Public Records) — Public Records
- 2024-02-26 Sold (MLS) — HARMLS
- 2024-02-12 Pending — HARMLS
- 2024-02-02 Listed $75,000 HARMLS
- 2016-08-29 Sold (Public Records) — Public Records
- 2016-08-26 Sold (MLS) — HARMLS
- 2016-08-06 Pending — HARMLS
- 2016-07-30 Pending — HARMLS
- 2016-07-21 Listed $45,000 HARMLS
Property tax history
+4.0%/yrLatest (2025): $1,843 · +6.2% YoY. Source: county tax records.
Cash-flow waterfall
monthlySold comps — $/sqft
last 12 mo · ≤1 miLoading sold comps…