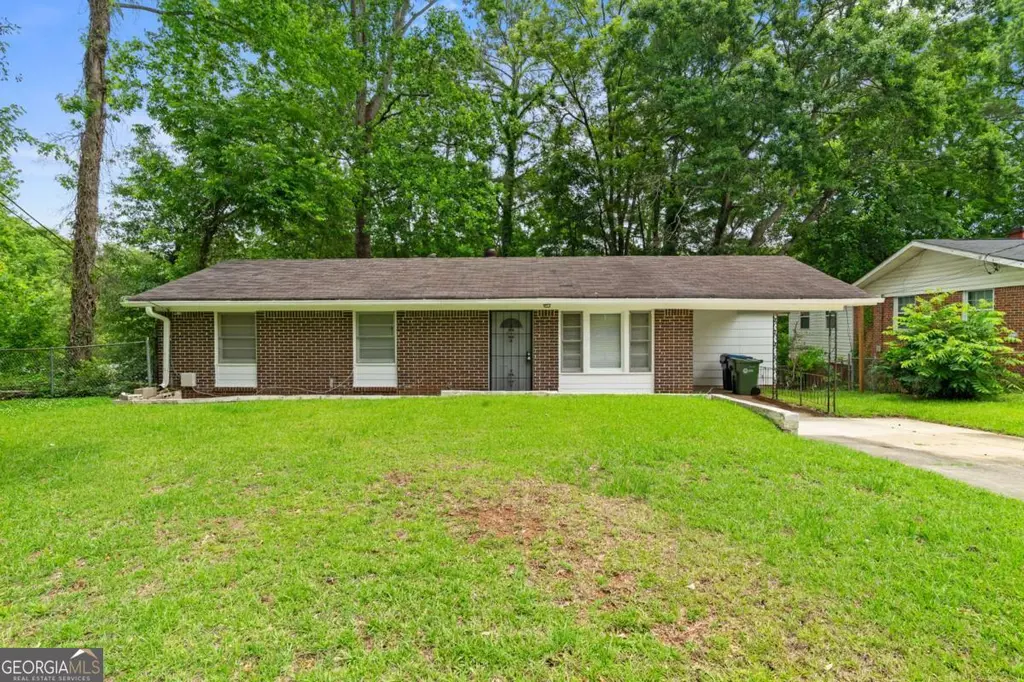
3236 Renault Rd SE · Atlanta, GA
Flood risk 1/10 · Minimal
- FEMA flood zone
- X (unshaded)
- Chance of flooding over 30 yrs
- 0.0%
- Est. flood insurance / yr
- $473 – $860
Fire risk 1/10 · Minimal
- Est. fire insurance / yr
- $963 – $1,789
Heat risk 5/10 · Moderate
- Hot days now (above 104°F)
- 7 days/yr
- Hot days in 30 yrs
- 18 days/yr
Wind risk 6/10 · Moderate
- Chance of severe wind over 30 yrs
- 27.0%
Air-quality risk 4/10 · Minor
- Unhealthy air days now
- 4 days/yr
- Unhealthy air days in 30 yrs
- 6 days/yr
Risk factors via First Street. Map © Google.
Why this score? — see what drove the C grade
The composite is a weighted blend of 9 inputs, each scored 0–100. Each bar is that input's sub-score; the figure is the points it added to the 100-point composite (weight × sub-score).
- Cash flow +21.0/30.0
- ARV discount +9.7/15.0
- DSCR +6.7/10.0
- 1% rule +5.9/10.0
- Livability +4.2/5.0
- Rent growth +3.9/5.0
- Schools +2.7/10.0
- Condition / age +2.5/5.0
- Appreciation +0.0/10.0
$159,900
🖨 Deal sheet (PDF) 📄 Offer letter ✓ Due diligence
Listing remarks MLS
Charming 3-bedroom, 2-bath brick ranch ideally located near the airport, major highways, and just 8 minutes from the vibrant downtown Hapeville district, where you'll enjoy local breweries, restaurants, coffee shops, and community events. This well-maintained home offers comfortable one-level living with beautiful hardwood flooring and recently upgraded flooring throughout. All flooring has been upgraded or replaced in 2026, giving the home a fresh, modern feel. The inviting living room features newly added remote-controlled wireless lighting, creating both convenience and ambiance. Major system updates provide peace of mind, including a new HVAC system installed in 2024 and a main plumbing pipe upgrade completed in 2025. The functional floor plan offers comfortable living spaces, while the fully fenced backyard provides plenty of room for pets, play, gardening, or entertaining. Surrounded by mature trees, the private wooded backyard creates a peaceful retreat, and the large storage shed offers excellent space for tools, lawn equipment, and additional storage. Whether you're a first-time homebuyer, downsizing, or looking for an investment opportunity, this move-in-ready home combines thoughtful updates, practical features, and an unbeatable location. Enjoy easy access to Hartsfield-Jackson Airport, major highways, Downtown Atlanta, shopping, dining, and entertainment while coming home to your own private backyard oasis.
Key facts
- Coffee shops
- Local breweries
- Restaurants
Tags
Property features AI
Exterior
- Parking: Attached covered carport (1 car); Driveway parking; Open parking available
- Utilities: Public water; Public sewer; Electric service available; Cable available; Phone service available
- Home design: One level (single-story); Brick construction; Composition/shingle roof
- Construction: Brick exterior; Shingle/composition roof; Outdoor storage/shed
- Exterior features: Private yard; Rain gutters; Backyard chain-link fence; Shed(s) / exterior storage
Interior
- Kitchen: White cabinets with stone countertops; Electric oven; Refrigerator
- Bedrooms: 3 main-level bedrooms; Primary suite on the main level
- Flooring: Hardwood flooring; Vinyl flooring
- Bathrooms: 2 full bathrooms; Primary bathroom with shower (no tub)
- Heating & cooling: Central heating; Central air conditioning
- Interior features: Entrance foyer; No shared/common walls; Open-concept dining area; Living room
- Laundry & utility: Laundry located in kitchen; 220V outlet in laundry area
Neighborhood map
What this means for you Summary
Snapshot
- This is a 3-bed/1.0-bath single-family listed at $160k.
Deal economics
- At list price, monthly cash flow is $225 ($3k/yr) — positive.
- The deal already cash-flows at list — no discount required.
- Meets the 1% rule at list price ($2k rent vs $160k).
- Cap rate 8.0% vs local median 3.1% in Atlanta — top-decile yield for the area; either an underpriced asset or a hidden risk that comps aren't pricing in. Stress-test before assuming the spread holds.
Location & tenants
- Location reads 83/100 on livability (#6 in GA, #919 nationally) — a professional / high-income tenant draw. Strengths: amenities A+, commute A+, housing A+; Watch: cost of living C-.
- Atlanta Public Schools (urban): math 28% / reading 35% proficiency, ranked #80 of 174 in GA (top 46%) — families likely to look elsewhere, expect single-tenant / working-renter base with shorter leases; 71% free/reduced lunch — lower-income household profile, screen leases tightly.
- Zoned schools: Heritage Academy Elementary School (math 5% / reading 8%, grade F, #1,153 of 1,228 statewide, top 94%, 398 students, 100% FRL); Crawford Long Middle School (math 2% / reading 8%, grade F, #462 of 470 statewide, top 99%, 705 students, 100% FRL); South Atlanta High School (math 2% / reading 12%, grade F, #385 of 424 statewide, top 92%, 928 students, 100% FRL) — zoned schools average 100% FRL vs 71% district-wide (29 pts higher); higher-poverty schools than district average — tighter screening recommended.
- Zoned-school proficiency averages 6% at this address vs 32% district-wide (-25 pts) — the specific schools serving this property underperform the Atlanta Public Schools average; the district grade overstates school quality for this exact location.
- Market conditions: Rents rising fast (+5.5%/yr); 179 active listings in the ZIP; 28 comparable units currently listed for rent nearby; rentals at typical pace (median 18d on market — plan ~3-4 weeks tenant-placement turnaround); 11,565 units permitted in Fulton County in 2024 (8,159 in 5+ unit buildings).
- This rent runs 33% of the median local income ($63k/yr) — at the standard rent-burdened threshold; future hikes will face affordability resistance.
Forward outlook
- Local home prices are declining (-3.0%/yr); year-one equity from $1k of loan paydown is wiped out by about $5k of value loss. Plan a longer hold.
- Fulton County population projected at +38% by 2050 — long-run rental-demand tailwind backs the buy-and-hold thesis.
Negotiation context
- Only 6 days on market — expect competitive offers; lowballing is unlikely to land.
- 16 sale attempts since 17y ago with the ask held roughly flat each time — persistent listings suggest the price (not the market) is what's stuck; bring a comps-based counter.
Risks & watch-outs
- Climate carrying-cost: major wind risk, 27% chance of damaging wind over 30y; extreme-heat days projected 7→18/yr by 2055 (HVAC capex compounding) — expect insurance premiums to compound above CPI over the hold.
Questions for the listing agent
- Built in 1961 — when were the roof, HVAC, electrical panel, plumbing, and water heater last replaced?
- Is there a deadline driving the sale (1031 exchange, divorce, estate, relocation)? That informs how much negotiation room exists.
- What's the average days-on-market for RENTAL listings here right now (not sales)? A rising rental-DOM trend means longer vacancies and softer asking-rent achievability than the comps imply.
- What's the recent tenant-quality profile in this submarket — average credit score on applications, eviction rate, late-payment / NSF rate, and stable-employment percentage? A property-management company in the area should have these aggregated.
- How much new for-sale + rental construction is in the pipeline within 1–3 miles? Heavy new supply typically softens prices + rents 12–24 months out; constrained supply supports both.
Investment metrics
- 1% rule
- 1.09% ✓
- Cap rate
- 7.98%
- Cash-on-cash
- 6.04%
- DSCR
- 1.27
- GRM
- 7.6
CMA / ARV
- ARV (on-the-fly)
- $168,168
- Comps found
- 12
Show comp detail 12 sales within ~0.75 mi
| Address | Dist | Beds/Ba | Sqft | Sold | Price | $/sf | Match |
|---|---|---|---|---|---|---|---|
| 408 Belgarde Pl SE | 0.15mi | 3/2.0 | 1,150 (+0%) | 7mo | $210,000 | $183 | 82 |
| 385 Macedonia Rd SE | 0.23mi | 3/1.0 | 1,000 (-13%) | 1mo | $147,000 | $147 | 68 |
| 3242 Browns Mill Rd SE | 0.13mi | 3/1.5 | 1,000 (-13%) | 4mo | $141,000 | $141 | 68 |
| 408 Macedonia Rd SE | 0.21mi | 3/1.0 | 1,000 (-13%) | 4mo | $100,000 | $100 | 66 |
| 416 Macedonia Rd SE | 0.22mi | 4/1.0 (+1) | 1,000 (-13%) | 1mo | $130,000 | $130 | 63 |
| 3382 Renault Rd | 0.29mi | 3/1.0 | 1,000 (-13%) | 5mo | $96,500 | $97 | 61 |
| 442 Cologne Dr SE | 0.38mi | 3/1.0 | 1,000 (-13%) | 6mo | $155,000 | $155 | 56 |
| 398 Cologne Dr SE | 0.31mi | 3/2.0 | 1,000 (-13%) | 5mo | $170,000 | $170 | 56 |
| 3330 Villa Cir | 0.53mi | 3/1.0 | 1,000 (-13%) | 8mo | $153,000 | $153 | 48 |
| 500 Hutchens Rd SE | 0.51mi | 2/1.0 (-1) | 1,008 (-12%) | 6mo | $90,000 | $89 | 46 |
| 3508 Ruby H Harper Blvd SE | 0.55mi | 3/2.0 | 1,000 (-13%) | 5mo | $219,990 | $220 | 45 |
| 3309 Ward Dr SW | 0.70mi | 2/1.0 (-1) | 1,066 (-7%) | 8mo | $75,000 | $70 | 44 |
Match score weights: distance 35% · size 25% · config 20% · recency 20%. Top-matched comps best support the ARV.
Projected returns pro-forma
-3.0% appreciation · 5.45% rent growth · sell at horizon
- IRR
- -4.1%
- Equity multiple
- 0.84×
- Total profit
- $-7,108
- Equity at exit
- $23,842
- IRR
- 8.3%
- Equity multiple
- 1.70×
- Total profit
- $31,502
- Equity at exit
- $13,825
Cash invested: $44,772 (down + closing). Projections, not guarantees.
Landlord ↔ Tenant lean methodology
- Overall (STATE)
- 90 Strongly Landlord-Friendly
- State Georgia
- 90 Strongly Landlord-Friendly · R+3
- County
- — inherits STATE
- City
- — inherits STATE
ZIP-level market 30354
- Home prices YoY
- -17.5%
- Rents YoY
- 5.5%
- Active inventory
- 179
- Price-to-rent
- 7.6×
Monthly cashflow live
- Estimated rent
- $1,743 high interval (Pro) →
- Mortgage (P&I)
- −$839
- Tax from tax record
- −$247 /mo · $2,962/yr
- Insurance
- −$67
- HOA
- −$0
- Vacancy / Maint / Mgmt
- −$366
- Net cashflow
- $225
Break-even live
Sensitivity live
| Price | -10% $316 | -5% $270 | +0% $225 | +5% $180 | +10% $135 |
|---|---|---|---|---|---|
| Rent | -10% $88 | -5% $156 | +0% $225 | +5% $294 | +10% $363 |
| Rate | -1.0pp $306 | -0.5pp $266 | base $225 | +0.5pp $184 | +1.0pp $142 |
UW: 25.0% down · 7.5% · 30yr · 1.5% tax · 5.0% vac · 8.0% maint · 8.0% mgmt
Financing live
Cash to close
- Down payment
- $39,975
- Closing costs
- $4,797
- Reserves months
- —
- Total cash needed
- —
Loan-product check · same deal, 3 products live
Conventional
25% down · 7.5% · 30yr
- Down + closing
- —
- Monthly P&I
- —
- Monthly cashflow
- —
- DSCR
- —
- Eligible?
- —
Personal DTI + credit; lowest rate.
DSCR
20% down · 8.5% · 30yr
- Down + closing
- —
- Monthly P&I
- —
- Monthly cashflow
- —
- DSCR
- —
- Eligible?
- —
No personal income docs; deal must DSCR.
Hard money
10% down · 12.0% · 12mo
- Down + closing
- —
- Monthly P&I
- —
- Monthly cashflow
- —
- DSCR
- —
- Eligible?
- —
Short-term bridge; refi at stabilization.
Rent comps 28 comps
| Address | Beds | Baths | Sqft | Rent | $/sqft | DOM | Units | Dist |
|---|---|---|---|---|---|---|---|---|
| 324 Macedonia Rd SE Atlanta, GA | 3.0 | 1.0 | 1000 | $1,295 | $1.29 | 9d | 1 | 0.18mi |
| 382 Cologne Dr SE Atlanta, GA | 3.0 | 1.0 | 1100 | $1,400 | $1.27 | 0d | 1 | 0.29mi |
| 331 Simca St SE Atlanta, GA | 3.0 | 1.0 | 1000 | $1,700 | $1.70 | 4d | 1 | 0.36mi |
| 3188 Ward Dr SW Atlanta, GA | 3.0 | 1.5 | 1025 | $1,800 | $1.76 | 13d | 1 | 0.50mi |
| 500 Hutchens Rd SE Atlanta, GA | 4.0 | 2.0 | 1248 | $2,400 | $1.92 | 18d | 1 | 0.51mi |
| 210 Oak Dr SE Atlanta, GA | 3.0 | 2.0 | 1330 | $1,400 | $1.05 | 26d | 1 | 0.51mi |
| 167 Alyson Ct SE Atlanta, GA | 4.0 | 2.0 | 1344 | $1,825 | $1.36 | 26d | 1 | 0.54mi |
| 633 Sandys Ln SE Atlanta, GA | 3.0 | 2.0 | 1314 | $1,950 | $1.48 | 7d | 1 | 0.61mi |
| 445 Cleveland Ave SE Atlanta, GA | 2.0–3.0 | 1.0–2.0 | 1014 | $1,591 | $1.57 | 3d | 13 | 0.87mi |
| 2694 Fairlane Dr SE Atlanta, GA | 4.0 | 2.0 | 1372 | $2,800 | $2.04 | 26d | 1 | 0.99mi |
| 3054 Waters Rd SW Atlanta, GA | 3.0 | 1.0 | 891 | $1,800 | $2.02 | 9d | 1 | 1.10mi |
| 3066 Waters Rd SW Atlanta, GA | 3.0 | 1.0 | 1144 | $1,395 | $1.22 | 21d | 1 | 1.11mi |
| 837 Forrest Cir SE Atlanta, GA | 3.0 | 2.0 | 1500 | $1,845 | $1.23 | 26d | 1 | 1.16mi |
| 2786 Old Hapeville Rd SW Atlanta, GA | 2.0 | 1.5 | 1050 | $1,150 | $1.10 | 26d | 1 | 1.17mi |
| 1006 Hutchens Rd SE Atlanta, GA | 3.0 | 2.0 | 881 | $2,800 | $3.18 | 26d | 1 | 1.25mi |
| 45 Baker Dr SW Atlanta, GA | 3.0 | 2.0 | 1056 | $1,600 | $1.52 | 26d | 1 | 1.25mi |
| 2745 Old Hapeville Rd SW Atlanta, GA | 2.0–3.0 | 2.0 | 1007 | $1,375 | $1.36 | 16d | 1 | 1.27mi |
| 436 Grady Pl Atlanta, GA | 3.0 | 2.0 | 1425 | $2,100 | $1.47 | 16d | 1 | 1.29mi |
| 2959 Forrest Hills Dr SW Atlanta, GA | 1.0–2.0 | 1.0–1.5 | 925 | $1,250 | $1.35 | 18d | 2 | 1.34mi |
| 2959 Forrest Hills Dr SW Atlanta, GA | 1.0–2.0 | 1.0–1.5 | 925 | $1,250 | $1.35 | 15d | 1 | 1.34mi |
| 231 Maple St Atlanta, GA | 3.0 | 2.0 | 1068 | $1,645 | $1.54 | 45d | 1 | 1.36mi |
| 3420 Northside Dr Unit B Hapeville, GA | 2.0 | 1.0 | 1000 | $1,150 | $1.15 | 0d | 1 | 1.40mi |
| 305 Banberry Dr SE Atlanta, GA | 3.0 | 1.0 | 1000 | $1,550 | $1.55 | 0d | 1 | 1.40mi |
| 3301 Old Jonesboro Rd Atlanta, GA | 2.0 | 1.0 | 899 | $2,250 | $2.50 | 7d | 1 | 1.40mi |
| 3450 Forrest Park Rd SE Atlanta, GA | 1.0–3.0 | 1.0–2.0 | 1002 | $1,537 | $1.53 | 26d | 11 | 1.41mi |
| 3287 Russell St Atlanta, GA | 2.0 | 1.0 | 800 | $1,195 | $1.49 | 45d | 1 | 1.47mi |
| 278 Moreland Way Atlanta, GA | 3.0 | 2.0 | 1000 | $1,945 | $1.95 | 26d | 1 | 1.49mi |
| 2800 Grand Ave SW Atlanta, GA | 3.0 | 1.0 | 1052 | $1,600 | $1.52 | 0d | 1 | 1.49mi |
Listing history 5 events
-
2026-06-04days on market $159,900 Active 6 DOM
-
2026-06-03days on market $159,900 Active 5 DOM
-
2026-06-02days on market $159,900 Active 4 DOM
-
2026-06-01days on market $159,900 Active 3 DOM
-
2026-05-31days on market $159,900 Active 2 DOM
ⓘ Source: listings_history table (triggers on properties + properties_extension) + one-shot
backfill from property_details.listing_events for pre-trigger history.
Tax reassessment forecast GA · Resets to sale price
- Current annual tax
- $2,962 · $247/mo
- Projected year-2 tax
- $2,962 · $247/mo
- Expected delta
- $0/yr ($0/mo · 0.0%)
ⓘ Screening estimate from a state-policy table — verify with the county assessor before closing.
Climate risk First Street
- Flood 1/10 Low FEMA zone X (unshaded) · 0% chance over 30 yrs
- Wildfire 1/10 Low
- Heat 5/10 Major 7 d/yr ≥104°F today · 18 d/yr by 30 yrs out
- Wind 6/10 Major 27% chance of damaging wind over 30 yrs
- Air quality 4/10 Moderate 4 unhealthy d/yr today · 6 by 30 yrs out
Nearby sold comps map
Loading sold comps map…
Walkable amenities ~0.75 mi
Loading nearby amenities…
Taxation est. · year 1
- Rental income
- $20,920
- − Mortgage interest
- −$8,957
- − Property taxes
- −$2,962
- − Insurance
- −$800
- − Repairs & maintenance
- −$1,674
- − Management
- −$1,674
- − Depreciation
- −$4,652
- Taxable income
- $203
- Est. tax owed @ 24.0%
- −$49
- After-tax cash flow
- $2,654/yr
For passive investors: Depreciation is non-cash, so a rental often shows a tax loss while cash-flowing — sheltering income. Rental losses are passive: they offset passive income freely, and up to $25,000/yr can offset ordinary (W-2) income if you actively participate and your MAGI is under $100k (phasing out to $0 by $150k); unused losses carry forward. On sale, claimed depreciation is recaptured at up to 25%, and gains may owe capital-gains tax (a 1031 exchange can defer both). Figures are a year-1 estimate at your 24.0% rate — not tax advice; consult a CPA.
Schools (NCES district)
- District
- Atlanta Public Schools
- NCES district ID
- 1300120
- Math proficiency
- 28% ▼ -6.00%
- Reading proficiency
- 35% ▼ -2.00%
- Median HH income
- $48,306
- Composite
- 27.27/100
- National rank
- #7006
- State rank
- #80 of 174 in GA
Livability — Atlanta
- Score
- 83/100
- State rank
- #6
- US rank
- #919
Category grades
Schools grade is shown separately in the Schools card above.
Census & demographics
- Census place
- Atlanta, GA
- County
- Fulton County · 1,094,430 people
- City population
- 629,525
- Metro
- Atlanta-Sandy Springs-Alpharetta, GA
- Population (ZIP)
- 16,182
- Household income
- $63,189
- Rent vs Own
- Severe rent burden
- 930.0
Population outlook (Fulton County) Hauer SSP2
- Today (2025)
- 1,203,707 people
- By 2030
- 1,299,706 · +8.0%
- By 2040
- 1,488,256 · +23.6%
- By 2050
- 1,664,580 · +38.3%
- By 2075
- 2,036,072 · +69.2%
- By 2100
- 2,222,402 · +84.6%
Race, ethnicity, and origin ACS 2023
- Neighborhood character
- Predominantly Black (68%)
- Race & ethnicity
- Black 68% Hispanic / Latino 16% White 10% Two or more races 9% Native American 2% Asian 1%
- Hispanic origin (detail)
- Mexican 13%
- Common ancestry
- Italian 2% Romanian 1% Swedish 1%
- Foreign-born
- 11% · Canada, Vietnam, Guatemala
- Languages at home
- 81% English-only · Spanish 15% German/W. Germanic 1% Vietnamese 1%
Political lean MEDSL · Fulton
- 2024 margin
- Solid D (+44.9) · D 71.9% · R 27.0% · Other 1.1%
- 2008→2024 swing
- +9.8pp toward D · 2008: 35.0pp · 2024: 44.9pp
- All cycles
- 2024: D+44.9 2020: D+46.4 2016: D+42.1 2012: D+29.6 2008: D+35.0
Not yet ingested
- Civics
- —
Market trends
- HPI YoY
- ▼ -67.78%
- Current HPI
- 320.1111
- Rent YoY
- ▲ 5.45%
- Metro
- Atlanta-Sandy Springs-Alpharetta, GA
- State GDP YoY
- ▲ 2.66%
- F500 in state
- 28
Industry mix (Fortune 500 HQ in GA)
| Industry | F500 HQs | Revenue |
|---|---|---|
| Paper / Packaging | 2 | $29B |
|
||
| Retail | 1 | $160B |
|
||
| Transportation / Logistics | 1 | $91B |
|
||
| Airlines | 1 | $62B |
|
||
| Consumer Goods | 1 | $47B |
|
||
| Utilities | 1 | $25B |
|
||
Price history
+661.4% since first listed49 events — show timeline
- 2026-05-29 Listed $159,900 FMLS
- 2026-05-29 Listed $159,900 GAMLS
- 2026-03-06 Rental Removed $1,650 TENANTTURNER2
- 2026-01-23 Listed for Rent $1,650 TENANTTURNER2
- 2025-04-28 Sold (MLS) $158,900 FMLS
- 2025-04-25 Sold (MLS) $158,900 GAMLS
- 2025-04-21 Pending — GAMLS
- 2025-04-06 Pending — FMLS
- 2025-03-31 Contingent — GAMLS
- 2025-03-31 Contingent — FMLS
- 2025-03-12 Relisted — GAMLS
- 2025-03-12 Relisted — FMLS
- 2025-03-10 Contingent — FMLS
- 2025-03-10 Contingent — GAMLS
- 2025-02-28 Listed $165,000 GAMLS
- 2025-02-28 Listed $165,000 FMLS
- 2021-02-11 Sold (Public Records) $125,000 Public Records
- 2020-08-12 Sold (Public Records) $93,500 Public Records
- 2020-08-12 Sold (MLS) $93,500 GAMLS
- 2020-08-12 Sold (MLS) $93,500 FMLS
- 2020-07-20 Pending — GAMLS
- 2020-07-20 Pending — FMLS
- 2020-06-06 Price Changed $99,900 GAMLS
- 2020-06-05 Price Changed $99,900 FMLS
- 2020-02-27 Listed $109,900 GAMLS
- 2020-02-27 Listed $109,900 FMLS
- 2017-08-07 Sold (Public Records) $65,000 Public Records
- 2017-07-28 Sold (MLS) $65,000 GAMLS
- 2017-07-28 Sold (MLS) $65,000 FMLS
- 2017-07-26 Pending — GAMLS
- 2017-07-13 Contingent — FMLS
- 2017-07-07 Pending — GAMLS
- 2017-06-01 Relisted — GAMLS
- 2017-06-01 Relisted — FMLS
- 2017-05-12 Contingent — FMLS
- 2017-05-12 Pending — GAMLS
- 2017-05-07 Listed $72,912 GAMLS
- 2017-05-05 Listed $72,919 FMLS
- 2017-04-11 Listing Removed — GAMLS
- 2016-12-06 Price Changed $73,571 GAMLS
- 2016-10-27 Listing Removed — GAMLS
- 2016-10-24 Listed $77,443 GAMLS
- 2016-09-09 Price Changed $81,519 GAMLS
- 2016-08-10 Price Changed $83,287 GAMLS
- 2016-07-13 Price Changed $84,987 GAMLS
- 2016-07-05 Listed $87,615 GAMLS
- 2009-10-21 Sold (MLS) $12,000 FMLS
- 2009-09-03 Listed $15,500 FMLS
- 1975-10-07 Sold (Public Records) $21,000 Public Records
Property tax history
+8.0%/yrLatest (2025): $2,962 · -6.4% YoY. Source: county tax records.
Cash-flow waterfall
monthlySold comps — $/sqft
last 12 mo · ≤1 miLoading sold comps…