17069 N Indian Canyon Dr #86 · Desert Hot Springs, CA
Flood risk No data
- FEMA flood zone
- —
- Chance of flooding over 30 yrs
- —
- Est. flood insurance / yr
- —
Fire risk No data
- Est. fire insurance / yr
- —
Heat risk No data
- Hot days now (above threshold)
- —
- Hot days in 30 yrs
- —
Wind risk No data
- Chance of severe wind over 30 yrs
- —
Air-quality risk No data
- Unhealthy air days now
- —
- Unhealthy air days in 30 yrs
- —
Risk factors via First Street. Map © Google.
Why this score? — see what drove the B grade
The composite is a weighted blend of 9 inputs, each scored 0–100. Each bar is that input's sub-score; the figure is the points it added to the 100-point composite (weight × sub-score).
- Cash flow +30.0/30.0
- 1% rule +10.0/10.0
- DSCR +10.0/10.0
- ARV discount +7.5/15.0
- Condition / age +4.8/5.0
- Rent growth +3.4/5.0
- Schools +2.7/10.0
- Livability +2.5/5.0
- Appreciation +0.0/10.0
$99,000
🖨 Deal sheet (PDF) 📄 Offer letter ✓ Due diligence
Listing remarks
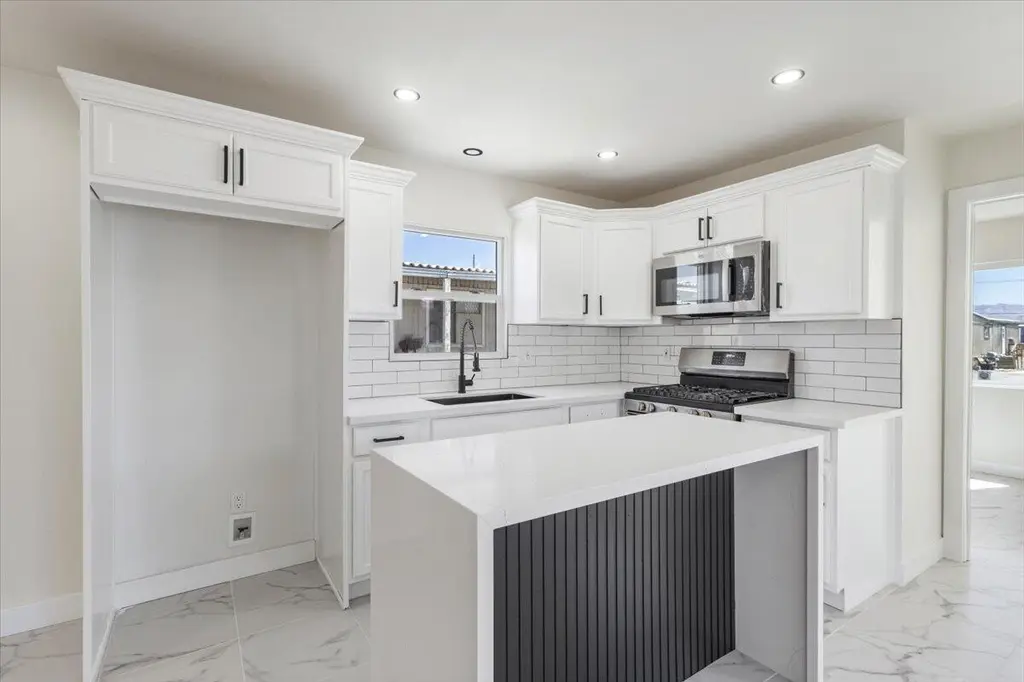
Beautifully remodeled 3-bedroom, 2-bath manufactured home located in Indian Canyon Mobile Home Park on the north side of Palm Springs with quick access to I-10, placing the entire Coachella Valley just minutes away. This home has been completely updated from head to toe and was thoughtfully renovated by the owner inside and out with quality finishes throughout. Upgrades include a new roof and ceilings, new tile flooring and baseboards, fresh interior and exterior paint, new windows, remodeled bathrooms with updated fixtures and new tile showers, a fully renovated kitchen featuring quartz countertops, tile backsplash, and new cabinetry, and a new deck entrance. Additional improvements includ
Key facts
- New ac system
- New deck entrance
- Quick access to i-10
Tags
Property features AI
Finance
- Other: Directions: Please use GPS; Cross street: Dillon; Disclosures: None; Short term rentals: No; Will consider lease: No; Sale type: Standard
- Financial info: Land lease amount: $695 annually; Land type: Lease; Listing terms include conventional, private financing available, cash to new loan, cash
- HOA & community: No monthly association fee; Gated community: No
Exterior
- Parking: Assigned parking; 3 total parking spaces; 3 carport spaces
- Security: Community security
- Utilities: Sewer: unknown; PUD: No
- Home design: Detached property; Ground level with no unit above
- Construction: Year built: builder source
- Exterior features: Community security; Community pool (in-ground)
Interior
- Flooring: Tile flooring
- Bathrooms: 2 full bathrooms
- Heating & cooling: Other heating; Wall/Window unit cooling
- Interior features: Unfurnished; Living room
Neighborhood map
What this means for you Summary
Snapshot
- This is a 3-bed/2.0-bath manufactured listed at $99k. Condition is rated excellent.
Deal economics
- At list price, monthly cash flow is $1k ($14k/yr) — positive.
- The deal already cash-flows at list — no discount required.
- Meets the 1% rule at list price ($2k rent vs $99k).
- Recommended offer: $98k (1.5% below list) — sets the bar for market timing.
- Cap rate 20.3% vs local median 3.9% in Desert Hot Springs — top-decile yield for the area; either an underpriced asset or a hidden risk that comps aren't pricing in. Stress-test before assuming the spread holds.
Location & tenants
- Location reads 49/100 on livability (#1,149 in CA) — a working-class tenant base; expect higher turnover. Strengths: housing B+; Watch: crime D+, amenities F, commute F.
- Palm Springs Unified (suburban): math 21% / reading 42% proficiency, ranked #328 of 517 in CA (top 63%) — families likely to look elsewhere, expect single-tenant / working-renter base with shorter leases; 73% free/reduced lunch — lower-income household profile, screen leases tightly.
- Zoned schools: Two Bunch Palms Elementary (711 students, 97% FRL); Painted Hills Middle (741 students, 98% FRL); Desert Hot Springs High (math 27% / reading 52%, grade F, #532 of 1,170 statewide, top 48%, 1,742 students, 98% FRL) — zoned schools average 98% FRL vs 73% district-wide (24 pts higher); higher-poverty schools than district average — tighter screening recommended.
- Market conditions: Rents rising (+3.7%/yr); 521 active listings in the ZIP; 9,195 units permitted in Riverside County in 2024 (1,512 in 5+ unit buildings).
- At $2,327/mo this rent would consume 52% of the median local household income ($54k/yr) (locally 2095% of renters already pay >50% of income on rent) — very limited rent-growth headroom before tenants either downsize or default.
Forward outlook
- Local home prices are declining (-3.0%/yr); year-one equity from $684 of loan paydown is wiped out by about $3k of value loss. Plan a longer hold.
- Riverside County population projected at +22% by 2050 — long-run rental-demand tailwind backs the buy-and-hold thesis.
- At projected returns (-3.0% appreciation + 3.7% rent growth), your $28k cash investment doubles in ~3 years — after that, you're playing with house money.
Negotiation context
- It's been on market 16 days — a 2% lower offer ($98k) is reasonable based on typical stale-listing flexibility.
Questions for the listing agent
- Built in 1961 — when were the roof, HVAC, electrical panel, plumbing, and water heater last replaced?
- Is there a deadline driving the sale (1031 exchange, divorce, estate, relocation)? That informs how much negotiation room exists.
- Schools are F-rated, which usually means shorter tenancies and higher turnover. Who's the typical renter profile here, and what's been the actual vacancy rate?
- Crime grade is D in this area — have there been break-ins, vandalism, or insurance claims at this property in the last 3 years? What carrier currently insures it and at what premium?
- What's the average days-on-market for RENTAL listings here right now (not sales)? A rising rental-DOM trend means longer vacancies and softer asking-rent achievability than the comps imply.
- What's the recent tenant-quality profile in this submarket — average credit score on applications, eviction rate, late-payment / NSF rate, and stable-employment percentage? A property-management company in the area should have these aggregated.
- How much new for-sale + rental construction is in the pipeline within 1–3 miles? Heavy new supply typically softens prices + rents 12–24 months out; constrained supply supports both.
Investment metrics
- 1% rule
- 2.35% ✓
- Cap rate
- 20.28%
- Cash-on-cash
- 49.95%
- DSCR
- 3.22
- GRM
- 3.5
CMA / ARV
No comps found within radius.
Projected returns pro-forma
-3.0% appreciation · 3.66% rent growth · sell at horizon
- IRR
- 48.4%
- Equity multiple
- 3.13×
- Total profit
- $59,037
- Equity at exit
- $14,761
- IRR
- 54.3%
- Equity multiple
- 6.51×
- Total profit
- $152,647
- Equity at exit
- $8,560
Cash invested: $27,720 (down + closing). Projections, not guarantees.
Landlord ↔ Tenant lean methodology
- Overall (STATE)
- 18 Strongly Tenant-Friendly
- State California
- 18 Strongly Tenant-Friendly · D+13
- County
- — inherits STATE
- City
- — inherits STATE
ZIP-level market 92240
- Home prices YoY
- -19.6%
- Rents YoY
- 3.7%
- Active inventory
- 521
- Price-to-rent
- 3.5×
Monthly cashflow live
- Estimated rent
- $2,327 medium interval (Pro) →
- Mortgage (P&I)
- −$519
- Tax est. 1.5%
- −$124 /mo · $1,485/yr
- Insurance
- −$41
- HOA
- −$0
- Vacancy / Maint / Mgmt
- −$489
- Net cashflow
- $1,154
Break-even live
Sensitivity live
| Price | -10% $1,222 | -5% $1,188 | +0% $1,154 | +5% $1,120 | +10% $1,085 |
|---|---|---|---|---|---|
| Rent | -10% $970 | -5% $1,062 | +0% $1,154 | +5% $1,246 | +10% $1,338 |
| Rate | -1.0pp $1,204 | -0.5pp $1,179 | base $1,154 | +0.5pp $1,128 | +1.0pp $1,102 |
UW: 25.0% down · 7.5% · 30yr · 1.5% tax · 5.0% vac · 8.0% maint · 8.0% mgmt
Financing live
Cash to close
- Down payment
- $24,750
- Closing costs
- $2,970
- Reserves months
- —
- Total cash needed
- —
Loan-product check · same deal, 3 products live
Conventional
25% down · 7.5% · 30yr
- Down + closing
- —
- Monthly P&I
- —
- Monthly cashflow
- —
- DSCR
- —
- Eligible?
- —
Personal DTI + credit; lowest rate.
DSCR
20% down · 8.5% · 30yr
- Down + closing
- —
- Monthly P&I
- —
- Monthly cashflow
- —
- DSCR
- —
- Eligible?
- —
No personal income docs; deal must DSCR.
Hard money
10% down · 12.0% · 12mo
- Down + closing
- —
- Monthly P&I
- —
- Monthly cashflow
- —
- DSCR
- —
- Eligible?
- —
Short-term bridge; refi at stabilization.
Listing history 11 events
-
2026-06-21days on market $99,000 Active 16 DOM
-
2026-06-18days on market $99,000 Active 13 DOM
-
2026-06-17days on market $99,000 Active 12 DOM
-
2026-06-16days on market $99,000 Active 11 DOM
-
2026-06-15days on market $99,000 Active 10 DOM
-
2026-06-13days on market $99,000 Active 8 DOM
-
2026-06-13days on market $99,000 Active 7 DOM
-
2026-06-09days on market $99,000 Active 4 DOM
-
2026-06-08days on market $99,000 Active 3 DOM
-
2026-06-07remarks 699-char remark
-
2026-06-07$99,000 Active 2 DOM
ⓘ Source: listings_history table (triggers on properties + properties_extension) + one-shot
backfill from property_details.listing_events for pre-trigger history.
Nearby sold comps map
Loading sold comps map…
Walkable amenities ~0.75 mi
Loading nearby amenities…
Taxation est. · year 1
- Rental income
- $27,919
- − Mortgage interest
- −$5,546
- − Property taxes
- −$1,485
- − Insurance
- −$495
- − Repairs & maintenance
- −$2,234
- − Management
- −$2,234
- − Depreciation
- −$2,880
- Taxable income
- $13,046
- Est. tax owed @ 24.0%
- −$3,131
- After-tax cash flow
- $10,715/yr
For passive investors: Depreciation is non-cash, so a rental often shows a tax loss while cash-flowing — sheltering income. Rental losses are passive: they offset passive income freely, and up to $25,000/yr can offset ordinary (W-2) income if you actively participate and your MAGI is under $100k (phasing out to $0 by $150k); unused losses carry forward. On sale, claimed depreciation is recaptured at up to 25%, and gains may owe capital-gains tax (a 1031 exchange can defer both). Figures are a year-1 estimate at your 24.0% rate — not tax advice; consult a CPA.
Condition & rehab AI · 13 photos
This beautifully remodeled 3-bedroom, 2-bath manufactured home is in excellent condition with no visible repairs needed. The home has been thoughtfully renovated inside and out, featuring new cabinetry, quartz countertops, updated fixtures, and new tile flooring. The exterior has been freshly painted and includes a new deck entrance. Additional improvements include a new roof and air conditioning unit. The home is move-in ready and would be an excellent investment.
Value-add opportunities
- Both Landscaping and curb appeal improvements — Enhances curb appeal and can attract more buyers
- Both Add a small garden or planter box near the front door — Can improve curb appeal and add a touch of greenery
- Both Install a smart thermostat — Can improve energy efficiency and comfort for potential buyers
Renovation cost estimate screening
Value-add ROI direction
- Both Landscaping and curb appeal improvements — Enhances curb appeal and can attract more buyers ↑
- Both Add a small garden or planter box near the front door — Can improve curb appeal and add a touch of greenery ↑
- Both Install a smart thermostat — Can improve energy efficiency and comfort for potential buyers ↑
ⓘ Cost ranges are severity-bucket heuristics (US national rule-of-thumb). Get contractor quotes + a written scope before underwriting a rehab budget.
Schools (NCES district)
- District
- Palm Springs Unified
- NCES district ID
- 0629550
- Math proficiency
- 21% ▼ -7.00%
- Reading proficiency
- 42% ▬ 0.00%
- Median HH income
- $43,638
- Composite
- 26.76/100
- National rank
- #7131
- State rank
- #328 of 517 in CA
Livability — Desert Hot Springs
- Score
- 49/100
- State rank
- #1149
- US rank
- #25774
Category grades
Schools grade is shown separately in the Schools card above.
Census & demographics
- County
- Riverside County · 2,287,001 people
- City population
- 41,615
- Metro
- Riverside-San Bernardino-Ontario, CA
- Population (ZIP)
- 41,615
- Household income
- $54,023
- Rent vs Own
- Severe rent burden
- 2095.0
Population outlook (Riverside County) Hauer SSP2
- Today (2025)
- 2,664,475 people
- By 2030
- 2,802,692 · +5.2%
- By 2040
- 3,050,904 · +14.5%
- By 2050
- 3,256,783 · +22.2%
- By 2075
- 3,655,058 · +37.2%
- By 2100
- 3,766,594 · +41.4%
Race, ethnicity, and origin ACS 2023
- Neighborhood character
- Majority Hispanic (64%)
- Race & ethnicity
- Hispanic / Latino 64% Two or more races 27% White 23% Black 7% Native American 2% Asian 2%
- Hispanic origin (detail)
- Mexican 53%
- Common ancestry
- Lithuanian 1% Romanian 1% Italian 1%
- Foreign-born
- 27% · Canada, Vietnam
- Languages at home
- 47% English-only · Spanish 50% Russian/Polish/Slavic 1%
Political lean MEDSL · Riverside
- 2024 margin
- Toss-up / Even · D 48.0% · R 49.3% · Other 2.6%
- 2008→2024 swing
- -3.6pp toward R · 2008: 2.3pp · 2024: -1.3pp
- All cycles
- 2024: R+1.3 2020: D+8.0 2016: D+4.3 2012: R+0.4 2008: D+2.3
Not yet ingested
- Civics
- —
Market trends
- HPI YoY
- ▼ -102.10%
- Current HPI
- 418.4691
- Rent YoY
- ▲ 3.66%
- Metro
- Riverside-San Bernardino-Ontario, CA
- State GDP YoY
- ▲ 3.21%
- F500 in state
- 116
Industry mix (Fortune 500 HQ in CA)
| Industry | F500 HQs | Revenue |
|---|---|---|
| Technology | 27 | $1,492B |
|
||
| Financial Services | 3 | $174B |
|
||
| Retail | 3 | $44B |
|
||
| Insurance | 3 | $26B |
|
||
| Media / Entertainment | 2 | $115B |
|
||
| Pharmaceuticals / Biotech | 2 | $62B |
|
||
Price history
1 event — show timeline
- 2026-06-05 Listed $99,000 GPSMLS
Cash-flow waterfall
monthlySold comps — $/sqft
last 12 mo · ≤1 miLoading sold comps…