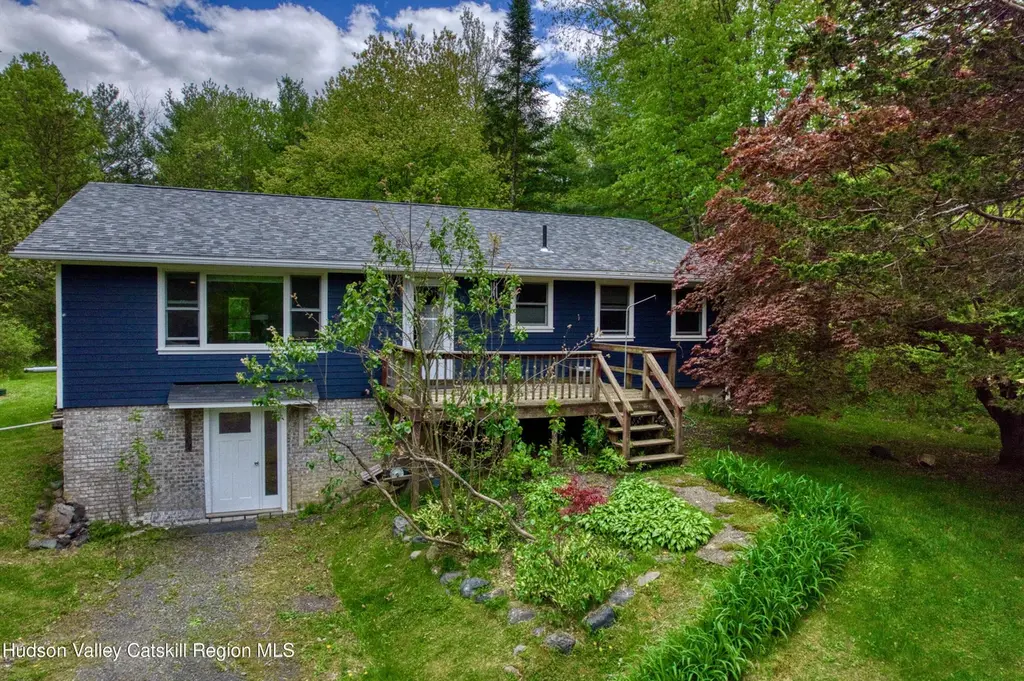
638 Sleepy Hollow Rd · Sleepy Hollow Lake, NY
Flood risk 1/10 · Minimal
- FEMA flood zone
- X (unshaded)
- Chance of flooding over 30 yrs
- 0.0%
- Est. flood insurance / yr
- $473 – $860
Fire risk 3/10 · Minor
- Est. fire insurance / yr
- $691 – $1,283
Heat risk 4/10 · Minor
- Hot days now (above 99°F)
- 7 days/yr
- Hot days in 30 yrs
- 16 days/yr
Wind risk 3/10 · Minor
- Chance of severe wind over 30 yrs
- 9.0%
Air-quality risk 2/10 · Minimal
- Unhealthy air days now
- 0 days/yr
- Unhealthy air days in 30 yrs
- 1 days/yr
Risk factors via First Street. Map © Google.
Why this score? — see what drove the B- grade
The composite is a weighted blend of 9 inputs, each scored 0–100. Each bar is that input's sub-score; the figure is the points it added to the 100-point composite (weight × sub-score).
- Cash flow +18.9/30.0
- ARV discount +15.0/15.0
- Appreciation +8.0/10.0
- DSCR +6.0/10.0
- 1% rule +5.9/10.0
- Schools +4.3/10.0
- Rent growth +2.5/5.0
- Livability +2.5/5.0
- Condition / age +2.2/5.0
$299,000
🖨 Deal sheet 📄 Offer letter ✓ Due diligence
Listing remarks MLS
A single family, ranch style home with 3 Bedrooms and 1 Bath with approximately 1,363 square feet of living space and an unfinished basement. Built in 1975. One car garage attached/under. Needs some work, but great opportunity. Fair Condition
Key facts
- Community amenities
- Double lot
- Lake access
Tags
Property features AI
Finance
- Other: Zoning: SFR
- HOA & community: Homeowners association with annual fee (approx. $2,300); Community amenities include clubhouse, pool, tennis courts, basketball court, park, playground, boating, fishing, beach access and beach rights
Exterior
- Utilities: Private water; Private sewer; 200+ Amp electric service; Underground electric and utilities
- Home design: Single-family residence; Residential property
- Construction: Vinyl siding; Concrete perimeter foundation; Asphalt roof; Built in prior years (year built not provided)
- Exterior features: Deck; Paved road access; Lot approximately 0.6 acres; Gated community with lake, beach access and community amenities
Interior
- Kitchen: Dishwasher; Range; Refrigerator
- Flooring: Other
- Bathrooms: 1 full bathroom
- Heating & cooling: Forced air heating; Oil heating; Pellet stove
- Interior features: Dishwasher, Range, Refrigerator; Full, partially finished basement; Other flooring
Neighborhood map
What this means for you Summary
Snapshot
- This is a 3-bed/1.0-bath single-family listed at $299k. Condition is rated fair.
Deal economics
- At list price, monthly cash flow is $309 ($4k/yr) — positive.
- The deal already cash-flows at list — no discount required.
- Meets the 1% rule at list price ($3k rent vs $299k).
- Recommended offer: $295k (1.5% below list) — sets the bar for market timing.
- Cap rate 7.5% vs local median 2.3% in Sleepy Hollow Lake — top-decile yield for the area; either an underpriced asset or a hidden risk that comps aren't pricing in. Stress-test before assuming the spread holds.
Location & tenants
- Location reads: area grade B — affects rentability + tenant quality, not the cash-flow math above.
- Coxsackie-Athens Central School District (town): math 43% / reading 56% proficiency, ranked #384 of 590 in NY (top 65%) — families likely to look elsewhere, expect single-tenant / working-renter base with shorter leases.
- Market conditions: 91 active listings in the ZIP; 1 comparable units currently listed for rent nearby; 97 units permitted in Greene County in 2024 (0 in 5+ unit buildings).
Forward outlook
- In year one you build about $20k of equity ($2k loan paydown + $18k appreciation (5.9% local appreciation)).
- Greene County population projected at -22% by 2050 — secular population decline; favor cash flow + early exit over multi-decade hold.
- At projected returns (5.9% appreciation + 3.0% rent growth), your $84k cash investment doubles in ~4 years — after that, you're playing with house money.
- By year 2, paydown + projected appreciation supports a ~$32k cash-out refi (75% LTV) — recoverable capital for the next deal without selling this one.
Negotiation context
- It's been on market 17 days — a 2% lower offer ($295k) is reasonable based on typical stale-listing flexibility.
- 3 sale attempts since 18y ago with the ask held roughly flat each time — persistent listings suggest the price (not the market) is what's stuck; bring a comps-based counter.
- Current owner paid $96k; list at $299k implies a 213% gain — meaningful room to come down on a strong offer.
Questions for the listing agent
- Have any recent inspections been done? Can we get a copy of the seller's disclosures and any deferred-maintenance estimates?
- Built in 1975 — when were the roof, HVAC, electrical panel, plumbing, and water heater last replaced?
- What does the HOA fee cover, when was the last increase, and are there any pending special assessments or reserve-fund shortfalls?
- Is there a deadline driving the sale (1031 exchange, divorce, estate, relocation)? That informs how much negotiation room exists.
- What's the average days-on-market for RENTAL listings here right now (not sales)? A rising rental-DOM trend means longer vacancies and softer asking-rent achievability than the comps imply.
- What's the recent tenant-quality profile in this submarket — average credit score on applications, eviction rate, late-payment / NSF rate, and stable-employment percentage? A property-management company in the area should have these aggregated.
- How much new for-sale + rental construction is in the pipeline within 1–3 miles? Heavy new supply typically softens prices + rents 12–24 months out; constrained supply supports both.
Investment metrics
- 1% rule
- 1.09% ✓
- Cap rate
- 7.53%
- Cash-on-cash
- 4.43%
- DSCR
- 1.20
- GRM
- 7.7
CMA / ARV
- ARV (median comp)
- $449,966
- List price
- $299,000
- Delta
- -33.55%
- Verdict
- UNDERPRICED
- Comps
- 20 within 1.0 mi
Show comp detail 5 sales within ~0.75 mi
| Address | Dist | Beds/Ba | Sqft | Sold | Price | $/sf | Match |
|---|---|---|---|---|---|---|---|
| 19 Lisa Ln | 0.24mi | 3/2.0 | 1,512 (+4%) | 16mo | $335,000 | $222 | 65 |
| 19 Lisa Ln #1211 | 0.24mi | 3/2.0 | 1,512 (+4%) | 16mo | $335,000 | $222 | 65 |
| 776 Sleepy Hollow Rd Rd | 0.33mi | 3/2.5 | 1,520 (+4%) | 21mo | $360,000 | $237 | 53 |
| 888 Sleepy Hollow Rd | 0.55mi | 3/2.0 | 1,350 (-7%) | 13mo | $270,000 | $200 | 48 |
| 901 Sleepy Hollow Rd | 0.60mi | 2/2.0 (-1) | 1,536 (+6%) | 21mo | $345,000 | $225 | 37 |
Match score weights: distance 35% · size 25% · config 20% · recency 20%. Top-matched comps best support the ARV.
Projected returns pro-forma
5.93% appreciation · 3.0% rent growth · sell at horizon
- IRR
- 18.8%
- Equity multiple
- 2.25×
- Total profit
- $104,850
- Equity at exit
- $186,542
- IRR
- 18.4%
- Equity multiple
- 4.51×
- Total profit
- $293,677
- Equity at exit
- $337,064
Cash invested: $83,720 (down + closing). Projections, not guarantees.
Landlord ↔ Tenant lean methodology
- Overall (STATE)
- 15 Strongly Tenant-Friendly
- State New York
- 15 Strongly Tenant-Friendly · D+10
- County
- — inherits STATE
- City
- — inherits STATE
ZIP-level market 12015
- Home prices YoY
- 1.4%
- Active inventory
- 91
- Price-to-rent
- 7.7×
Monthly cashflow live
- Estimated rent
- $3,250 medium interval (Pro) →
- Mortgage (P&I)
- −$1,568
- Tax est. 1.5%
- −$374 /mo · $4,485/yr
- Insurance
- −$125
- HOA
- −$192
- Vacancy / Maint / Mgmt
- −$682
- Net cashflow
- $309
Break-even live
UW: 25.0% down · 7.5% · 30yr · 1.5% tax · 5.0% vac · 8.0% maint · 8.0% mgmt
Financing live
Cash to close
- Down payment
- $74,750
- Closing costs
- $8,970
- Reserves months
- —
- Total cash needed
- —
Loan-product check · same deal, 3 products live
Conventional
25% down · 7.5% · 30yr
- Down + closing
- —
- Monthly P&I
- —
- Monthly cashflow
- —
- DSCR
- —
- Eligible?
- —
Personal DTI + credit; lowest rate.
DSCR
20% down · 8.5% · 30yr
- Down + closing
- —
- Monthly P&I
- —
- Monthly cashflow
- —
- DSCR
- —
- Eligible?
- —
No personal income docs; deal must DSCR.
Hard money
10% down · 12.0% · 12mo
- Down + closing
- —
- Monthly P&I
- —
- Monthly cashflow
- —
- DSCR
- —
- Eligible?
- —
Short-term bridge; refi at stabilization.
Rent comps 1 comps
| Address | Beds | Baths | Sqft | Rent | $/sqft | DOM | Units | Dist |
|---|---|---|---|---|---|---|---|---|
| 1321 Sleepy Hollow RD Other City - Not In The State Of Florida, NY | 3.0 | 2.0 | 1640 | $3,250 | $1.98 | 44d | 1 | 0.66mi |
HOA detail
- Monthly dues
- $192 · $2,304/yr
Listing history 6 events
-
2026-05-31statusdays on market $299,000 Pending 17 DOM
-
2026-05-12$299,000 Active 609-char remark
-
2018-04-17soldstatus $95,634 242-char remark
Show marketing remark (242 chars)
A single family, ranch style home with 3 Bedrooms and 1 Bath with approximately 1,363 square feet of living space and an unfinished basement. Built in 1975. One car garage attached/under. Needs some work, but great opportunity. Fair Condition
-
2018-02-26$101,200 242-char remark
Show marketing remark (242 chars)
A single family, ranch style home with 3 Bedrooms and 1 Bath with approximately 1,363 square feet of living space and an unfinished basement. Built in 1975. One car garage attached/under. Needs some work, but great opportunity. Fair Condition
-
2009-03-21historical
-
2008-09-22$165,000
ⓘ Source: listings_history table (triggers on properties + properties_extension) + one-shot
backfill from property_details.listing_events for pre-trigger history.
Climate risk First Street
- Flood 1/10 Low FEMA zone X (unshaded) · 0% chance over 30 yrs
- Wildfire 3/10 Moderate
- Heat 4/10 Moderate 7 d/yr ≥99°F today · 16 d/yr by 30 yrs out
- Wind 3/10 Moderate 9% chance of damaging wind over 30 yrs
- Air quality 2/10 Low 0 unhealthy d/yr today · 1 by 30 yrs out
Nearby sold comps map
Loading sold comps map…
Walkable amenities ~0.75 mi
Loading nearby amenities…
Taxation est. · year 1
- Rental income
- $39,000
- − Mortgage interest
- −$16,749
- − Property taxes
- −$4,485
- − Insurance
- −$1,495
- − Repairs & maintenance
- −$3,120
- − Management
- −$3,120
- − HOA
- −$2,304
- − Depreciation
- −$8,698
- Taxable loss
- −$971
- Est. tax savings @ 24.0%
- +$233
- After-tax cash flow
- $3,943/yr
For passive investors: Depreciation is non-cash, so a rental often shows a tax loss while cash-flowing — sheltering income. Rental losses are passive: they offset passive income freely, and up to $25,000/yr can offset ordinary (W-2) income if you actively participate and your MAGI is under $100k (phasing out to $0 by $150k); unused losses carry forward. On sale, claimed depreciation is recaptured at up to 25%, and gains may owe capital-gains tax (a 1031 exchange can defer both). Figures are a year-1 estimate at your 24.0% rate — not tax advice; consult a CPA.
Condition & rehab AI · 12 photos
This 3-bedroom home requires moderate renovations to update the kitchen and bathroom, but has a good roof and foundation. The location offers a great opportunity for a weekend retreat or investment.
Repairs flagged
- Major Kitchen appliances — Outdated and worn
- Major Bathroom fixtures — Older and dated
Value-add opportunities
- Both Paint interior walls — Fresh paint enhances curb appeal and interior aesthetics
- Both Replace kitchen appliances — Modern appliances improve functionality and appeal
- Both Update bathroom fixtures — Modern fixtures enhance functionality and appeal
Renovation cost estimate screening
| Repair item | Severity | Est. cost |
|---|---|---|
| Kitchen appliances · Outdated and worn | Major | $15,000–50,000 |
| Bathroom fixtures · Older and dated | Major | $15,000–50,000 |
| Total estimated repair cost · 2 items | $30,000–100,000 |
Value-add ROI direction
- Both Paint interior walls — Fresh paint enhances curb appeal and interior aesthetics ↑
- Both Replace kitchen appliances — Modern appliances improve functionality and appeal ↑
- Both Update bathroom fixtures — Modern fixtures enhance functionality and appeal ↑
ⓘ Cost ranges are severity-bucket heuristics (US national rule-of-thumb). Get contractor quotes + a written scope before underwriting a rehab budget.
Schools (NCES district)
- District
- Coxsackie-Athens Central School District
- NCES district ID
- 3608490
- Math proficiency
- 43% ▼ -1.00%
- Reading proficiency
- 56% ▲ 19.00%
- Median HH income
- $55,006
- Composite
- 42.8/100
- National rank
- #3143
- State rank
- #384 of 590 in NY
Livability — Sleepy Hollow Lake
No livability data for this city. (Only ~50 U.S. cities are tracked.)
Census & demographics
- Census place
- Sleepy Hollow Lake, NY
- Population (ZIP)
- 4,084
Population outlook (Greene County) Hauer SSP2
- Today (2025)
- 44,963 people
- By 2030
- 43,126 · -4.1%
- By 2040
- 38,756 · -13.8%
- By 2050
- 34,913 · -22.4%
- By 2075
- 28,156 · -37.4%
- By 2100
- 22,296 · -50.4%
Race, ethnicity, and origin ACS 2023
- Neighborhood character
- Predominantly White (79%)
- Race & ethnicity
- White 79% Two or more races 10% Hispanic / Latino 7% Asian 3% Black 1%
- Hispanic origin (detail)
- Mexican 4% Dominican 2%
- Common ancestry
- Romanian 3% Iranian 3% Scotch-Irish 2%
- Foreign-born
- 11% · Canada, South Korea, Vietnam
- Languages at home
- 90% English-only · Russian/Polish/Slavic 5% Other Indo-European 2% Spanish 1%
Political lean MEDSL · Greene
- 2024 margin
- R (+17.0) · D 41.5% · R 58.5%
- 2008→2024 swing
- -7.1pp toward R · 2008: -9.9pp · 2024: -17.0pp
- All cycles
- 2024: R+17.0 2020: R+15.6 2016: R+27.4 2012: R+11.1 2008: R+9.9
Not yet ingested
- Civics
- —
Market trends
- HPI YoY
- ▲ 5.93%
- Current HPI
- 426.3034
- Rent YoY
- —
- Metro
- —
- State GDP YoY
- ▲ 2.60%
- F500 in state
- 92
Industry mix (Fortune 500 HQ in NY)
| Industry | F500 HQs | Revenue |
|---|---|---|
| Financial Services | 10 | $950B |
|
||
| Consumer Goods | 9 | $162B |
|
||
| Insurance | 4 | $225B |
|
||
| Telecommunications | 2 | $144B |
|
||
| Pharmaceuticals | 2 | $112B |
|
||
| Media / Entertainment | 2 | $69B |
|
||
Price history
+81.2% since first listed6 events — show timeline
- 2026-05-30 Pending — HVCRMLS
- 2026-05-12 Listed $299,000 HVCRMLS
- 2018-04-17 Sold (MLS) $95,634 Global MLS
- 2018-02-26 Listed $101,200 Global MLS
- 2009-03-21 Listing Removed — Global MLS
- 2008-09-22 Listed $165,000 Global MLS
Cash-flow waterfall
monthlySold comps — $/sqft
last 12 mo · ≤1 miLoading sold comps…