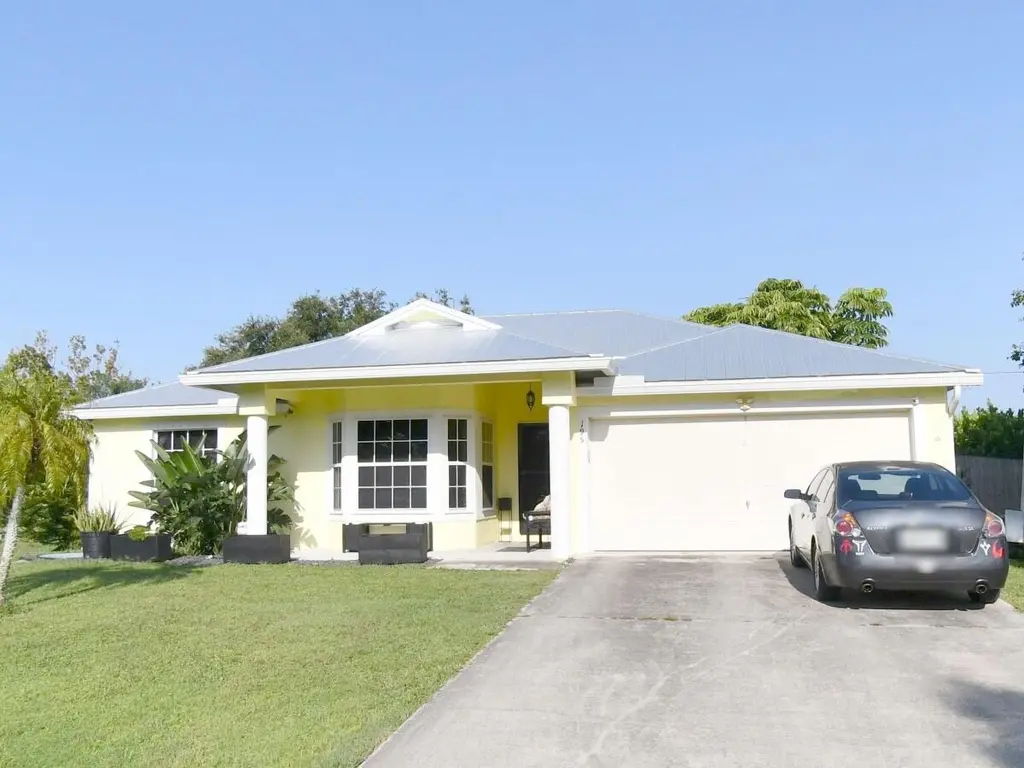
195 NW Friar St · Port St. Lucie, FL
Flood risk 3/10 · Minor
- FEMA flood zone
- X (unshaded)
- Chance of flooding over 30 yrs
- 0.2%
- Est. flood insurance / yr
- $507 – $1,088
Fire risk 1/10 · Minimal
- Est. fire insurance / yr
- $947 – $1,759
Heat risk 10/10 · Severe
- Hot days now (above 106°F)
- 7 days/yr
- Hot days in 30 yrs
- 24 days/yr
Wind risk 10/10 · Severe
- Chance of severe wind over 30 yrs
- 99.0%
Air-quality risk 1/10 · Minimal
- Unhealthy air days now
- 0 days/yr
- Unhealthy air days in 30 yrs
- 0 days/yr
Risk factors via First Street. Map © Google.
Why this score? — see what drove the D grade
The composite is a weighted blend of 9 inputs, each scored 0–100. Each bar is that input's sub-score; the figure is the points it added to the 100-point composite (weight × sub-score).
- Cash flow +14.2/30.0
- ARV discount +7.0/15.0
- DSCR +4.3/10.0
- Schools +3.7/10.0
- 1% rule +3.0/10.0
- Rent growth +2.9/5.0
- Livability +2.5/5.0
- Condition / age +2.5/5.0
- Appreciation +0.0/10.0
$325,000
🖨 Deal sheet (PDF) 📄 Offer letter ✓ Due diligence
Listing remarks MLS
This is what Florida living is all about! 3 bedroom home that offers a light and bright floor plan. An elegant bay window in the dining area great for your morning coffee, a living room with large glass sliders allowing tons of natural sunshine also leads you to the screened in back patio. This fully equipped kitchen includes a closet pantry, breakfast bar and plenty of cabinetry. All the bedrooms offer ceiling fans and ample sized closet space. This master suite has a walk in closet and a separate door leading you to the fenced in back yard for added convenience. As an added bonus is the 2 car garage that is spacious and great for storage. Nice distance to Jaycee Park, Girl Scout Friendship Park, Bayshore Elementary School, Lowes, The Home Depot, Publix and Winn- Dixie and FL Turnpike.
Key facts
- 0.23 acre lot
- 2 garage spots
- Built 2002
Property features AI
Exterior
- Parking: Attached 2-car garage (4 parking spaces total, 2 covered)
- Utilities: Public water; Public sewer; Water connected; Sewer connected
- Home design: Single-family home; One story; Resale property; Faces west
- Construction: Built with CBS (concrete block/stucco) construction; Shingle roof
- Exterior features: Not waterfront
Interior
- Kitchen: Dishwasher; Electric range; Refrigerator
- Bedrooms: 3 bedrooms on the main level
- Flooring: Ceramic tile
- Bathrooms: 2 full bathrooms on the main level
- Heating & cooling: Central heating; Central air conditioning
- Interior features: Split bedroom layout; Electric water heater
Neighborhood map
What this means for you Summary
Snapshot
- This is a 3-bed/2.0-bath single-family listed at $325k.
Deal economics
- At list price, monthly cash flow is $56 ($670/yr) — positive.
- The deal already cash-flows at list — no discount required.
- To meet the 1% rule (rent ≥ 1% of price), the offer needs to be $260k (19.9% below list).
- Recommended offer: $260k (19.9% below list) — sets the bar for 1% rule.
- Cap rate 6.5% vs local median 3.9% in Port St. Lucie — top-decile yield for the area; either an underpriced asset or a hidden risk that comps aren't pricing in. Stress-test before assuming the spread holds.
Location & tenants
- Location reads: area grade D — affects rentability + tenant quality, not the cash-flow math above.
- St. Lucie (urban): math 40% / reading 48% proficiency, ranked #51 of 73 in FL (top 70%) — families likely to look elsewhere, expect single-tenant / working-renter base with shorter leases.
- Zoned schools: Manatee Academy K-8 (math 53% / reading 51%, grade C-, #990 of 2,144 statewide, top 48%, 1,664 students, 65% FRL); Southern Oaks Middle School (math 39% / reading 43%, grade F, #353 of 571 statewide, top 63%, 894 students, 76% FRL); Fort Pierce Central High School (math 15% / reading 45%, grade F, #441 of 667 statewide, top 67%, 3,091 students, 62% FRL).
- Market conditions: Rents rising (+1.5%/yr); 358 active listings in the ZIP; 33 comparable units currently listed for rent nearby; rentals at typical pace (median 24d on market — plan ~3-4 weeks tenant-placement turnaround); solid renter incomes; 4,868 units permitted in St. Lucie County in 2024 (268 in 5+ unit buildings).
- This rent runs 41% of the median local income ($75k/yr) — at the standard rent-burdened threshold; future hikes will face affordability resistance.
Forward outlook
- Local home prices are declining (-3.0%/yr); year-one equity from $2k of loan paydown is wiped out by about $10k of value loss. Plan a longer hold.
- St. Lucie County population projected at +20% by 2050 — long-run rental-demand tailwind backs the buy-and-hold thesis.
Negotiation context
- Only 1 days on market — expect competitive offers; lowballing is unlikely to land.
- 2 sale attempts since 10y ago with the ask held roughly flat each time — persistent listings suggest the price (not the market) is what's stuck; bring a comps-based counter.
- Current owner paid $133k; list at $325k implies a 144% gain — meaningful room to come down on a strong offer.
Risks & watch-outs
- Climate carrying-cost: severe wind risk, 99% chance of damaging wind over 30y; extreme-heat days projected 7→24/yr by 2055 (HVAC capex compounding) — expect insurance premiums to compound above CPI over the hold.
Questions for the listing agent
- Is there a deadline driving the sale (1031 exchange, divorce, estate, relocation)? That informs how much negotiation room exists.
- The area grade is low — what's the realistic commute time and amenity access for the typical tenant pool here? Any planned neighborhood developments (good or bad) we should know about?
- What's the average days-on-market for RENTAL listings here right now (not sales)? A rising rental-DOM trend means longer vacancies and softer asking-rent achievability than the comps imply.
- What's the recent tenant-quality profile in this submarket — average credit score on applications, eviction rate, late-payment / NSF rate, and stable-employment percentage? A property-management company in the area should have these aggregated.
- How much new for-sale + rental construction is in the pipeline within 1–3 miles? Heavy new supply typically softens prices + rents 12–24 months out; constrained supply supports both.
Investment metrics
- 1% rule
- 0.80% ✗
- Cap rate
- 6.50%
- Cash-on-cash
- 0.74%
- DSCR
- 1.03
- GRM
- 10.4
CMA / ARV
- ARV (on-the-fly)
- $321,440
- Comps found
- 12
Show comp detail 12 sales within ~0.75 mi
| Address | Dist | Beds/Ba | Sqft | Sold | Price | $/sf | Match |
|---|---|---|---|---|---|---|---|
| 533 NW Avon Ave | 0.23mi | 3/2.0 | 1,292 (-2%) | 1mo | $240,000 | $186 | 86 |
| 118 NW Carmelite St | 0.31mi | 3/2.0 | 1,290 (-2%) | 10mo | $350,000 | $271 | 75 |
| 550 SW Prima Vista Blvd | 0.31mi | 3/2.0 | 1,406 (+7%) | 1mo | $313,600 | $223 | 73 |
| 331 NW Dearman St | 0.24mi | 3/2.0 | 1,480 (+13%) | 1mo | $359,000 | $243 | 67 |
| 397 NW Biltmore St | 0.48mi | 3/2.0 | 1,244 (-5%) | 4mo | $335,000 | $269 | 66 |
| 385 SW Violet Ave | 0.67mi | 3/2.0 | 1,334 (+2%) | 11mo | $300,500 | $225 | 57 |
| 462 SW Peach St | 0.43mi | 3/2.0 | 1,165 (-11%) | 8mo | $278,999 | $239 | 55 |
| 626 SW Cynthia St | 0.61mi | 3/2.0 | 1,173 (-11%) | 3mo | $290,000 | $247 | 52 |
| 726 NW Placid Ave | 0.65mi | 3/2.0 | 1,125 (-14%) | 3mo | $326,742 | $290 | 44 |
| 744 SW Carmelite St | 0.74mi | 3/2.0 | 1,496 (+14%) | 3mo | $367,000 | $245 | 40 |
| 401 NW Ferris Dr | 0.66mi | 2/2.0 (-1) | 1,184 (-10%) | 10mo | $280,000 | $236 | 39 |
| 551 NW Grenada St | 0.74mi | 3/2.0 | 1,500 (+14%) | 7mo | $387,108 | $258 | 36 |
Match score weights: distance 35% · size 25% · config 20% · recency 20%. Top-matched comps best support the ARV.
Projected returns pro-forma
-3.0% appreciation · 1.53% rent growth · sell at horizon
- IRR
- -16.7%
- Equity multiple
- 0.42×
- Total profit
- $-53,015
- Equity at exit
- $48,459
- IRR
- -11.1%
- Equity multiple
- 0.37×
- Total profit
- $-57,156
- Equity at exit
- $28,100
Cash invested: $91,000 (down + closing). Projections, not guarantees.
Landlord ↔ Tenant lean methodology
- Overall (STATE)
- 87 Strongly Landlord-Friendly
- State Florida
- 87 Strongly Landlord-Friendly · R+3
- County
- — inherits STATE
- City
- — inherits STATE
ZIP-level market 34983
- Home prices YoY
- -33.9%
- Rents YoY
- 1.5%
- Active inventory
- 358
- Price-to-rent
- 10.4×
Monthly cashflow live
- Estimated rent
- $2,603 high interval (Pro) →
- Mortgage (P&I)
- −$1,704
- Tax from tax record
- −$161 /mo · $1,927/yr
- Insurance
- −$135
- HOA
- −$0
- Lot rent
- −$0
- Vacancy / Maint / Mgmt
- −$547
- Net cashflow
- $56
Break-even live
Sensitivity live
| Price | -10% $240 | -5% $148 | +0% $56 | +5% $-36 | +10% $-128 |
|---|---|---|---|---|---|
| Rent | -10% $-150 | -5% $-47 | +0% $56 | +5% $159 | +10% $261 |
| Rate | -1.0pp $219 | -0.5pp $138 | base $56 | +0.5pp $-28 | +1.0pp $-114 |
UW: 25.0% down · 7.5% · 30yr · 1.5% tax · 5.0% vac · 8.0% maint · 8.0% mgmt
Financing live
Cash to close
- Down payment
- $81,250
- Closing costs
- $9,750
- Reserves months
- —
- Total cash needed
- —
Loan-product check · same deal, 3 products live
Conventional
25% down · 7.5% · 30yr
- Down + closing
- —
- Monthly P&I
- —
- Monthly cashflow
- —
- DSCR
- —
- Eligible?
- —
Personal DTI + credit; lowest rate.
DSCR
20% down · 8.5% · 30yr
- Down + closing
- —
- Monthly P&I
- —
- Monthly cashflow
- —
- DSCR
- —
- Eligible?
- —
No personal income docs; deal must DSCR.
Hard money
10% down · 12.0% · 12mo
- Down + closing
- —
- Monthly P&I
- —
- Monthly cashflow
- —
- DSCR
- —
- Eligible?
- —
Short-term bridge; refi at stabilization.
Rent comps 33 comps
| Address | Beds | Baths | Sqft | Rent | $/sqft | DOM | Units | Dist |
|---|---|---|---|---|---|---|---|---|
| 134 NW Peach St Port Saint Lucie, FL | 3.0 | 2.0 | 1862 | $2,050 | $1.10 | 16d | 1 | 0.28mi |
| 367 NW Aurora St Port Saint Lucie, FL | 2.0 | 1.0 | 940 | $2,050 | $2.18 | 16d | 1 | 0.28mi |
| 507 NW Billiar Ave Port St Lucie, FL | 3.0 | 2.0 | 1249 | $2,350 | $1.88 | 23d | 1 | 0.34mi |
| 365 NW Hibiscus St Port Saint Lucie, FL | 4.0 | 2.0 | 1714 | $4,000 | $2.33 | 25d | 1 | 0.38mi |
| 532 SW Buswell Ave Port Saint Lucie, FL | 4.0 | 2.5 | 1629 | $2,750 | $1.69 | 25d | 1 | 0.41mi |
| 385 NW Broadview St Port Saint Lucie, FL | 2.0 | 2.0 | 1500 | $2,300 | $1.53 | 25d | 1 | 0.48mi |
| 351 SW Buswell Ave Port Saint Lucie, FL | 2.0 | 2.0 | 1234 | $2,200 | $1.78 | 16d | 1 | 0.55mi |
| 632 SW Granadeer St Port Saint Lucie, FL | 3.0 | 2.0 | 1618 | $2,495 | $1.54 | 16d | 1 | 0.65mi |
| 581 NW Cornell Ave Port Saint Lucie, FL | 3.0 | 2.0 | 1035 | $2,600 | $2.51 | 25d | 1 | 0.70mi |
| 574 NW Bayshore Blvd Port Saint Lucie, FL | 4.0 | 2.0 | 1806 | $2,850 | $1.58 | 25d | 1 | 0.76mi |
| 325 NW Ferris Dr Port Saint Lucie, FL | 2.0 | 2.0 | 1100 | $1,900 | $1.73 | 16d | 1 | 0.78mi |
| 185 NW Willow Grove Ave Port Saint Lucie, FL | 2.0 | 2.0 | 1539 | $2,600 | $1.69 | 25d | 1 | 0.89mi |
| 702 NW Orchid St Port Saint Lucie, FL | 3.0 | 2.0 | 1499 | $3,500 | $2.33 | 25d | 1 | 0.95mi |
| 456 SW Prado Ave Port Saint Lucie, FL | 3.0 | 2.0 | 1376 | $2,100 | $1.53 | 16d | 1 | 0.96mi |
| 628 NW Venetto Ct Port Saint Lucie, FL | 2.0 | 2.0 | 1819 | $2,550 | $1.40 | 16d | 1 | 0.96mi |
| 628 NW Venetto Ct Port Saint Lucie, FL | 2.0 | 2.0 | 1819 | $2,650 | $1.46 | 25d | 1 | 0.96mi |
| 554 SW Lakehurst Dr Port Saint Lucie, FL | 3.0 | 2.0 | 1054 | $2,100 | $1.99 | 16d | 1 | 0.98mi |
| 216 NE Mainsail St Port Saint Lucie, FL | 3.0 | 2.0 | 1516 | $2,550 | $1.68 | 23d | 1 | 1.05mi |
| 642 SW Bolin Ct Port Saint Lucie, FL | 3.0 | 2.0 | 1166 | $2,150 | $1.84 | 23d | 1 | 1.06mi |
| 738 SW Ravenswood Ln Port St Lucie, FL | 2.0 | 2.0 | 894 | $2,100 | $2.35 | 23d | 1 | 1.13mi |
| 116 Prima Vista Blvd Unit A Port St. Lucie, FL | 3.0 | 1.0 | 1314 | $2,600 | $1.98 | 25d | 1 | 1.13mi |
| 160 NE Bracken Rd Port Saint Lucie, FL | 3.0 | 2.0 | 1166 | $2,200 | $1.89 | 23d | 1 | 1.22mi |
| 160 NE Bracken Rd Port Saint Lucie, FL | 3.0 | 2.0 | 1166 | $2,200 | $1.89 | 25d | 1 | 1.22mi |
| 151 SE Castana Ct Port Saint Lucie, FL | 3.0 | 2.0 | 1382 | $2,500 | $1.81 | 25d | 1 | 1.25mi |
| 6956 NW Jorgensen Rd Port Saint Lucie, FL | 3.0 | 2.0 | 1358 | $2,500 | $1.84 | 16d | 1 | 1.30mi |
| 1189 SW Broadview St Port Saint Lucie, FL | 2.0 | 2.0 | 988 | $2,200 | $2.23 | 16d | 1 | 1.33mi |
| 271 SW Palm Dr #304 Port Saint Lucie, FL | 2.0 | 2.0 | 1033 | $2,000 | $1.94 | 16d | 1 | 1.37mi |
| 360 NW Shoreline Cir Port Saint Lucie, FL | 2.0 | 2.0 | 1661 | $3,200 | $1.93 | 25d | 1 | 1.38mi |
| 213 NE Prima Vista Blvd Port Saint Lucie, FL | 2.0 | 1.0 | 1012 | $2,000 | $1.98 | 25d | 1 | 1.39mi |
| 107 SE Lucero Dr Port Saint Lucie, FL | 3.0 | 2.0 | 1326 | $2,150 | $1.62 | 23d | 1 | 1.39mi |
| 201 NE Midfield Ln Port Saint Lucie, FL | 2.0 | 2.0 | 1389 | $2,500 | $1.80 | 25d | 1 | 1.39mi |
| 154 SE Selva Ct Port Saint Lucie, FL | 3.0 | 2.0 | 1503 | $3,000 | $2.00 | 25d | 1 | 1.46mi |
| 221 SW Palm Dr #108 Port Saint Lucie, FL | 2.0 | 2.0 | 960 | $2,000 | $2.08 | 16d | 1 | 1.48mi |
Listing history 1 events
-
2026-06-08$325,000 Pending 1 DOM
ⓘ Source: listings_history table (triggers on properties + properties_extension) + one-shot
backfill from property_details.listing_events for pre-trigger history.
Tax reassessment forecast FL · Resets to sale price
- Current annual tax
- $1,927 · $161/mo
- Projected year-2 tax
- $2,698 · $225/mo
- Expected delta
- +$771/yr (+$64/mo · 40.0%)
ⓘ Screening estimate from a state-policy table — verify with the county assessor before closing.
Climate risk First Street
- Flood 3/10 Moderate FEMA zone X (unshaded) · 20% chance over 30 yrs
- Wildfire 1/10 Low
- Heat 10/10 Extreme 7 d/yr ≥106°F today · 24 d/yr by 30 yrs out
- Wind 10/10 Extreme 99% chance of damaging wind over 30 yrs
- Air quality 1/10 Low 0 unhealthy d/yr today · 0 by 30 yrs out
Nearby sold comps map
Loading sold comps map…
Walkable amenities ~0.75 mi
Loading nearby amenities…
Taxation est. · year 1
- Rental income
- $31,233
- − Mortgage interest
- −$18,205
- − Property taxes
- −$1,927
- − Insurance
- −$1,625
- − Repairs & maintenance
- −$2,499
- − Management
- −$2,499
- − Depreciation
- −$9,455
- Taxable loss
- −$4,976
- Est. tax savings @ 24.0%
- +$1,194
- After-tax cash flow
- $1,864/yr
For passive investors: Depreciation is non-cash, so a rental often shows a tax loss while cash-flowing — sheltering income. Rental losses are passive: they offset passive income freely, and up to $25,000/yr can offset ordinary (W-2) income if you actively participate and your MAGI is under $100k (phasing out to $0 by $150k); unused losses carry forward. On sale, claimed depreciation is recaptured at up to 25%, and gains may owe capital-gains tax (a 1031 exchange can defer both). Figures are a year-1 estimate at your 24.0% rate — not tax advice; consult a CPA.
Schools (NCES district)
- District
- St. Lucie
- NCES district ID
- 1201770
- Math proficiency
- 40% ▼ -11.00%
- Reading proficiency
- 48% ▼ -4.00%
- Median HH income
- $44,737
- Composite
- 37.28/100
- National rank
- #4449
- State rank
- #51 of 73 in FL
Livability — Port St. Lucie
No livability data for this city. (Only ~50 U.S. cities are tracked.)
Census & demographics
- Census place
- Port St. Lucie, FL
- County
- Saint Lucie County · 337,150 people
- City population
- 221,051
- Metro
- Port St. Lucie, FL
- Population (ZIP)
- 49,001
- Household income
- $75,489
- Rent vs Own
- Severe rent burden
- 843.0
Population outlook (St. Lucie County) Hauer SSP2
- Today (2025)
- 338,016 people
- By 2030
- 355,687 · +5.2%
- By 2040
- 385,521 · +14.1%
- By 2050
- 406,106 · +20.1%
- By 2075
- 441,054 · +30.5%
- By 2100
- 436,885 · +29.2%
Race, ethnicity, and origin ACS 2023
- Neighborhood character
- Diverse neighborhood (Simpson 0.65)
- Race & ethnicity
- White 51% Hispanic / Latino 23% Black 18% Two or more races 13% Asian 3%
- Hispanic origin (detail)
- Mexican 3% Puerto Rican 9% Cuban 3%
- Common ancestry
- Hispanic 3% Romanian 2% Italian 1%
- Foreign-born
- 19% · Canada, Guatemala, Jamaica
- Languages at home
- 74% English-only · Spanish 15% French/Haitian/Cajun 4% Other Indo-European 2%
Political lean MEDSL · St. Lucie
- 2024 margin
- Lean R (+9.1) · D 45.1% · R 54.2%
- 2008→2024 swing
- -21.2pp toward R · 2008: 12.1pp · 2024: -9.1pp
- All cycles
- 2024: R+9.1 2020: R+1.6 2016: R+2.5 2012: D+7.9 2008: D+12.1
Not yet ingested
- Civics
- —
Market trends
- HPI YoY
- ▼ -209.28%
- Current HPI
- 407.6341
- Rent YoY
- ▲ 1.53%
- Metro
- Port St. Lucie, FL
- State GDP YoY
- ▲ 3.28%
- F500 in state
- 36
Industry mix (Fortune 500 HQ in FL)
| Industry | F500 HQs | Revenue |
|---|---|---|
| Industrial Technology | 2 | $29B |
|
||
| Insurance | 2 | $17B |
|
||
| Retail | 1 | $60B |
|
||
| Technology Distribution | 1 | $58B |
|
||
| Homebuilding | 1 | $35B |
|
||
| Technology Manufacturing | 1 | $35B |
|
||
Price history
+166.4% since first listed5 events — show timeline
- 2026-06-07 Pending — Beaches MLS
- 2026-06-07 Listed $325,000 Beaches MLS
- 2016-09-15 Sold (MLS) $133,000 Beaches MLS
- 2016-07-06 Contingent — Beaches MLS
- 2016-06-24 Listed $122,000 Beaches MLS
Property tax history
+3.0%/yrLatest (2025): $1,927 · +4.3% YoY. Source: county tax records.
Cash-flow waterfall
monthlySold comps — $/sqft
last 12 mo · ≤1 miLoading sold comps…