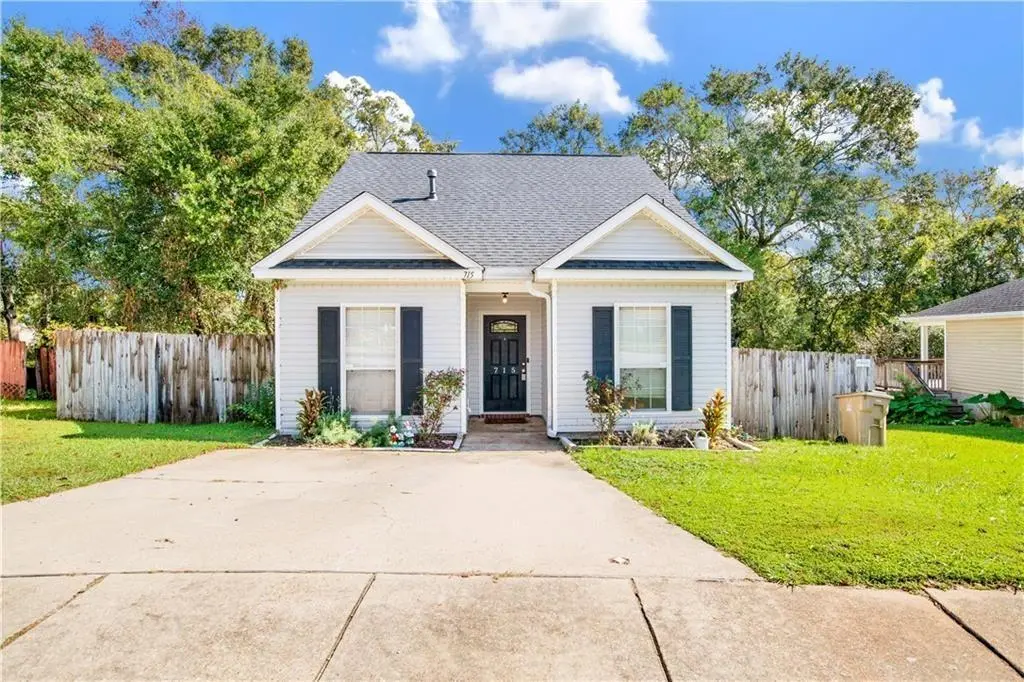
715 Red Willow Ct · Mobile, AL
Flood risk 1/10 · Minimal
- FEMA flood zone
- X (unshaded)
- Chance of flooding over 30 yrs
- 0.0%
- Est. flood insurance / yr
- $507 – $1,088
Fire risk 2/10 · Minimal
- Est. fire insurance / yr
- $916 – $1,700
Heat risk 9/10 · Severe
- Hot days now (above 104°F)
- 7 days/yr
- Hot days in 30 yrs
- 22 days/yr
Wind risk 9/10 · Severe
- Chance of severe wind over 30 yrs
- 99.0%
Air-quality risk 1/10 · Minimal
- Unhealthy air days now
- 0 days/yr
- Unhealthy air days in 30 yrs
- 0 days/yr
Risk factors via First Street. Map © Google.
Why this score? — see what drove the D+ grade
The composite is a weighted blend of 9 inputs, each scored 0–100. Each bar is that input's sub-score; the figure is the points it added to the 100-point composite (weight × sub-score).
- ARV discount +14.0/15.0
- Cash flow +13.7/30.0
- DSCR +4.1/10.0
- Livability +3.8/5.0
- 1% rule +3.3/10.0
- Condition / age +2.5/5.0
- Rent growth +2.4/5.0
- Schools +2.3/10.0
- Appreciation +0.0/10.0
$199,225
🖨 Deal sheet 📄 Offer letter ✓ Due diligence
Listing remarks MLS
This home is like being on a retreat as it backs up to a tranquil wooded area. It has very open floorplan and lovely deck. The primary bedroom is down with a large walk-in closet. The other two bedrooms are upstairs with a bath between them. There is a half bath down stairs off the kitchen. Hurry! This home won't last long on the market. It is conveniently located to shopping, restaurants, a theatre and more.
Key facts
- Huge walk-in closet
- Private bath
- Granite countertops
Tags
Property features AI
Finance
- HOA & community: Annual association fee of $150
Exterior
- Parking: Driveway with level access
- Utilities: Cable available; Electricity available (110V and 220V); Underground utilities; Public sewer
- Home design: Single-family residence; Residential property
- Construction: Wood siding; Shingle roof; Slab foundation; Built in 2003; Insulated windows with shutters
- Exterior features: Storage; Back yard with wood fencing; View
Interior
- Kitchen: Dishwasher; Electric oven; Breakfast bar; Eat-in kitchen; Kitchen open to family room / view to family room
- Bedrooms: 3 bedrooms
- Flooring: Ceramic tile; Laminate
- Bathrooms: 2 full bathrooms; 1 half bathroom
- Heating & cooling: Central heating; Central air; Ceiling fans
- Interior features: Walk-in closets; Open view from kitchen to family room; Breakfast bar and eat-in kitchen
Neighborhood map
What this means for you Summary
Snapshot
- This is a 3-bed/2.5-bath single-family listed at $199k.
Deal economics
- At list price, monthly cash flow is $15 ($179/yr) — positive.
- The deal already cash-flows at list — no discount required.
- To meet the 1% rule (rent ≥ 1% of price), the offer needs to be $164k (17.4% below list).
- Recommended offer: $164k (17.4% below list) — sets the bar for 1% rule.
- Cap rate 6.4% vs local median 4.9% in Mobile — top-decile yield for the area; either an underpriced asset or a hidden risk that comps aren't pricing in. Stress-test before assuming the spread holds.
Location & tenants
- Location reads 75/100 on livability (#20 in AL, #4,262 nationally) — a middle-class / working-renter tenant base. Strengths: commute A+, cost of living A+, housing A+; Watch: crime F, employment D-.
- Mobile County (urban): math 15% / reading 39% proficiency, ranked #81 of 129 in AL (top 63%) — low school quality limits family demand, transient renter base, plan for 1-2y turnover; 67% free/reduced lunch — lower-income household profile, screen leases tightly.
- Zoned schools: Baker High School (math 25% / reading 28%, grade F, #107 of 305 statewide, top 36%, 2,491 students, 42% FRL) — zoned schools average 42% FRL vs 67% district-wide (26 pts lower); this property's tenant base skews higher-income than the district average.
- Market conditions: Rents soft (-0.4%/yr); 551 active listings in the ZIP; 15 comparable units currently listed for rent nearby; rentals at typical pace (median 21d on market — plan ~3-4 weeks tenant-placement turnaround); solid renter incomes; 1,678 units permitted in Mobile County in 2024 (264 in 5+ unit buildings).
Forward outlook
- Local home prices are declining (-3.0%/yr); year-one equity from $1k of loan paydown is wiped out by about $6k of value loss. Plan a longer hold.
- Mobile County population projected to shrink 8% by 2050 — rents likely to lag national; underwrite the cash flow, not the appreciation.
Negotiation context
- It's been on market 19 days — a 2% lower offer ($196k) is reasonable based on typical stale-listing flexibility.
- Current owner paid $163k; 22% above their basis — modest negotiation headroom, anchor on the comps not their cost.
Risks & watch-outs
- Climate carrying-cost: severe wind risk, 99% chance of damaging wind over 30y; extreme-heat days projected 7→22/yr by 2055 (HVAC capex compounding) — expect insurance premiums to compound above CPI over the hold.
Questions for the listing agent
- What does the HOA fee cover, when was the last increase, and are there any pending special assessments or reserve-fund shortfalls?
- Is there a deadline driving the sale (1031 exchange, divorce, estate, relocation)? That informs how much negotiation room exists.
- Schools are D-rated, which usually means shorter tenancies and higher turnover. Who's the typical renter profile here, and what's been the actual vacancy rate?
- Crime grade is F in this area — have there been break-ins, vandalism, or insurance claims at this property in the last 3 years? What carrier currently insures it and at what premium?
- The area grade is low — what's the realistic commute time and amenity access for the typical tenant pool here? Any planned neighborhood developments (good or bad) we should know about?
- What's the average days-on-market for RENTAL listings here right now (not sales)? A rising rental-DOM trend means longer vacancies and softer asking-rent achievability than the comps imply.
- What's the recent tenant-quality profile in this submarket — average credit score on applications, eviction rate, late-payment / NSF rate, and stable-employment percentage? A property-management company in the area should have these aggregated.
- How much new for-sale + rental construction is in the pipeline within 1–3 miles? Heavy new supply typically softens prices + rents 12–24 months out; constrained supply supports both.
Investment metrics
- 1% rule
- 0.83% ✗
- Cap rate
- 6.38%
- Cash-on-cash
- 0.32%
- DSCR
- 1.01
- GRM
- 10.1
CMA / ARV
- ARV (on-the-fly)
- $233,120
- Comps found
- 12
Show comp detail 12 sales within ~0.75 mi
| Address | Dist | Beds/Ba | Sqft | Sold | Price | $/sf | Match |
|---|---|---|---|---|---|---|---|
| 314 Spring Lake Dr N | 0.14mi | 3/2.0 | 1,311 (-10%) | 0mo | $210,000 | $160 | 74 |
| 7354 N Willow Pointe Dr | 0.10mi | 3/2.0 | 1,275 (-12%) | 3mo | $190,000 | $149 | 70 |
| 7381 Willow Bridge Dr S | 0.25mi | 3/2.0 | 1,357 (-7%) | 8mo | $208,900 | $154 | 68 |
| 793 Willow Pointe Dr E | 0.09mi | 3/2.0 | 1,318 (-10%) | 12mo | $220,000 | $167 | 67 |
| 7351 Willow Pointe Dr | 0.09mi | 3/2.0 | 1,246 (-14%) | 7mo | $199,900 | $160 | 64 |
| 7336 Hawkins Mnr S | 0.53mi | 3/2.0 | 1,585 (+9%) | 4mo | $313,900 | $198 | 56 |
| 605 Lakeview Woods Dr | 0.24mi | 3/2.0 | 1,646 (+13%) | 12mo | $240,000 | $146 | 55 |
| 340 E Portside Ct | 0.56mi | 3/2.0 | 1,553 (+7%) | 7mo | $235,000 | $151 | 55 |
| 7402 Hawkins Mnr W | 0.46mi | 3/2.0 | 1,585 (+9%) | 13mo | $311,066 | $196 | 51 |
| 7340 Portside Ct | 0.69mi | 3/2.0 | 1,423 (-2%) | 14mo | $210,000 | $148 | 51 |
| 7319 Hawkins Mnr N | 0.54mi | 3/2.0 | 1,585 (+9%) | 12mo | $313,525 | $198 | 48 |
| 285 Portside Blvd | 0.64mi | 3/2.0 | 1,650 (+13%) | 11mo | $219,000 | $133 | 37 |
Match score weights: distance 35% · size 25% · config 20% · recency 20%. Top-matched comps best support the ARV.
Projected returns pro-forma
-3.0% appreciation · 0.0% rent growth · sell at horizon
- IRR
- -19.0%
- Equity multiple
- 0.35×
- Total profit
- $-36,183
- Equity at exit
- $29,705
- IRR
- -18.7%
- Equity multiple
- 0.12×
- Total profit
- $-49,041
- Equity at exit
- $17,225
Cash invested: $55,783 (down + closing). Projections, not guarantees.
Landlord ↔ Tenant lean methodology
- Overall (STATE)
- 90 Strongly Landlord-Friendly
- State Alabama
- 90 Strongly Landlord-Friendly · R+15
- County
- — inherits STATE
- City
- — inherits STATE
ZIP-level market 36695
- Home prices YoY
- -30.9%
- Rents YoY
- -0.4%
- Active inventory
- 551
- Price-to-rent
- 10.1×
Monthly cashflow live
- Estimated rent
- $1,645 high interval (Pro) →
- Mortgage (P&I)
- −$1,045
- Tax from tax record
- −$144 /mo · $1,726/yr
- Insurance
- −$83
- HOA
- −$13
- Vacancy / Maint / Mgmt
- −$345
- Net cashflow
- $15
Break-even live
UW: 25.0% down · 7.5% · 30yr · 1.5% tax · 5.0% vac · 8.0% maint · 8.0% mgmt
Financing live
Cash to close
- Down payment
- $49,806
- Closing costs
- $5,977
- Reserves months
- —
- Total cash needed
- —
Loan-product check · same deal, 3 products live
Conventional
25% down · 7.5% · 30yr
- Down + closing
- —
- Monthly P&I
- —
- Monthly cashflow
- —
- DSCR
- —
- Eligible?
- —
Personal DTI + credit; lowest rate.
DSCR
20% down · 8.5% · 30yr
- Down + closing
- —
- Monthly P&I
- —
- Monthly cashflow
- —
- DSCR
- —
- Eligible?
- —
No personal income docs; deal must DSCR.
Hard money
10% down · 12.0% · 12mo
- Down + closing
- —
- Monthly P&I
- —
- Monthly cashflow
- —
- DSCR
- —
- Eligible?
- —
Short-term bridge; refi at stabilization.
Rent comps 15 comps
| Address | Beds | Baths | Sqft | Rent | $/sqft | DOM | Units | Dist |
|---|---|---|---|---|---|---|---|---|
| 668 Willow Pointe Dr Mobile, AL | 2.0 | 2.0 | 1029 | $1,750 | $1.70 | 43d | 1 | 0.21mi |
| 668 Willow Pointe Dr Mobile, AL | 2.0 | 2.0 | 1029 | $1,650 | $1.60 | 21d | 1 | 0.21mi |
| 7380 Hitt Rd Mobile, AL | 1.0–3.0 | 1.0–2.0 | 892 | $1,357 | $1.52 | 13d | 13 | 0.35mi |
| 945 Schillinger Rd S Mobile, AL | 2.0–3.0 | 2.0–2.5 | 1809 | $2,300 | $1.27 | 43d | 1 | 0.72mi |
| 7601 Airport Blvd Mobile, AL | 2.0–4.0 | 2.0 | 1082 | $1,188 | $1.10 | 13d | 5 | 0.81mi |
| 1 Country Ln Mobile, AL | 1.0–2.0 | 1.0 | 850 | $1,221 | $1.44 | 13d | 10 | 0.92mi |
| 6700 Wall St Mobile, AL | 2.0–3.0 | 1.0–2.0 | 1231 | $1,571 | $1.28 | 13d | 6 | 0.92mi |
| 1313 Schillinger Rd S Mobile, AL | 1.0–3.0 | 1.0–2.0 | 1022 | $1,651 | $1.62 | 13d | 7 | 1.02mi |
| 6427 Airport Blvd Mobile, AL | 2.0–3.0 | 2.0–2.5 | 1214 | $1,537 | $1.27 | 43d | 10 | 1.13mi |
| 700 Bonneville Dr Mobile, AL | 3.0 | 2.0 | 1196 | $1,600 | $1.34 | 13d | 1 | 1.13mi |
| 101 Foreman Rd Mobile, AL | 1.0–3.0 | 1.0–2.0 | 835 | $1,279 | $1.53 | 43d | 9 | 1.15mi |
| 6701 Dickens Ferry Rd #30 Mobile, AL | 3.0 | 2.5 | 1342 | $1,395 | $1.04 | 21d | 1 | 1.23mi |
| 176 2nd Ave Mobile, AL | 3.0 | 1.0 | 1056 | $895 | $0.85 | 21d | 1 | 1.36mi |
| 6601 Old Shell Rd Unit 3 Mobile, AL | 2.0 | 1.0 | 950 | $975 | $1.03 | 21d | 1 | 1.39mi |
| 6474B Cedar Bend Ct Mobile, AL | 2.0 | 2.0 | 1444 | $1,600 | $1.11 | 43d | 1 | 1.40mi |
HOA detail
- Monthly dues
- $13 · $156/yr
Listing history 16 events
-
2026-06-18days on market $199,225 Active 19 DOM
-
2026-06-17days on market $199,225 Active 18 DOM
-
2026-06-16days on market $199,225 Active 17 DOM
-
2026-06-15days on market $199,225 Active 16 DOM
-
2026-06-14days on market $199,225 Active 14 DOM
-
2026-06-13days on market $199,225 Active 13 DOM
-
2026-06-10days on market $199,225 Active 11 DOM
-
2026-06-09days on market $199,225 Active 10 DOM
-
2026-06-08days on market $199,225 Active 9 DOM
-
2026-06-07days on market $199,225 Active 8 DOM
-
2026-06-05days on market $199,225 Active 5 DOM
-
2026-06-03days on market $199,225 Active 4 DOM
-
2026-06-02days on market $199,225 Active 3 DOM
-
2026-06-01days on market $199,225 Active 2 DOM
-
2026-05-31remarks 687-char remark
-
2026-05-31$199,225 Active 1 DOM
ⓘ Source: listings_history table (triggers on properties + properties_extension) + one-shot
backfill from property_details.listing_events for pre-trigger history.
Tax reassessment forecast AL · Resets to sale price
- Current annual tax
- $1,726 · $144/mo
- Projected year-2 tax
- $1,726 · $144/mo
- Expected delta
- $0/yr ($0/mo · 0.0%)
ⓘ Screening estimate from a state-policy table — verify with the county assessor before closing.
Climate risk First Street
- Flood 1/10 Low FEMA zone X (unshaded) · 0% chance over 30 yrs
- Wildfire 2/10 Low
- Heat 9/10 Extreme 7 d/yr ≥104°F today · 22 d/yr by 30 yrs out
- Wind 9/10 Extreme 99% chance of damaging wind over 30 yrs
- Air quality 1/10 Low 0 unhealthy d/yr today · 0 by 30 yrs out
Nearby sold comps map
Loading sold comps map…
Walkable amenities ~0.75 mi
Loading nearby amenities…
Taxation est. · year 1
- Rental income
- $19,740
- − Mortgage interest
- −$11,160
- − Property taxes
- −$1,726
- − Insurance
- −$996
- − Repairs & maintenance
- −$1,579
- − Management
- −$1,579
- − HOA
- −$156
- − Depreciation
- −$5,796
- Taxable loss
- −$3,252
- Est. tax savings @ 24.0%
- +$780
- After-tax cash flow
- $960/yr
For passive investors: Depreciation is non-cash, so a rental often shows a tax loss while cash-flowing — sheltering income. Rental losses are passive: they offset passive income freely, and up to $25,000/yr can offset ordinary (W-2) income if you actively participate and your MAGI is under $100k (phasing out to $0 by $150k); unused losses carry forward. On sale, claimed depreciation is recaptured at up to 25%, and gains may owe capital-gains tax (a 1031 exchange can defer both). Figures are a year-1 estimate at your 24.0% rate — not tax advice; consult a CPA.
Schools (NCES district)
- District
- Mobile County
- NCES district ID
- 0102370
- Math proficiency
- 15% ▼ -28.00%
- Reading proficiency
- 39% ▬ 0.00%
- Median HH income
- $42,455
- Composite
- 22.9/100
- National rank
- #8002
- State rank
- #81 of 129 in AL
Livability — Mobile
- Score
- 75/100
- State rank
- #20
- US rank
- #4262
Category grades
Schools grade is shown separately in the Schools card above.
Census & demographics
- County
- Mobile County · 246,577 people
- City population
- 205,729
- Metro
- Mobile, AL
- Population (ZIP)
- 52,690
- Household income
- $76,040
- Rent vs Own
- Severe rent burden
- 1619.0
Population outlook (Mobile County) Hauer SSP2
- Today (2025)
- 415,303 people
- By 2030
- 411,755 · -0.9%
- By 2040
- 399,670 · -3.8%
- By 2050
- 382,616 · -7.9%
- By 2075
- 337,353 · -18.8%
- By 2100
- 283,391 · -31.8%
Race, ethnicity, and origin ACS 2023
- Neighborhood character
- Predominantly White (67%)
- Race & ethnicity
- White 67% Black 23% Two or more races 5% Hispanic / Latino 5% Asian 2%
- Common ancestry
- Lithuanian 3% Italian 2% Slovak 1%
- Foreign-born
- 5% · Canada, Vietnam, China
- Languages at home
- 94% English-only · Spanish 2% Vietnamese 1% Arabic 1%
Political lean MEDSL · Mobile
- 2024 margin
- R (+16.4) · D 41.3% · R 57.7%
- 2008→2024 swing
- -7.7pp toward R · 2008: -8.7pp · 2024: -16.4pp
- All cycles
- 2024: R+16.4 2020: R+11.9 2016: R+13.9 2012: R+9.3 2008: R+8.7
Not yet ingested
- Civics
- —
Market trends
- HPI YoY
- ▼ -86.28%
- Current HPI
- 193.1651
- Rent YoY
- ▼ -0.41%
- Metro
- Mobile, AL
- State GDP YoY
- ▲ 2.94%
- F500 in state
- 4
Industry mix (Fortune 500 HQ in AL)
| Industry | F500 HQs | Revenue |
|---|---|---|
| Financial Services | 1 | $8B |
|
||
| Healthcare | 1 | $5B |
|
||
Price history
+58.7% since first listed4 events — show timeline
- 2026-05-31 Listed $199,225 GCMLS AL
- 2021-04-28 Sold (Public Records) $163,000 Public Records
- 2021-04-23 Sold (MLS) $163,000 GCMLS AL
- 2006-09-01 Sold (Public Records) $125,500 Public Records
Property tax history
+13.0%/yrLatest (2025): $1,726 · +7.0% YoY. Source: county tax records.
Cash-flow waterfall
monthlySold comps — $/sqft
last 12 mo · ≤1 miLoading sold comps…