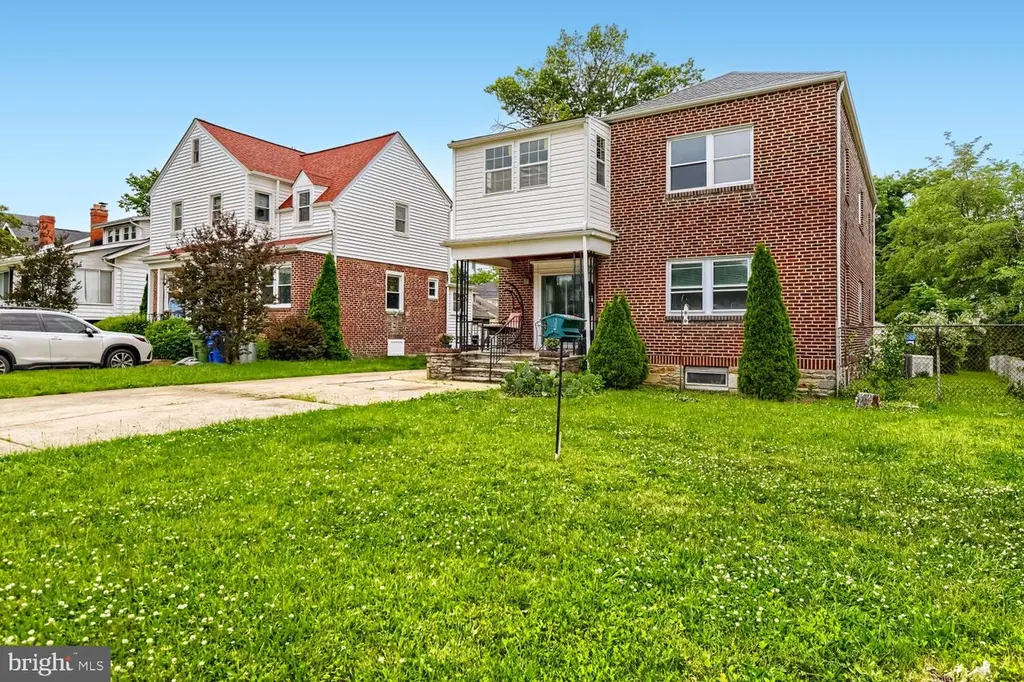
3808 Callaway Ave · Baltimore, MD
Flood risk 1/10 · Minimal
- FEMA flood zone
- X (unshaded)
- Chance of flooding over 30 yrs
- 0.0%
- Est. flood insurance / yr
- $473 – $860
Fire risk 1/10 · Minimal
- Est. fire insurance / yr
- $755 – $1,403
Heat risk 7/10 · Major
- Hot days now (above 104°F)
- 7 days/yr
- Hot days in 30 yrs
- 15 days/yr
Wind risk 5/10 · Moderate
- Chance of severe wind over 30 yrs
- 23.0%
Air-quality risk 3/10 · Minor
- Unhealthy air days now
- 3 days/yr
- Unhealthy air days in 30 yrs
- 4 days/yr
Risk factors via First Street. Map © Google.
Why this score? — see what drove the C grade
The composite is a weighted blend of 9 inputs, each scored 0–100. Each bar is that input's sub-score; the figure is the points it added to the 100-point composite (weight × sub-score).
- Cash flow +22.1/30.0
- ARV discount +15.0/15.0
- DSCR +7.1/10.0
- 1% rule +4.9/10.0
- Livability +3.8/5.0
- Rent growth +3.1/5.0
- Condition / age +2.5/5.0
- Schools +1.0/10.0
- Appreciation +0.0/10.0
$299,900
🖨 Deal sheet (PDF) 📄 Offer letter ✓ Due diligence
Listing remarks
Exceptionally large greater Ashburton single-family home offering approximately 3,900 finished square feet, an impressive finished lower-level in-law suite, and a flexible layout that is hard to find. Currently arranged with five bedrooms and three full baths, the home could potentially be reconfigured to create up to seven bedrooms, making it a great fit for large households, multi-generational living, guests, home offices, or buyers who simply need more space. The main level features a bright office/study, separate dining room, large living room with fireplace, convenient main-level bedroom, adjacent full bath, hardwood flooring, classic crown molding, French doors, and wide openings. The
Key facts
- Updated appliances
- Separate dining room
- Bright office/study
Tags
Property features AI
Finance
- Other: Fee simple ownership; Ground rent paid annually
Exterior
- Parking: Detached front-entry garage (2 garage spaces); Asphalt and concrete driveway with about 6 driveway spaces; On-street parking; Total of about 8 parking spaces
- Utilities: Public water; Public sewer; Natural gas hot water; Electric service (200+ amp)
- Home design: Detached structure; Very good condition; Effective renovation in 2014; Year built recorded by assessor
- Construction: Brick construction; Brick/mortar foundation; Asphalt shingle roof; Double-hung wood-frame windows with screens and storm windows
- Exterior features: Front yard, rear yard and side yards with landscaping; Porches and balcony; Shed on property; Not in a federal flood zone
Interior
- Kitchen: Dishwasher; Disposal; Built-in microwave; Oven (single) with self-cleaning; Refrigerator; Stainless steel appliances; Exhaust fan
- Bedrooms: Two bedrooms on the main level; Two bedrooms on the upper level; One bedroom on the lower level
- Flooring: Hardwood floors; Ceramic tile
- Bathrooms: Three full bathrooms (one on main level, one on upper level, one on lower level)
- Heating & cooling: Central heating; Central air conditioning; Heat pump(s); Ceiling fans; Electric heating and cooling; 200+ amp electric service; 60+ gallon natural gas hot water tank
- Interior features: Ceiling fans; Built-ins; Tub with shower; Drywall walls and ceilings; Six-panel and storm doors; Fully finished basement with outside entrance and connecting stairway; Brick fireplace with glass doors and wood-burning equipment (1 fireplace)
- Laundry & utility: Washer and dryer; Laundry areas on main floor, upper floor, and basement
Neighborhood map
What this means for you Summary
Snapshot
- This is a 5-bed/2.5-bath single-family listed at $300k.
Deal economics
- At list price, monthly cash flow is $485 ($6k/yr) — positive.
- The deal already cash-flows at list — no discount required.
- To meet the 1% rule (rent ≥ 1% of price), the offer needs to be $297k (0.8% below list).
- Recommended offer: $297k (0.8% below list) — sets the bar for 1% rule.
- Cap rate 8.2% vs local median 6.0% in Baltimore — top-decile yield for the area; either an underpriced asset or a hidden risk that comps aren't pricing in. Stress-test before assuming the spread holds.
Location & tenants
- Location reads 76/100 on livability (#90 in MD, #3,396 nationally) — a middle-class / working-renter tenant base. Strengths: amenities A+, commute A+, housing A+; Watch: schools D, crime F.
- Baltimore City Public Schools (urban): math 7% / reading 16% proficiency, ranked #24 of 24 in MD (top 100%) — low school quality limits family demand, transient renter base, plan for 1-2y turnover; 79% free/reduced lunch — lower-income household profile, screen leases tightly.
- Market conditions: Rents rising (+2.4%/yr); 351 active listings in the ZIP; 3 comparable units currently listed for rent nearby; rentals lingering (median 44d on market — plan ~5-8 weeks vacancy on turnover, expect pricing pressure); 67% of comp listings sitting > 30 days — soft ceiling on asking rent; 1,273 units permitted in Baltimore city in 2024 (1,104 in 5+ unit buildings).
- At $2,975/mo this rent would consume 69% of the median local household income ($52k/yr) (locally 3644% of renters already pay >50% of income on rent) — very limited rent-growth headroom before tenants either downsize or default.
Forward outlook
- Local home prices are declining (-3.0%/yr); year-one equity from $2k of loan paydown is wiped out by about $9k of value loss. Plan a longer hold.
- Baltimore County population projected to shrink 4% by 2050 — rents likely to lag national; underwrite the cash flow, not the appreciation.
Negotiation context
- Only 3 days on market — expect competitive offers; lowballing is unlikely to land.
- 9 sale attempts since 13y ago with the ask held roughly flat each time — persistent listings suggest the price (not the market) is what's stuck; bring a comps-based counter.
- Current owner paid $105k; list at $300k implies a 186% gain — meaningful room to come down on a strong offer.
Risks & watch-outs
- Watch-outs: built in 1936 — expect roof / HVAC / electrical / plumbing capex.
- Climate carrying-cost: moderate wind risk, 23% chance of damaging wind over 30y; extreme-heat days projected 7→15/yr by 2055 (HVAC capex compounding) — expect insurance premiums to compound above CPI over the hold.
Questions for the listing agent
- Built in 1936 — when were the roof, HVAC, electrical panel, plumbing, and water heater last replaced?
- Is there a deadline driving the sale (1031 exchange, divorce, estate, relocation)? That informs how much negotiation room exists.
- Schools are D-rated, which usually means shorter tenancies and higher turnover. Who's the typical renter profile here, and what's been the actual vacancy rate?
- Crime grade is F in this area — have there been break-ins, vandalism, or insurance claims at this property in the last 3 years? What carrier currently insures it and at what premium?
- What's the average days-on-market for RENTAL listings here right now (not sales)? A rising rental-DOM trend means longer vacancies and softer asking-rent achievability than the comps imply.
- What's the recent tenant-quality profile in this submarket — average credit score on applications, eviction rate, late-payment / NSF rate, and stable-employment percentage? A property-management company in the area should have these aggregated.
- How much new for-sale + rental construction is in the pipeline within 1–3 miles? Heavy new supply typically softens prices + rents 12–24 months out; constrained supply supports both.
Investment metrics
- 1% rule
- 0.99% ✗
- Cap rate
- 8.23%
- Cash-on-cash
- 6.93%
- DSCR
- 1.31
- GRM
- 8.4
CMA / ARV
- ARV (on-the-fly)
- $421,940
- Comps found
- 12
Show comp detail 12 sales within ~0.75 mi
| Address | Dist | Beds/Ba | Sqft | Sold | Price | $/sf | Match |
|---|---|---|---|---|---|---|---|
| 3704 Egerton Rd | 0.32mi | 4/3.5 (-1) | 3,050 (+6%) | 1mo | $426,500 | $140 | 66 |
| 3703 Egerton Rd | 0.35mi | 5/4.5 | 3,051 (+6%) | 3mo | $479,900 | $157 | 64 |
| 3714 W Cold Spring Ln | 0.27mi | 5/3.0 | 2,566 (-11%) | 6mo | $318,000 | $124 | 62 |
| 3817 Copley Rd | 0.13mi | 6/4.0 (+1) | 3,297 (+14%) | 1mo | $372,000 | $113 | 58 |
| 3923 Fairview Ave | 0.72mi | 5/3.0 | 2,788 (-4%) | 1mo | $360,000 | $129 | 58 |
| 3504 Callaway Ave | 0.23mi | 5/4.5 | 3,314 (+15%) | 5mo | $400,000 | $121 | 52 |
| 3415 Springdale Ave | 0.62mi | 6/3.5 (+1) | 2,737 (-5%) | 2mo | $443,500 | $162 | 51 |
| 4403 White Oak Ave | 0.44mi | 5/3.0 | 2,498 (-14%) | 7mo | $365,000 | $146 | 49 |
| 3514 Fairview Ave | 0.62mi | 5/4.5 | 3,143 (+9%) | 2mo | $515,000 | $164 | 47 |
| 3710 W Forest Park Ave | 0.46mi | 6/4.5 (+1) | 3,300 (+14%) | 4mo | $520,000 | $158 | 39 |
| 4115 Boarman Ave | 0.65mi | 4/3.5 (-1) | 2,504 (-13%) | 2mo | $375,000 | $150 | 36 |
| 3417 Springdale Ave | 0.62mi | 5/5.5 | 3,261 (+13%) | 3mo | $459,581 | $141 | 36 |
Match score weights: distance 35% · size 25% · config 20% · recency 20%. Top-matched comps best support the ARV.
Projected returns pro-forma
-3.0% appreciation · 2.41% rent growth · sell at horizon
- IRR
- -6.3%
- Equity multiple
- 0.77×
- Total profit
- $-19,528
- Equity at exit
- $44,716
- IRR
- 2.6%
- Equity multiple
- 1.18×
- Total profit
- $15,339
- Equity at exit
- $25,930
Cash invested: $83,972 (down + closing). Projections, not guarantees.
Landlord ↔ Tenant lean methodology
- Overall (CITY)
- 12 Strongly Tenant-Friendly
- State Maryland
- 27 Tenant-Leaning · D+14
- County
- — inherits STATE
- City Baltimore
- 12 Strongly Tenant-Friendly · D+58
ZIP-level market 21215
- Rents YoY
- 2.4%
- Active inventory
- 351
- Price-to-rent
- 8.4×
Monthly cashflow live
- Estimated rent
- $2,975 medium interval (Pro) →
- Mortgage (P&I)
- −$1,573
- Tax from tax record
- −$167 /mo · $2,007/yr
- Insurance
- −$125
- HOA
- −$0
- Vacancy / Maint / Mgmt
- −$625
- Net cashflow
- $485
Break-even live
Sensitivity live
| Price | -10% $655 | -5% $570 | +0% $485 | +5% $400 | +10% $316 |
|---|---|---|---|---|---|
| Rent | -10% $250 | -5% $368 | +0% $485 | +5% $603 | +10% $720 |
| Rate | -1.0pp $636 | -0.5pp $562 | base $485 | +0.5pp $408 | +1.0pp $329 |
UW: 25.0% down · 7.5% · 30yr · 1.5% tax · 5.0% vac · 8.0% maint · 8.0% mgmt
Financing live
Cash to close
- Down payment
- $74,975
- Closing costs
- $8,997
- Reserves months
- —
- Total cash needed
- —
Loan-product check · same deal, 3 products live
Conventional
25% down · 7.5% · 30yr
- Down + closing
- —
- Monthly P&I
- —
- Monthly cashflow
- —
- DSCR
- —
- Eligible?
- —
Personal DTI + credit; lowest rate.
DSCR
20% down · 8.5% · 30yr
- Down + closing
- —
- Monthly P&I
- —
- Monthly cashflow
- —
- DSCR
- —
- Eligible?
- —
No personal income docs; deal must DSCR.
Hard money
10% down · 12.0% · 12mo
- Down + closing
- —
- Monthly P&I
- —
- Monthly cashflow
- —
- DSCR
- —
- Eligible?
- —
Short-term bridge; refi at stabilization.
Rent comps 3 comps
| Address | Beds | Baths | Sqft | Rent | $/sqft | DOM | Units | Dist |
|---|---|---|---|---|---|---|---|---|
| 4029 Fairview Ave Baltimore, MD | 5.0 | 4.5 | 2653 | $3,200 | $1.21 | 44d | 1 | 0.79mi |
| 2510 Roslyn Ave Baltimore, MD | 6.0 | 5.0 | 2663 | $4,200 | $1.58 | 44d | 1 | 1.04mi |
| 3030 Windsor Ave Baltimore, MD | 4.0 | 1.5 | 2124 | $1,995 | $0.94 | 5d | 1 | 1.42mi |
Listing history 3 events
-
2026-06-07statusdays on market $299,900 Pending 3 DOM
-
2026-06-04remarks 699-char remark
-
2026-06-04$299,900 Active 1 DOM
ⓘ Source: listings_history table (triggers on properties + properties_extension) + one-shot
backfill from property_details.listing_events for pre-trigger history.
Tax reassessment forecast MD · Partial reset (capped growth)
- Current annual tax
- $2,007 · $167/mo
- Projected year-2 tax
- $2,638 · $220/mo
- Expected delta
- +$631/yr (+$53/mo · 31.4%)
ⓘ Screening estimate from a state-policy table — verify with the county assessor before closing.
Climate risk First Street
- Flood 1/10 Low FEMA zone X (unshaded) · 0% chance over 30 yrs
- Wildfire 1/10 Low
- Heat 7/10 Severe 7 d/yr ≥104°F today · 15 d/yr by 30 yrs out
- Wind 5/10 Major 23% chance of damaging wind over 30 yrs
- Air quality 3/10 Moderate 3 unhealthy d/yr today · 4 by 30 yrs out
Nearby sold comps map
Loading sold comps map…
Walkable amenities ~0.75 mi
Loading nearby amenities…
Taxation est. · year 1
- Rental income
- $35,699
- − Mortgage interest
- −$16,799
- − Property taxes
- −$2,007
- − Insurance
- −$1,500
- − Repairs & maintenance
- −$2,856
- − Management
- −$2,856
- − Depreciation
- −$8,724
- Taxable income
- $957
- Est. tax owed @ 24.0%
- −$230
- After-tax cash flow
- $5,594/yr
For passive investors: Depreciation is non-cash, so a rental often shows a tax loss while cash-flowing — sheltering income. Rental losses are passive: they offset passive income freely, and up to $25,000/yr can offset ordinary (W-2) income if you actively participate and your MAGI is under $100k (phasing out to $0 by $150k); unused losses carry forward. On sale, claimed depreciation is recaptured at up to 25%, and gains may owe capital-gains tax (a 1031 exchange can defer both). Figures are a year-1 estimate at your 24.0% rate — not tax advice; consult a CPA.
Schools (NCES district)
- District
- Baltimore City Public Schools
- NCES district ID
- 2400090
- Math proficiency
- 7% ▼ -9.00%
- Reading proficiency
- 16% ▼ -5.00%
- Median HH income
- $42,108
- Composite
- 10.08/100
- National rank
- #9805
- State rank
- #24 of 24 in MD
Livability — Baltimore
- Score
- 76/100
- State rank
- #90
- US rank
- #3396
Category grades
Schools grade is shown separately in the Schools card above.
Census & demographics
- Census place
- Baltimore, MD
- County
- Baltimore City · 558,601 people
- City population
- 588,727
- Metro
- Baltimore-Columbia-Towson, MD
- Population (ZIP)
- 52,229
- Household income
- $51,587
- Rent vs Own
- Severe rent burden
- 3644.0
Population outlook (Baltimore County) Hauer SSP2
- Today (2025)
- 624,249 people
- By 2030
- 621,541 · -0.4%
- By 2040
- 609,756 · -2.3%
- By 2050
- 597,249 · -4.3%
- By 2075
- 552,236 · -11.5%
- By 2100
- 513,934 · -17.7%
Race, ethnicity, and origin ACS 2023
- Neighborhood character
- Predominantly Black (73%)
- Race & ethnicity
- Black 73% White 17% Hispanic / Latino 5% Two or more races 4% Asian 1%
- Common ancestry
- Scotch-Irish 2% Romanian 2% Italian 1%
- Foreign-born
- 9% · Canada, South Korea
- Languages at home
- 91% English-only · Spanish 4% French/Haitian/Cajun 1% Other Indo-European 1%
Political lean MEDSL · Baltimore
- 2024 margin
- Solid D (+73.0) · D 85.2% · R 12.2% · Other 2.6%
- 2008→2024 swing
- -2.5pp toward R · 2008: 75.5pp · 2024: 73.0pp
- All cycles
- 2024: D+73.0 2020: D+76.6 2016: D+74.6 2012: D+76.4 2008: D+75.5
Not yet ingested
- Civics
- —
Market trends
- HPI YoY
- ▼ -318.58%
- Current HPI
- 291.4926
- Rent YoY
- ▲ 2.41%
- Metro
- Baltimore-Columbia-Towson, MD
- State GDP YoY
- ▲ 2.97%
- F500 in state
- 12
Industry mix (Fortune 500 HQ in MD)
| Industry | F500 HQs | Revenue |
|---|---|---|
| Aerospace / Defense | 1 | $71B |
|
||
| Utilities | 1 | $25B |
|
||
| Hotels | 1 | $24B |
|
||
| Consumer Goods | 1 | $7B |
|
||
| Real Estate | 1 | $6B |
|
||
| Chemicals | 1 | $2B |
|
||
Price history
+86.4% since first listed34 events — show timeline
- 2026-06-03 Listed $299,900 BRIGHT MLS
- 2025-01-24 Listing Removed — BRIGHT MLS
- 2024-12-10 Price Changed $320,750 BRIGHT MLS
- 2024-10-22 Price Changed $331,712 BRIGHT MLS
- 2024-10-07 Price Changed $337,712 BRIGHT MLS
- 2024-09-22 Price Changed $343,721 BRIGHT MLS
- 2024-07-07 Relisted — BRIGHT MLS
- 2024-06-26 Listing Removed — BRIGHT MLS
- 2024-06-26 Relisted — BRIGHT MLS
- 2024-06-07 Pending — BRIGHT MLS
- 2024-05-29 Contingent — BRIGHT MLS
- 2024-05-27 Price Changed $347,217 BRIGHT MLS
- 2024-05-15 Price Changed $337,100 BRIGHT MLS
- 2024-03-11 Listed $337,000 BRIGHT MLS
- 2023-08-29 Price Changed $360,173 BRIGHT MLS
- 2023-07-25 Listing Removed — BRIGHT MLS
- 2023-05-01 Price Changed $371,000 BRIGHT MLS
- 2023-05-01 Relisted — BRIGHT MLS
- 2023-03-22 Listing Removed — BRIGHT MLS
- 2023-02-20 Price Changed $379,900 BRIGHT MLS
- 2023-02-17 Listing Removed — BRIGHT MLS
- 2023-02-14 Listed $399,999 BRIGHT MLS
- 2023-01-25 Listed $399,999 BRIGHT MLS
- 2023-01-19 Coming Soon — BRIGHT MLS
- 2014-06-24 Sold (Public Records) $105,000 Public Records
- 2014-06-15 Delisted — MRIS
- 2014-06-13 Sold (MLS) $105,000 BRIGHT MLS
- 2014-06-13 Sold (MLS) $105,000 MRIS
- 2014-05-25 Listing Removed — BRIGHT MLS
- 2014-04-08 Pending — MRIS
- 2014-04-08 Price Changed $160,900 MRIS
- 2013-12-28 Price Changed $199,900 MRIS
- 2013-03-30 Listed $233,900 MRIS
- 2013-03-30 Listed $160,900 BRIGHT MLS
Property tax history
-5.1%/yrLatest (2025): $2,007 · +16.3% YoY. Source: county tax records.
Cash-flow waterfall
monthlySold comps — $/sqft
last 12 mo · ≤1 miLoading sold comps…