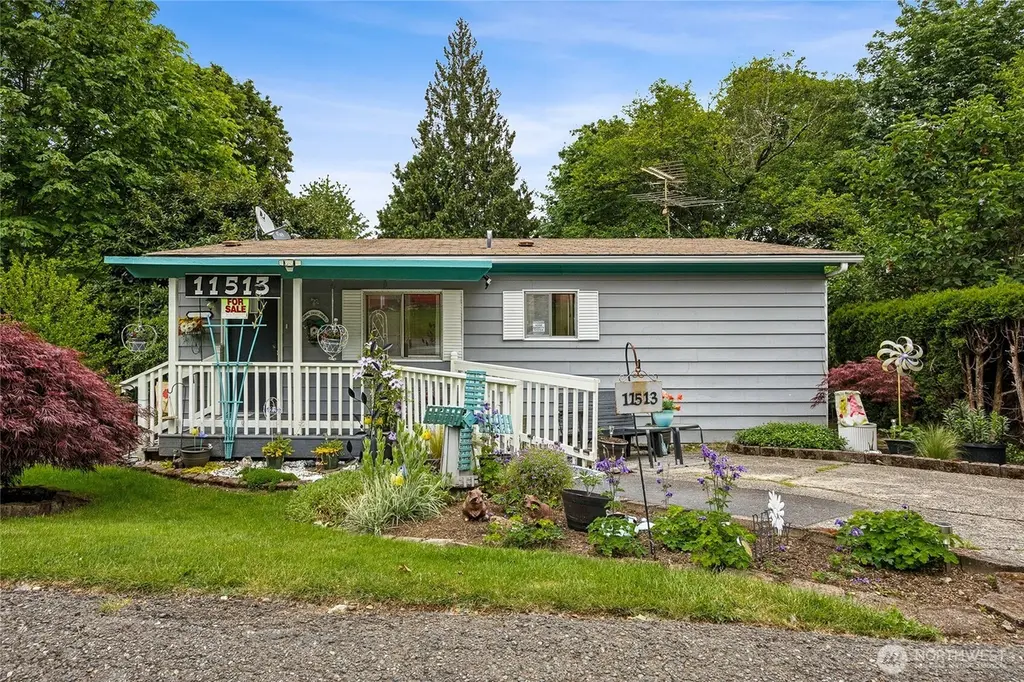
11513 155th Ave SE · East Renton Highlands, WA
Flood risk 1/10 · Minimal
- FEMA flood zone
- X (unshaded)
- Chance of flooding over 30 yrs
- 0.0%
- Est. flood insurance / yr
- $507 – $1,088
Fire risk 1/10 · Minimal
- Est. fire insurance / yr
- $604 – $1,122
Heat risk 2/10 · Minimal
- Hot days now (above 87°F)
- 7 days/yr
- Hot days in 30 yrs
- 15 days/yr
Wind risk 1/10 · Minimal
- Chance of severe wind over 30 yrs
- —
Air-quality risk 7/10 · Major
- Unhealthy air days now
- 10 days/yr
- Unhealthy air days in 30 yrs
- 13 days/yr
Risk factors via First Street. Map © Google.
Why this score? — see what drove the B- grade
The composite is a weighted blend of 9 inputs, each scored 0–100. Each bar is that input's sub-score; the figure is the points it added to the 100-point composite (weight × sub-score).
- Cash flow +30.0/30.0
- 1% rule +10.0/10.0
- DSCR +10.0/10.0
- Schools +7.3/10.0
- Condition / age +4.0/5.0
- Livability +3.1/5.0
- Rent growth +2.6/5.0
- ARV discount +0.0/15.0
- Appreciation +0.0/10.0
$75,800
🖨 Deal sheet (PDF) 📄 Offer letter ✓ Due diligence
Listing remarks
This fantastic 736 sq ft double-wide manufactured home has been beautifully remodeled and is truly move-in ready — just unpack and start enjoying your next chapter. Inside, you'll find gorgeous new flooring throughout, a modern kitchen featuring updated cabinetry and countertops, a refreshed bathroom, and stylish new fixtures that give the home a fresh, contemporary feel without sacrificing warmth or charm. Light-filled living spaces create an inviting atmosphere that immediately feels like home. Designed for comfortable, low-maintenance living, this home lets you spend more time doing what you love. The 55+ Esplanade community is known for its peaceful setting and pride of ownership
Key facts
- Esplanade community
- Refreshed bathroom
- Modern kitchen
Tags
Property features AI
Finance
- Financial info: Land lease: $1,400; Listing terms: Cash or Conventional
- HOA & community: Located in a park with about 30 homes; Senior community; Cats allowed; Park approved for sale
Exterior
- Parking: One open/uncovered parking space
- Utilities: Electric power (PSE); Public water; Cable connected (Xfinity); Internet connected (Xfinity)
- Home design: Manufactured double-wide home (Kit model 36/24); One level; Faces west; Manufactured after 6/15/1976; Mobile home remains in place
- Construction: Metal/vinyl siding; Composition roof; Built as a manufactured house
- Exterior features: Patio/porch/deck; Landscaped; Paved lot; Common area in park; Has a view; Double pane windows
Interior
- Kitchen: Dishwasher; Microwave; Stove/Range; Refrigerator
- Bedrooms: 2 bedrooms
- Flooring: Engineered hardwood; Entry and living areas with engineered hardwood
- Bathrooms: 1 three-quarter bath with shower
- Heating & cooling: Forced-air heating
- Interior features: Water heater (located in hallway closet); Tie down foundation
- Laundry & utility: Washer; Dryer; Utility room
Neighborhood map
What this means for you Summary
Snapshot
- This is a 2-bed/1.0-bath manufactured listed at $76k. Condition is rated good.
Deal economics
- At list price, monthly cash flow is $1k ($17k/yr) — positive.
- The deal already cash-flows at list — no discount required.
- Meets the 1% rule at list price ($2k rent vs $76k).
- Recommended offer: $74k (3.0% below list) — sets the bar for market timing.
- Cap rate 29.1% vs local median 2.0% in East Renton Highlands — top-decile yield for the area; either an underpriced asset or a hidden risk that comps aren't pricing in. Stress-test before assuming the spread holds.
Location & tenants
- Location reads 62/100 on livability (#431 in WA) — a middle-class / working-renter tenant base. Strengths: crime A+, employment A+, housing A+; Watch: schools D, amenities F, commute F.
- Issaquah School District (suburban): math 77% / reading 81% proficiency, ranked #4 of 291 in WA (top 1%) — strong family-tenant draw, lease renewals of 3-5y typical; only 7% free/reduced lunch — higher-income household profile.
- Market conditions: Rents flat; 255 active listings in the ZIP; 2 comparable units currently listed for rent nearby; high-income renter base; 10,555 units permitted in King County in 2024 (7,119 in 5+ unit buildings).
Forward outlook
- Local home prices are declining (-3.0%/yr); year-one equity from $524 of loan paydown is wiped out by about $2k of value loss. Plan a longer hold.
- King County population projected at +44% by 2050 — long-run rental-demand tailwind backs the buy-and-hold thesis.
- At projected returns (-3.0% appreciation + 0.3% rent growth), your $21k cash investment doubles in ~2 years — after that, you're playing with house money.
Negotiation context
- It's been on market 31 days — a 3% lower offer ($74k) is reasonable based on typical stale-listing flexibility.
Questions for the listing agent
- It's been on market 31 days. Have you received any prior offers? Is the seller open to a 3% concession, seller financing, or rate buy-down credit?
- Is there a deadline driving the sale (1031 exchange, divorce, estate, relocation)? That informs how much negotiation room exists.
- Schools are D-rated, which usually means shorter tenancies and higher turnover. Who's the typical renter profile here, and what's been the actual vacancy rate?
- What's the average days-on-market for RENTAL listings here right now (not sales)? A rising rental-DOM trend means longer vacancies and softer asking-rent achievability than the comps imply.
- What's the recent tenant-quality profile in this submarket — average credit score on applications, eviction rate, late-payment / NSF rate, and stable-employment percentage? A property-management company in the area should have these aggregated.
- How much new for-sale + rental construction is in the pipeline within 1–3 miles? Heavy new supply typically softens prices + rents 12–24 months out; constrained supply supports both.
Investment metrics
- 1% rule
- 3.28% ✓
- Cap rate
- 29.06%
- Cash-on-cash
- 81.32%
- DSCR
- 4.62
- GRM
- 2.5
CMA / ARV
- ARV (on-the-fly)
- $54,464
- Comps found
- 1
Show comp detail 1 sale within ~0.75 mi
| Address | Dist | Beds/Ba | Sqft | Sold | Price | $/sf | Match |
|---|---|---|---|---|---|---|---|
| 11414 164th Ave SE #45 | 0.57mi | 2/1.0 | 660 (-10%) | 8mo | $49,000 | $74 | 49 |
Match score weights: distance 35% · size 25% · config 20% · recency 20%. Top-matched comps best support the ARV.
Projected returns pro-forma
-3.0% appreciation · 0.29% rent growth · sell at horizon
- IRR
- 78.5%
- Equity multiple
- 4.43×
- Total profit
- $72,766
- Equity at exit
- $11,302
- IRR
- 81.3%
- Equity multiple
- 8.34×
- Total profit
- $155,844
- Equity at exit
- $6,554
Cash invested: $21,224 (down + closing). Projections, not guarantees.
Landlord ↔ Tenant lean methodology
- Overall (STATE)
- 28 Tenant-Leaning
- State Washington
- 28 Tenant-Leaning · D+8
- County
- — inherits STATE
- City
- — inherits STATE
ZIP-level market 98059
- Rents YoY
- 0.3%
- Active inventory
- 255
- Price-to-rent
- 2.5×
Monthly cashflow live
- Estimated rent
- $2,484 medium interval (Pro) →
- Mortgage (P&I)
- −$398
- Tax est. 1.5%
- −$95 /mo · $1,137/yr
- Insurance
- −$32
- HOA
- −$0
- Vacancy / Maint / Mgmt
- −$522
- Net cashflow
- $1,438
Break-even live
Sensitivity live
| Price | -10% $1,491 | -5% $1,464 | +0% $1,438 | +5% $1,412 | +10% $1,386 |
|---|---|---|---|---|---|
| Rent | -10% $1,242 | -5% $1,340 | +0% $1,438 | +5% $1,536 | +10% $1,635 |
| Rate | -1.0pp $1,476 | -0.5pp $1,458 | base $1,438 | +0.5pp $1,419 | +1.0pp $1,399 |
UW: 25.0% down · 7.5% · 30yr · 1.5% tax · 5.0% vac · 8.0% maint · 8.0% mgmt
Financing live
Cash to close
- Down payment
- $18,950
- Closing costs
- $2,274
- Reserves months
- —
- Total cash needed
- —
Loan-product check · same deal, 3 products live
Conventional
25% down · 7.5% · 30yr
- Down + closing
- —
- Monthly P&I
- —
- Monthly cashflow
- —
- DSCR
- —
- Eligible?
- —
Personal DTI + credit; lowest rate.
DSCR
20% down · 8.5% · 30yr
- Down + closing
- —
- Monthly P&I
- —
- Monthly cashflow
- —
- DSCR
- —
- Eligible?
- —
No personal income docs; deal must DSCR.
Hard money
10% down · 12.0% · 12mo
- Down + closing
- —
- Monthly P&I
- —
- Monthly cashflow
- —
- DSCR
- —
- Eligible?
- —
Short-term bridge; refi at stabilization.
Rent comps 2 comps
| Address | Beds | Baths | Sqft | Rent | $/sqft | DOM | Units | Dist |
|---|---|---|---|---|---|---|---|---|
| 650 Duvall Ave NE Renton, WA | 1.0–3.0 | 1.0–3.0 | 1020 | $2,454 | $2.40 | 0d | 13 | 1.08mi |
| 4415 NE 5th St Renton, WA | 1.0–3.0 | 1.0–2.0 | 923 | $2,370 | $2.57 | 0d | 10 | 1.33mi |
Listing history 16 events
-
2026-06-21days on market $75,800 Active 31 DOM
-
2026-06-18days on market $75,800 Active 28 DOM
-
2026-06-17days on market $75,800 Active 27 DOM
-
2026-06-16days on market $75,800 Active 26 DOM
-
2026-06-15days on market $75,800 Active 25 DOM
-
2026-06-13days on market $75,800 Active 23 DOM
-
2026-06-13days on market $75,800 Active 22 DOM
-
2026-06-09days on market $75,800 Active 19 DOM
-
2026-06-08days on market $75,800 Active 18 DOM
-
2026-06-07days on market $75,800 Active 17 DOM
-
2026-06-04days on market $75,800 Active 14 DOM
-
2026-06-03days on market $75,800 Active 13 DOM
-
2026-06-02days on market $75,800 Active 12 DOM
-
2026-06-01days on market $75,800 Active 11 DOM
-
2026-05-31days on market $75,800 Active 10 DOM
-
2026-05-21$75,800 Active
ⓘ Source: listings_history table (triggers on properties + properties_extension) + one-shot
backfill from property_details.listing_events for pre-trigger history.
Climate risk First Street
- Flood 1/10 Low FEMA zone X (unshaded) · 0% chance over 30 yrs
- Wildfire 1/10 Low
- Heat 2/10 Low 7 d/yr ≥87°F today · 15 d/yr by 30 yrs out
- Wind 1/10 Low
- Air quality 7/10 Severe 10 unhealthy d/yr today · 13 by 30 yrs out
Nearby sold comps map
Loading sold comps map…
Walkable amenities ~0.75 mi
Loading nearby amenities…
Taxation est. · year 1
- Rental income
- $29,805
- − Mortgage interest
- −$4,246
- − Property taxes
- −$1,137
- − Insurance
- −$379
- − Repairs & maintenance
- −$2,384
- − Management
- −$2,384
- − Depreciation
- −$2,205
- Taxable income
- $17,069
- Est. tax owed @ 24.0%
- −$4,096
- After-tax cash flow
- $13,163/yr
For passive investors: Depreciation is non-cash, so a rental often shows a tax loss while cash-flowing — sheltering income. Rental losses are passive: they offset passive income freely, and up to $25,000/yr can offset ordinary (W-2) income if you actively participate and your MAGI is under $100k (phasing out to $0 by $150k); unused losses carry forward. On sale, claimed depreciation is recaptured at up to 25%, and gains may owe capital-gains tax (a 1031 exchange can defer both). Figures are a year-1 estimate at your 24.0% rate — not tax advice; consult a CPA.
Condition & rehab AI · 13 photos
This move-in ready manufactured home has been beautifully remodeled with new flooring, kitchen, and bathroom, making it an attractive option for both resale and rental.
Value-add opportunities
- Both landscaping — enhances curb appeal and adds value
- Both painting — refreshes the home's appearance
- Both landscaping — enhances curb appeal and adds value
Renovation cost estimate screening
Value-add ROI direction
- Both landscaping — enhances curb appeal and adds value ↑
- Both painting — refreshes the home's appearance ↑
- Both landscaping — enhances curb appeal and adds value ↑
ⓘ Cost ranges are severity-bucket heuristics (US national rule-of-thumb). Get contractor quotes + a written scope before underwriting a rehab budget.
Schools (NCES district)
- District
- Issaquah School District
- NCES district ID
- 5303750
- Math proficiency
- 77% ▼ -1.00%
- Reading proficiency
- 81% ▲ 1.00%
- Median HH income
- $109,747
- Composite
- 73.35/100
- National rank
- #339
- State rank
- #4 of 291 in WA
Livability — East Renton Highlands
- Score
- 62/100
- State rank
- #431
- US rank
- #17171
Category grades
Schools grade is shown separately in the Schools card above.
Census & demographics
- Census place
- East Renton Highlands, WA
- County
- King County · 2,251,916 people
- City population
- 158,600
- Metro
- Seattle-Tacoma-Bellevue, WA
- Population (ZIP)
- 42,406
- Household income
- $138,654
- Rent vs Own
- Severe rent burden
- 908.0
Population outlook (King County) Hauer SSP2
- Today (2025)
- 2,576,485 people
- By 2030
- 2,803,316 · +8.8%
- By 2040
- 3,255,921 · +26.4%
- By 2050
- 3,706,444 · +43.9%
- By 2075
- 4,746,063 · +84.2%
- By 2100
- 5,407,730 · +109.9%
Race, ethnicity, and origin ACS 2023
- Neighborhood character
- Diverse neighborhood (Simpson 0.68)
- Race & ethnicity
- White 48% Asian 29% Two or more races 15% Hispanic / Latino 9% Black 2%
- Hispanic origin (detail)
- Mexican 5%
- Common ancestry
- Portuguese 3% Italian 3% Slovak 2%
- Foreign-born
- 23% · China, Vietnam, Canada
- Languages at home
- 67% English-only · Chinese 9% Vietnamese 6% Spanish 5%
Political lean MEDSL · King
- 2024 margin
- Solid D (+51.7) · D 74.2% · R 22.5% · Other 3.4%
- 2008→2024 swing
- +9.6pp toward D · 2008: 42.1pp · 2024: 51.7pp
- All cycles
- 2024: D+51.7 2020: D+52.7 2016: D+50.4 2012: D+39.9 2008: D+42.1
Not yet ingested
- Civics
- —
Market trends
- HPI YoY
- ▼ -920.66%
- Current HPI
- 338.4495
- Rent YoY
- ▲ 0.29%
- Metro
- Seattle-Tacoma-Bellevue, WA
- State GDP YoY
- ▲ 4.65%
- F500 in state
- 22
Industry mix (Fortune 500 HQ in WA)
| Industry | F500 HQs | Revenue |
|---|---|---|
| Retail | 2 | $269B |
|
||
| Technology / Retail | 1 | $638B |
|
||
| Technology | 1 | $245B |
|
||
| Telecommunications | 1 | $38B |
|
||
| Food / Beverage | 1 | $36B |
|
||
| Automotive / Trucks | 1 | $34B |
|
||
Price history
1 event — show timeline
- 2026-05-21 Listed $75,800 NWMLS as Distributed by MLS Grid
Cash-flow waterfall
monthlySold comps — $/sqft
last 12 mo · ≤1 miLoading sold comps…