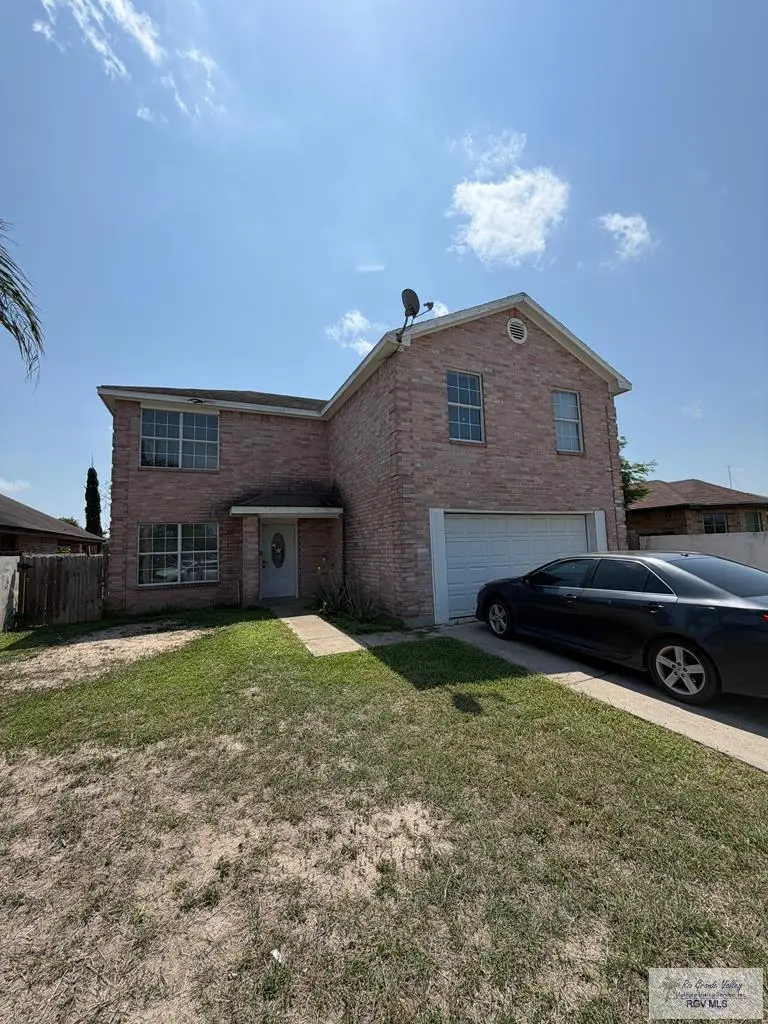
2473 Frankfurt St · Brownsville, TX
Flood risk 1/10 · Minimal
- FEMA flood zone
- X (unshaded)
- Chance of flooding over 30 yrs
- 0.0%
- Est. flood insurance / yr
- $507 – $1,088
Fire risk 4/10 · Minor
- Est. fire insurance / yr
- $1,222 – $2,270
Heat risk 9/10 · Severe
- Hot days now (above 111°F)
- 7 days/yr
- Hot days in 30 yrs
- 26 days/yr
Wind risk 9/10 · Severe
- Chance of severe wind over 30 yrs
- 99.0%
Air-quality risk 2/10 · Minimal
- Unhealthy air days now
- 1 days/yr
- Unhealthy air days in 30 yrs
- 1 days/yr
Risk factors via First Street. Map © Google.
Why this score? — see what drove the B grade
The composite is a weighted blend of 9 inputs, each scored 0–100. Each bar is that input's sub-score; the figure is the points it added to the 100-point composite (weight × sub-score).
- Cash flow +26.1/30.0
- ARV discount +15.0/15.0
- DSCR +8.8/10.0
- 1% rule +7.7/10.0
- Rent growth +5.0/5.0
- Livability +4.0/5.0
- Condition / age +2.5/5.0
- Schools +2.2/10.0
- Appreciation +0.0/10.0
$169,999
🖨 Deal sheet 📄 Offer letter ✓ Due diligence
Listing remarks
This two-story home is full of potential and ready for the right buyer. In need of some work, it offers a great opportunity to build equity while also serving as a strong rental income property. Eligible for conventional and DSCR financing. All offers welcome — Submit your offer today!
Key facts
- 5,000 sq ft lot
- Built 2005
- Listed 4 days
Property features AI
Exterior
- Utilities: Public water; Public sewer
- Home design: Single family residence; 2 stories
- Construction: Brick veneer exterior; Slab foundation
- Exterior features: Composition roof
Interior
- Flooring: Tile
- Bathrooms: 2 full bathrooms
- Heating & cooling: Central heating; Central air
- Interior features: Tile flooring; Central heating; Central air conditioning
Neighborhood map
What this means for you Summary
Snapshot
- This is a 4-bed/2.0-bath single-family listed at $170k.
Deal economics
- At list price, monthly cash flow is $428 ($5k/yr) — positive.
- The deal already cash-flows at list — no discount required.
- Meets the 1% rule at list price ($2k rent vs $170k).
- Cap rate 9.3% vs local median 5.0% in Brownsville — top-decile yield for the area; either an underpriced asset or a hidden risk that comps aren't pricing in. Stress-test before assuming the spread holds.
Location & tenants
- Location reads 79/100 on livability (#62 in TX, #2,311 nationally) — a middle-class / working-renter tenant base. Strengths: commute A+, cost of living A+, housing A+; Watch: amenities D, crime D-, employment F.
- Brownsville ISD (urban): math 20% / reading 34% proficiency, ranked #710 of 826 in TX (top 86%) — low school quality limits family demand, transient renter base, plan for 1-2y turnover; 83% free/reduced lunch — lower-income household profile, screen leases tightly.
- Zoned schools: Keller El (math 12% / reading 27%, grade F, #3,583 of 4,322 statewide, top 86%, 532 students, 92% FRL); Stillman Middle (math 26% / reading 43%, grade F, #858 of 1,662 statewide, top 54%, 1,095 students, 68% FRL); Rivera Early College H S (math 12% / reading 38%, grade F, #1,250 of 1,632 statewide, top 77%, 2,254 students, 84% FRL) — zoned schools at 81% FRL track the district average.
- Market conditions: Rents rising fast (+11.4%/yr); 346 active listings in the ZIP; 14 comparable units currently listed for rent nearby; rentals at typical pace (median 21d on market — plan ~3-4 weeks tenant-placement turnaround); 43% of comp listings sitting > 30 days — soft ceiling on asking rent; 2,326 units permitted in Cameron County in 2024 (503 in 5+ unit buildings).
- At $2,155/mo this rent would consume 52% of the median local household income ($50k/yr) (locally 1800% of renters already pay >50% of income on rent) — very limited rent-growth headroom before tenants either downsize or default.
Forward outlook
- Local home prices are declining (-3.0%/yr); year-one equity from $1k of loan paydown is wiped out by about $5k of value loss. Plan a longer hold.
- Cameron County population projected at +3% by 2050 — modest demand growth; plan on rents tracking national, not racing it.
- At projected returns (-3.0% appreciation + 8.0% rent growth), your $48k cash investment doubles in ~7 years — after that, you're playing with house money.
Negotiation context
- Only 4 days on market — expect competitive offers; lowballing is unlikely to land.
- Current owner paid $127k; 34% above their basis — modest negotiation headroom, anchor on the comps not their cost.
Risks & watch-outs
- Climate carrying-cost: severe wind risk, 99% chance of damaging wind over 30y; extreme-heat days projected 7→26/yr by 2055 (HVAC capex compounding) — expect insurance premiums to compound above CPI over the hold.
Questions for the listing agent
- Is there a deadline driving the sale (1031 exchange, divorce, estate, relocation)? That informs how much negotiation room exists.
- Crime grade is D in this area — have there been break-ins, vandalism, or insurance claims at this property in the last 3 years? What carrier currently insures it and at what premium?
- What's the average days-on-market for RENTAL listings here right now (not sales)? A rising rental-DOM trend means longer vacancies and softer asking-rent achievability than the comps imply.
- What's the recent tenant-quality profile in this submarket — average credit score on applications, eviction rate, late-payment / NSF rate, and stable-employment percentage? A property-management company in the area should have these aggregated.
- How much new for-sale + rental construction is in the pipeline within 1–3 miles? Heavy new supply typically softens prices + rents 12–24 months out; constrained supply supports both.
Investment metrics
- 1% rule
- 1.27% ✓
- Cap rate
- 9.31%
- Cash-on-cash
- 10.78%
- DSCR
- 1.48
- GRM
- 6.6
CMA / ARV
- ARV (on-the-fly)
- $239,112
- Comps found
- 3
Show comp detail 3 sales within ~0.75 mi
| Address | Dist | Beds/Ba | Sqft | Sold | Price | $/sf | Match |
|---|---|---|---|---|---|---|---|
| 2761 Mayorca St | 0.43mi | 4/2.0 | 1,784 (-8%) | 22mo | $199,900 | $112 | 48 |
| 3 Conquistador St | 0.74mi | 3/2.0 (-1) | 1,750 (-10%) | 3mo | $300,000 | $171 | 41 |
| 3984 Ridge Trl | 0.75mi | 3/2.0 (-1) | 1,784 (-8%) | 9mo | $220,000 | $123 | 39 |
Match score weights: distance 35% · size 25% · config 20% · recency 20%. Top-matched comps best support the ARV.
Projected returns pro-forma
-3.0% appreciation · 8.0% rent growth · sell at horizon
- IRR
- 5.7%
- Equity multiple
- 1.23×
- Total profit
- $11,176
- Equity at exit
- $25,347
- IRR
- 19.4%
- Equity multiple
- 3.04×
- Total profit
- $97,026
- Equity at exit
- $14,698
Cash invested: $47,600 (down + closing). Projections, not guarantees.
Landlord ↔ Tenant lean methodology
- Overall (STATE)
- 87 Strongly Landlord-Friendly
- State Texas
- 87 Strongly Landlord-Friendly · R+5
- County
- — inherits STATE
- City
- — inherits STATE
ZIP-level market 78520
- Home prices YoY
- -19.8%
- Rents YoY
- 11.4%
- Active inventory
- 346
- Price-to-rent
- 6.6×
Monthly cashflow live
- Estimated rent
- $2,155 high interval (Pro) →
- Mortgage (P&I)
- −$891
- Tax from tax record
- −$313 /mo · $3,750/yr
- Insurance
- −$71
- HOA
- −$0
- Vacancy / Maint / Mgmt
- −$453
- Net cashflow
- $428
Break-even live
UW: 25.0% down · 7.5% · 30yr · 1.5% tax · 5.0% vac · 8.0% maint · 8.0% mgmt
Financing live
Cash to close
- Down payment
- $42,500
- Closing costs
- $5,100
- Reserves months
- —
- Total cash needed
- —
Loan-product check · same deal, 3 products live
Conventional
25% down · 7.5% · 30yr
- Down + closing
- —
- Monthly P&I
- —
- Monthly cashflow
- —
- DSCR
- —
- Eligible?
- —
Personal DTI + credit; lowest rate.
DSCR
20% down · 8.5% · 30yr
- Down + closing
- —
- Monthly P&I
- —
- Monthly cashflow
- —
- DSCR
- —
- Eligible?
- —
No personal income docs; deal must DSCR.
Hard money
10% down · 12.0% · 12mo
- Down + closing
- —
- Monthly P&I
- —
- Monthly cashflow
- —
- DSCR
- —
- Eligible?
- —
Short-term bridge; refi at stabilization.
Rent comps 14 comps
| Address | Beds | Baths | Sqft | Rent | $/sqft | DOM | Units | Dist |
|---|---|---|---|---|---|---|---|---|
| 2460 Munich St Brownsville, TX | 4.0 | 2.5 | 1984 | $2,000 | $1.01 | 21d | 1 | 0.07mi |
| 2733 Naples St Brownsville, TX | 4.0 | 2.0 | 1796 | $2,400 | $1.34 | 43d | 1 | 0.32mi |
| 1150 Quail Hollow Dr Brownsville, TX | 3.0 | 2.5 | 1333 | $1,950 | $1.46 | 21d | 1 | 0.59mi |
| 1866 Royal Oak St Brownsville, TX | 3.0 | 2.5 | 2304 | $2,400 | $1.04 | 13d | 1 | 0.69mi |
| 2246 Athens St Brownsville, TX | 3.0 | 2.0 | 1304 | $1,800 | $1.38 | 21d | 1 | 0.70mi |
| 3 Conquistador Dr Lot 3 Brownsville, TX | 3.0 | 2.0 | 1750 | $2,500 | $1.43 | 13d | 1 | 0.71mi |
| 3008 Chadwick Pl Brownsville, TX | 4.0 | 2.0 | 1380 | $2,000 | $1.45 | 13d | 1 | 0.78mi |
| 2950 McAllen Rd #6 Brownsville, TX | 3.0 | 3.5 | 1900 | $2,600 | $1.37 | 21d | 1 | 1.23mi |
| 142 Country Club Rd Brownsville, TX | 3.0 | 2.5 | 1460 | $1,800 | $1.23 | 43d | 1 | 1.27mi |
| 150 Country Club Rd Unit 2A Brownsville, TX | 3.0 | 2.5 | 1971 | $1,850 | $0.94 | 43d | 1 | 1.28mi |
| 184 Stars Ave Unit 7 Brownsville, TX | 3.0 | 2.0 | 1450 | $1,900 | $1.31 | 21d | 1 | 1.31mi |
| 322 McFadden Dr Unit 14 Brownsville, TX | 3.0 | 3.0 | 1850 | $2,200 | $1.19 | 43d | 1 | 1.36mi |
| 17 Waterfront Dr Brownsville, TX | 3.0 | 3.0 | 2130 | $1,900 | $0.89 | 43d | 1 | 1.38mi |
| 424 Gilson Rd Brownsville, TX | 3.0 | 2.0 | 1399 | $1,500 | $1.07 | 43d | 1 | 1.48mi |
Listing history 4 events
-
2026-05-20$169,999 Active
-
2026-05-06soldstatus
-
2020-07-28soldstatus $127,153
-
2005-04-07soldstatus
ⓘ Source: listings_history table (triggers on properties + properties_extension) + one-shot
backfill from property_details.listing_events for pre-trigger history.
Tax reassessment forecast TX · Resets to sale price
- Current annual tax
- $3,750 · $313/mo
- Projected year-2 tax
- $3,750 · $313/mo
- Expected delta
- $0/yr ($0/mo · -0.0%)
ⓘ Screening estimate from a state-policy table — verify with the county assessor before closing.
Climate risk First Street
- Flood 1/10 Low FEMA zone X (unshaded) · 0% chance over 30 yrs
- Wildfire 4/10 Moderate
- Heat 9/10 Extreme 7 d/yr ≥111°F today · 26 d/yr by 30 yrs out
- Wind 9/10 Extreme 99% chance of damaging wind over 30 yrs
- Air quality 2/10 Low 1 unhealthy d/yr today · 1 by 30 yrs out
Nearby sold comps map
Loading sold comps map…
Walkable amenities ~0.75 mi
Loading nearby amenities…
Taxation est. · year 1
- Rental income
- $25,861
- − Mortgage interest
- −$9,523
- − Property taxes
- −$3,750
- − Insurance
- −$850
- − Repairs & maintenance
- −$2,069
- − Management
- −$2,069
- − Depreciation
- −$4,945
- Taxable income
- $2,655
- Est. tax owed @ 24.0%
- −$637
- After-tax cash flow
- $4,495/yr
For passive investors: Depreciation is non-cash, so a rental often shows a tax loss while cash-flowing — sheltering income. Rental losses are passive: they offset passive income freely, and up to $25,000/yr can offset ordinary (W-2) income if you actively participate and your MAGI is under $100k (phasing out to $0 by $150k); unused losses carry forward. On sale, claimed depreciation is recaptured at up to 25%, and gains may owe capital-gains tax (a 1031 exchange can defer both). Figures are a year-1 estimate at your 24.0% rate — not tax advice; consult a CPA.
Schools (NCES district)
- District
- Brownsville ISD
- NCES district ID
- 4811680
- Math proficiency
- 20% ▼ -36.00%
- Reading proficiency
- 34% ▼ -13.00%
- Median HH income
- $30,490
- Composite
- 21.8/100
- National rank
- #8249
- State rank
- #710 of 826 in TX
Livability — Brownsville
- Score
- 79/100
- State rank
- #62
- US rank
- #2311
Category grades
Schools grade is shown separately in the Schools card above.
Census & demographics
- Census place
- Brownsville, TX
- County
- Cameron County · 310,734 people
- City population
- 212,132
- Metro
- Brownsville-Harlingen, TX
- Population (ZIP)
- 64,740
- Household income
- $50,116
- Rent vs Own
- Severe rent burden
- 1800.0
Population outlook (Cameron County) Hauer SSP2
- Today (2025)
- 441,603 people
- By 2030
- 448,113 · +1.5%
- By 2040
- 456,385 · +3.3%
- By 2050
- 456,294 · +3.3%
- By 2075
- 423,851 · -4.0%
- By 2100
- 342,787 · -22.4%
Race, ethnicity, and origin ACS 2023
- Neighborhood character
- Predominantly Hispanic (93%)
- Race & ethnicity
- Hispanic / Latino 93% Two or more races 44% White 6%
- Hispanic origin (detail)
- Mexican 88%
- Foreign-born
- 26% · Canada
- Languages at home
- 18% English-only · Spanish 82%
Political lean MEDSL · Cameron
- 2024 margin
- Lean R (+5.8) · D 46.7% · R 52.5%
- 2008→2024 swing
- -34.6pp toward R · 2008: 28.8pp · 2024: -5.8pp
- All cycles
- 2024: R+5.8 2020: D+13.2 2016: D+32.5 2012: D+32.4 2008: D+28.8
Not yet ingested
- Civics
- —
Market trends
- HPI YoY
- ▼ -52.91%
- Current HPI
- 214.4335
- Rent YoY
- ▲ 11.41%
- Metro
- Brownsville-Harlingen, TX
- State GDP YoY
- ▲ 3.95%
- F500 in state
- 110
Industry mix (Fortune 500 HQ in TX)
| Industry | F500 HQs | Revenue |
|---|---|---|
| Energy | 16 | $1,198B |
|
||
| Technology | 5 | $198B |
|
||
| Engineering / Construction | 4 | $72B |
|
||
| Energy Services | 3 | $60B |
|
||
| Utilities | 3 | $41B |
|
||
| Healthcare | 2 | $330B |
|
||
Price history
+33.7% since first listed4 events — show timeline
- 2026-05-20 Listed $169,999 RGVMLS
- 2026-05-06 Sold (Public Records) — Public Records
- 2020-07-28 Sold (Public Records) $127,153 Public Records
- 2005-04-07 Sold (Public Records) — Public Records
Property tax history
+4.0%/yrLatest (2025): $3,750 · -11.6% YoY. Source: county tax records.
Cash-flow waterfall
monthlySold comps — $/sqft
last 12 mo · ≤1 miLoading sold comps…