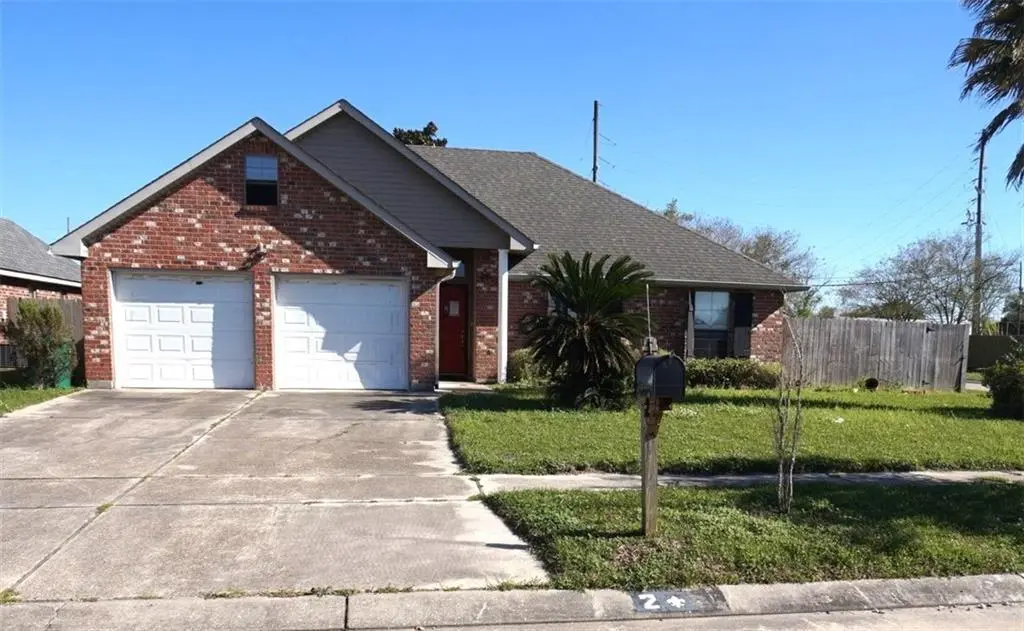
2 Tuscany Dr · Laplace, LA
Flood risk 9/10 · Severe
- FEMA flood zone
- X (shaded)
- Chance of flooding over 30 yrs
- 0.99%
- Est. flood insurance / yr
- $507 – $1,088
Fire risk 1/10 · Minimal
- Est. fire insurance / yr
- $1,269 – $2,357
Heat risk 9/10 · Severe
- Hot days now (above 108°F)
- 7 days/yr
- Hot days in 30 yrs
- 22 days/yr
Wind risk 9/10 · Severe
- Chance of severe wind over 30 yrs
- 99.0%
Air-quality risk 3/10 · Minor
- Unhealthy air days now
- 2 days/yr
- Unhealthy air days in 30 yrs
- 3 days/yr
Risk factors via First Street. Map © Google.
Why this score? — see what drove the C- grade
The composite is a weighted blend of 9 inputs, each scored 0–100. Each bar is that input's sub-score; the figure is the points it added to the 100-point composite (weight × sub-score).
- Cash flow +16.7/30.0
- ARV discount +15.0/15.0
- DSCR +5.2/10.0
- 1% rule +4.2/10.0
- Livability +3.5/5.0
- Rent growth +2.5/5.0
- Condition / age +2.5/5.0
- Schools +1.7/10.0
- Appreciation +0.0/10.0
$189,900
🖨 Deal sheet 📄 Offer letter ✓ Due diligence
Listing remarks MLS
Located on a corner lot in Summerlin Lakes Subdivision you'll find this 3 bedroom 2 bath home with lots of potential. You'll find ceramic tile in Living room, kitchen and baths and laminate flooring in the bedrooms. Living room has beautiful triple tray ceilings with crown molding. In the rear you'll find a nice covered patio overlooking a large rear yard and a storage shed for tools and lawn equipment. Subject is located in Flood Zone X.
Key facts
- Laminate flooring
- Covered patio
- Ceramic tile
Tags
Neighborhood map
What this means for you Summary
Snapshot
- This is a 3-bed/2.0-bath single-family listed at $190k.
Deal economics
- At list price, monthly cash flow is $53 ($634/yr) — positive.
- The deal already cash-flows at list — no discount required.
- To meet the 1% rule (rent ≥ 1% of price), the offer needs to be $174k (8.1% below list).
- Recommended offer: $174k (8.1% below list) — sets the bar for 1% rule.
- Cap rate 7.0% vs local median 4.8% in Laplace — top-decile yield for the area; either an underpriced asset or a hidden risk that comps aren't pricing in. Stress-test before assuming the spread holds.
Location & tenants
- Location reads 70/100 on livability (#61 in LA) — a middle-class / working-renter tenant base. Strengths: cost of living A+, housing A+, health & safety A+; Watch: crime F, amenities F, commute F.
- St. John The Baptist Parish (suburban): math 13% / reading 25% proficiency, ranked #68 of 98 in LA (top 69%) — low school quality limits family demand, transient renter base, plan for 1-2y turnover; 82% free/reduced lunch — lower-income household profile, screen leases tightly.
- Market conditions: 180 active listings in the ZIP; 1 comparable units currently listed for rent nearby; 61 units permitted in St. John the Baptist Parish in 2024 (0 in 5+ unit buildings).
- This rent runs 31% of the median local income ($68k/yr) — at the standard rent-burdened threshold; future hikes will face affordability resistance.
Forward outlook
- Local home prices are declining (-3.0%/yr); year-one equity from $1k of loan paydown is wiped out by about $6k of value loss. Plan a longer hold.
- St. John the Baptist County population projected at -20% by 2050 — secular population decline; favor cash flow + early exit over multi-decade hold.
Negotiation context
- It's been on market 89 days — a 6% lower offer ($179k) is reasonable based on typical stale-listing flexibility.
- 3 sale attempts; this cycle's ask has dropped $10k (5%) from the opening price — seller is motivated, your offer sets the floor, not the list.
Risks & watch-outs
- Watch-outs: flood insurance adds $66/mo.
- Climate carrying-cost: severe flood risk; severe wind risk, 99% chance of damaging wind over 30y; extreme-heat days projected 7→22/yr by 2055 (HVAC capex compounding) — expect insurance premiums to compound above CPI over the hold.
Questions for the listing agent
- It's been on market 89 days. Have you received any prior offers? Is the seller open to a 8% concession, seller financing, or rate buy-down credit?
- What's the actual annual flood-insurance premium (NFIP or private), and is the property in a SFHA with mandatory coverage?
- What does the HOA fee cover, when was the last increase, and are there any pending special assessments or reserve-fund shortfalls?
- Why hasn't it sold? Are there any deal-killer items the seller is aware of (foundation, flood, title, zoning, code violations)?
- Is there a deadline driving the sale (1031 exchange, divorce, estate, relocation)? That informs how much negotiation room exists.
- Crime grade is F in this area — have there been break-ins, vandalism, or insurance claims at this property in the last 3 years? What carrier currently insures it and at what premium?
- What's the average days-on-market for RENTAL listings here right now (not sales)? A rising rental-DOM trend means longer vacancies and softer asking-rent achievability than the comps imply.
- What's the recent tenant-quality profile in this submarket — average credit score on applications, eviction rate, late-payment / NSF rate, and stable-employment percentage? A property-management company in the area should have these aggregated.
- How much new for-sale + rental construction is in the pipeline within 1–3 miles? Heavy new supply typically softens prices + rents 12–24 months out; constrained supply supports both.
Investment metrics
- 1% rule
- 0.92% ✗
- Cap rate
- 7.05%
- Cash-on-cash
- 2.69%
- DSCR
- 1.12
- GRM
- 9.1
CMA / ARV
- ARV (median comp)
- $271,012
- List price
- $189,900
- Delta
- -29.93%
- Verdict
- UNDERPRICED
- Comps
- 20 within 1.0 mi
Show comp detail 12 sales within ~0.75 mi
| Address | Dist | Beds/Ba | Sqft | Sold | Price | $/sf | Match |
|---|---|---|---|---|---|---|---|
| 48 Tuscany Dr | 0.26mi | 3/2.0 | 1,586 (+3%) | 3mo | $210,000 | $132 | 80 |
| 146 Broussard Dr | 0.32mi | 3/1.5 | 1,481 (-4%) | 2mo | $180,000 | $122 | 75 |
| 55 Derek Ln | 0.41mi | 3/2.0 | 1,650 (+7%) | 2mo | $235,000 | $142 | 67 |
| 1701 Cambridge Dr | 0.48mi | 3/2.0 | 1,609 (+5%) | 6mo | $160,000 | $99 | 64 |
| 1629 Yorktowne Dr | 0.58mi | 3/2.0 | 1,460 (-5%) | 6mo | $195,000 | $134 | 60 |
| 1716 Virginian Colony Ave | 0.40mi | 3/2.0 | 1,372 (-11%) | 4mo | $205,000 | $149 | 60 |
| 1912 Williamsburg Dr | 0.50mi | 4/2.0 (+1) | 1,612 (+5%) | 5mo | $180,000 | $112 | 60 |
| 2324 Williamsburg Dr | 0.67mi | 3/2.0 | 1,628 (+6%) | 1mo | $182,500 | $112 | 58 |
| 1633 Yorktowne Dr | 0.58mi | 3/2.0 | 1,443 (-6%) | 7mo | $169,900 | $118 | 57 |
| 566 Welham Loop | 0.74mi | 3/2.0 | 1,577 (+2%) | 7mo | $225,000 | $143 | 55 |
| 117 Tammy Dr | 0.70mi | 3/2.0 | 1,650 (+7%) | 9mo | $214,900 | $130 | 47 |
| 1604 Williamsburg Dr | 0.52mi | 4/2.0 (+1) | 1,764 (+15%) | 2mo | $218,900 | $124 | 44 |
Match score weights: distance 35% · size 25% · config 20% · recency 20%. Top-matched comps best support the ARV.
Projected returns pro-forma
-3.0% appreciation · 3.0% rent growth · sell at horizon
- IRR
- -14.4%
- Equity multiple
- 0.49×
- Total profit
- $-27,370
- Equity at exit
- $28,315
- IRR
- -5.6%
- Equity multiple
- 0.64×
- Total profit
- $-19,357
- Equity at exit
- $16,419
Cash invested: $53,172 (down + closing). Projections, not guarantees.
Landlord ↔ Tenant lean methodology
- Overall (STATE)
- 90 Strongly Landlord-Friendly
- State Louisiana
- 90 Strongly Landlord-Friendly · R+12
- County
- — inherits STATE
- City
- — inherits STATE
ZIP-level market 70068
- Home prices YoY
- -20.1%
- Active inventory
- 180
- Price-to-rent
- 9.1×
Monthly cashflow live
- Estimated rent
- $1,745 medium interval (Pro) →
- Mortgage (P&I)
- −$996
- Tax from tax record
- −$167 /mo · $2,006/yr
- Insurance
- −$79
- Flood insurance flood zone
- −$66 /mo · $798/yr
- HOA
- −$17
- Vacancy / Maint / Mgmt
- −$366
- Net cashflow
- $53
Break-even live
UW: 25.0% down · 7.5% · 30yr · 1.5% tax · 5.0% vac · 8.0% maint · 8.0% mgmt
Financing live
Cash to close
- Down payment
- $47,475
- Closing costs
- $5,697
- Reserves months
- —
- Total cash needed
- —
Loan-product check · same deal, 3 products live
Conventional
25% down · 7.5% · 30yr
- Down + closing
- —
- Monthly P&I
- —
- Monthly cashflow
- —
- DSCR
- —
- Eligible?
- —
Personal DTI + credit; lowest rate.
DSCR
20% down · 8.5% · 30yr
- Down + closing
- —
- Monthly P&I
- —
- Monthly cashflow
- —
- DSCR
- —
- Eligible?
- —
No personal income docs; deal must DSCR.
Hard money
10% down · 12.0% · 12mo
- Down + closing
- —
- Monthly P&I
- —
- Monthly cashflow
- —
- DSCR
- —
- Eligible?
- —
Short-term bridge; refi at stabilization.
Rent comps 1 comps
| Address | Beds | Baths | Sqft | Rent | $/sqft | DOM | Units | Dist |
|---|---|---|---|---|---|---|---|---|
| 1716 Yorktowne Dr Laplace, LA | 4.0 | 1.0 | 1509 | $1,500 | $0.99 | 23d | 1 | 0.57mi |
HOA detail
- Monthly dues
- $17 · $204/yr
Listing history 21 events
-
2026-06-18days on market $189,900 Active 89 DOM
-
2026-06-17days on market $189,900 Active 88 DOM
-
2026-06-16days on market $189,900 Active 87 DOM
-
2026-06-15days on market $189,900 Active 86 DOM
-
2026-06-14days on market $189,900 Active 84 DOM
-
2026-06-13days on market $189,900 Active 83 DOM
-
2026-06-10days on market $189,900 Active 81 DOM
-
2026-06-09days on market $189,900 Active 80 DOM
-
2026-06-08days on market $189,900 Active 79 DOM
-
2026-06-07days on market $189,900 Active 78 DOM
-
2026-06-02days on market $189,900 Active 73 DOM
-
2026-06-01days on market $189,900 Active 72 DOM
-
2026-05-31days on market $189,900 Active 71 DOM
-
2026-05-30days on market $189,900 Active 70 DOM
-
2026-05-14price $189,900 442-char remark
Show marketing remark (442 chars)
Located on a corner lot in Summerlin Lakes Subdivision you'll find this 3 bedroom 2 bath home with lots of potential. You'll find ceramic tile in Living room, kitchen and baths and laminate flooring in the bedrooms. Living room has beautiful triple tray ceilings with crown molding. In the rear you'll find a nice covered patio overlooking a large rear yard and a storage shed for tools and lawn equipment. Subject is located in Flood Zone X.
-
2026-03-20$199,900 Active 442-char remark
Show marketing remark (442 chars)
Located on a corner lot in Summerlin Lakes Subdivision you'll find this 3 bedroom 2 bath home with lots of potential. You'll find ceramic tile in Living room, kitchen and baths and laminate flooring in the bedrooms. Living room has beautiful triple tray ceilings with crown molding. In the rear you'll find a nice covered patio overlooking a large rear yard and a storage shed for tools and lawn equipment. Subject is located in Flood Zone X.
-
2025-07-11price $199,900
-
2025-07-11price $199,900
-
2025-05-27$224,900 Active
ⓘ Source: listings_history table (triggers on properties + properties_extension) + one-shot
backfill from property_details.listing_events for pre-trigger history.
Tax reassessment forecast LA · Resets to sale price
- Current annual tax
- $2,006 · $167/mo
- Projected year-2 tax
- $2,006 · $167/mo
- Expected delta
- $0/yr ($0/mo · 0.0%)
ⓘ Screening estimate from a state-policy table — verify with the county assessor before closing.
Climate risk First Street
- Flood 9/10 Extreme FEMA zone X (shaded) · 99% chance over 30 yrs
- Wildfire 1/10 Low
- Heat 9/10 Extreme 7 d/yr ≥108°F today · 22 d/yr by 30 yrs out
- Wind 9/10 Extreme 99% chance of damaging wind over 30 yrs
- Air quality 3/10 Moderate 2 unhealthy d/yr today · 3 by 30 yrs out
Nearby sold comps map
Loading sold comps map…
Walkable amenities ~0.75 mi
Loading nearby amenities…
Taxation est. · year 1
- Rental income
- $20,939
- − Mortgage interest
- −$10,637
- − Property taxes
- −$2,006
- − Insurance
- −$1,747
- − Repairs & maintenance
- −$1,675
- − Management
- −$1,675
- − HOA
- −$204
- − Depreciation
- −$5,524
- Taxable loss
- −$2,530
- Est. tax savings @ 24.0%
- +$607
- After-tax cash flow
- $1,242/yr
For passive investors: Depreciation is non-cash, so a rental often shows a tax loss while cash-flowing — sheltering income. Rental losses are passive: they offset passive income freely, and up to $25,000/yr can offset ordinary (W-2) income if you actively participate and your MAGI is under $100k (phasing out to $0 by $150k); unused losses carry forward. On sale, claimed depreciation is recaptured at up to 25%, and gains may owe capital-gains tax (a 1031 exchange can defer both). Figures are a year-1 estimate at your 24.0% rate — not tax advice; consult a CPA.
Schools (NCES district)
- District
- St. John The Baptist Parish
- NCES district ID
- 2201530
- Math proficiency
- 13% ▼ -42.00%
- Reading proficiency
- 25% ▼ -39.00%
- Median HH income
- $50,280
- Composite
- 17.07/100
- National rank
- #9120
- State rank
- #68 of 98 in LA
Livability — Laplace
- Score
- 70/100
- State rank
- #61
- US rank
- #7898
Category grades
Schools grade is shown separately in the Schools card above.
Census & demographics
- Census place
- Laplace, LA
- County
- Saint John the Baptist Parish · 32,720 people
- Metro
- New Orleans-Metairie, LA
- Population (ZIP)
- 32,720
- Household income
- $68,459
- Rent vs Own
- Severe rent burden
- 750.0
Population outlook (St. John the Baptist County) Hauer SSP2
- Today (2025)
- 40,972 people
- By 2030
- 39,295 · -4.1%
- By 2040
- 35,902 · -12.4%
- By 2050
- 32,988 · -19.5%
- By 2075
- 28,661 · -30.0%
- By 2100
- 26,456 · -35.4%
Race, ethnicity, and origin ACS 2023
- Neighborhood character
- Diverse neighborhood (Simpson 0.62)
- Race & ethnicity
- Black 51% White 34% Hispanic / Latino 9% Two or more races 5% Asian 1%
- Hispanic origin (detail)
- Puerto Rican 1%
- Common ancestry
- Lithuanian 11%
- Foreign-born
- 5% · Canada
- Languages at home
- 91% English-only · Spanish 6% Tagalog/Filipino 1%
Political lean MEDSL · St. John the Baptist
- 2024 margin
- Strong D (+29.1) · D 64.0% · R 34.8% · Other 1.2%
- 2008→2024 swing
- +12.9pp toward D · 2008: 16.2pp · 2024: 29.1pp
- All cycles
- 2024: D+29.1 2020: D+28.2 2016: D+24.5 2012: D+26.3 2008: D+16.2
Not yet ingested
- Civics
- —
Market trends
- HPI YoY
- ▼ -60.04%
- Current HPI
- 239.1429
- Rent YoY
- —
- Metro
- New Orleans-Metairie, LA
- State GDP YoY
- ▲ 3.29%
- F500 in state
- 10
Industry mix (Fortune 500 HQ in LA)
| Industry | F500 HQs | Revenue |
|---|---|---|
| Telecommunications | 2 | $23B |
|
||
| Utilities | 1 | $12B |
|
||
| Wholesale / Distribution | 1 | $5B |
|
||
| Advertising | 1 | $2B |
|
||
Price history
-15.6% since first listed7 events — show timeline
- 2026-05-14 Price Changed $189,900 AcadianaMLS
- 2026-05-14 Price Changed $189,900 GSREIN
- 2026-03-20 Listed $199,900 GSREIN
- 2026-03-20 Listed $199,900 AcadianaMLS
- 2025-07-11 Price Changed $199,900 AcadianaMLS
- 2025-07-11 Price Changed $199,900 GSREIN
- 2025-05-27 Listed $224,900 AcadianaMLS
Property tax history
+0.7%/yrLatest (2025): $2,006 · +87.8% YoY. Source: county tax records.
Cash-flow waterfall
monthlySold comps — $/sqft
last 12 mo · ≤1 miLoading sold comps…