None · Port Charlotte, FL
Flood risk 9/10 · Severe
- FEMA flood zone
- AE
- Chance of flooding over 30 yrs
- 0.99%
- Est. flood insurance / yr
- $1,737 – $8,500
Fire risk 1/10 · Minimal
- Est. fire insurance / yr
- $947 – $1,759
Heat risk 10/10 · Severe
- Hot days now (above 107°F)
- 7 days/yr
- Hot days in 30 yrs
- 27 days/yr
Wind risk 10/10 · Severe
- Chance of severe wind over 30 yrs
- 99.0%
Air-quality risk 3/10 · Minor
- Unhealthy air days now
- 2 days/yr
- Unhealthy air days in 30 yrs
- 2 days/yr
Risk factors via First Street. Map © Google.
Why this score? — see what drove the B grade
The composite is a weighted blend of 9 inputs, each scored 0–100. Each bar is that input's sub-score; the figure is the points it added to the 100-point composite (weight × sub-score).
- Cash flow +30.0/30.0
- ARV discount +15.0/15.0
- DSCR +10.0/10.0
- 1% rule +7.5/10.0
- Schools +4.6/10.0
- Livability +3.2/5.0
- Condition / age +2.5/5.0
- Rent growth +2.1/5.0
- Appreciation +0.0/10.0
$205,000
🖨 Deal sheet 📄 Offer letter ✓ Due diligence
Listing remarks
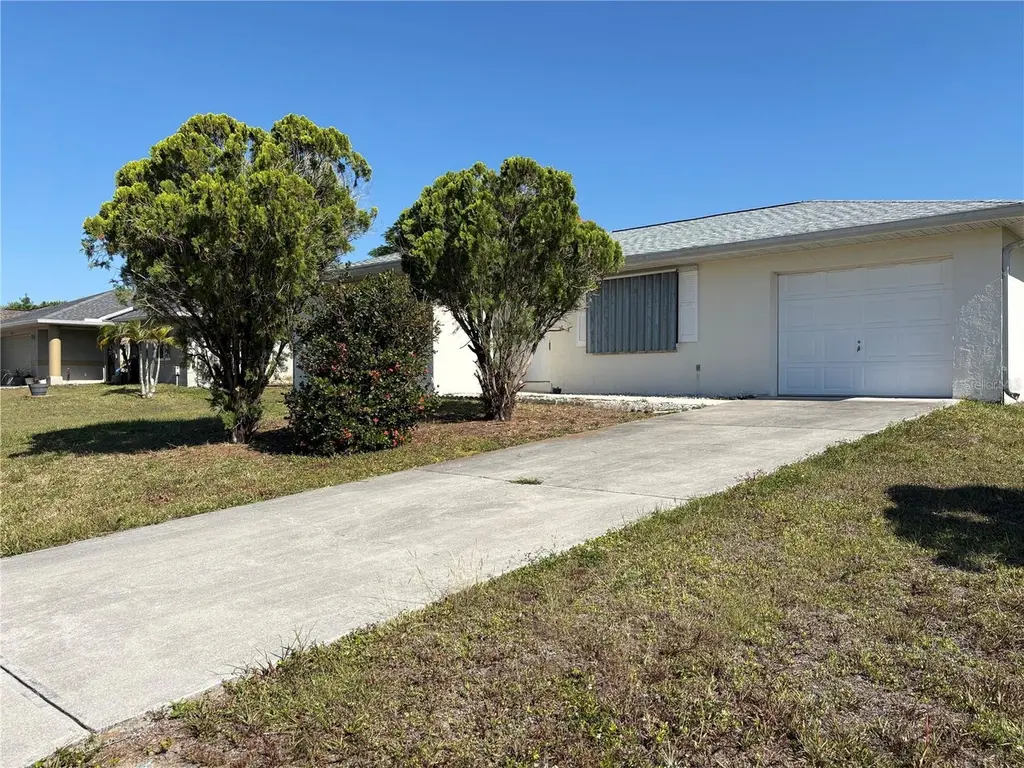
No HOA fees in this 2/2/1.5 car garage with 12x04 platform for washer, dryer, and water heater. Note the pass-thru from the kitchen to the Family Rm. 4 Ceiling fans and tiled throughout. New roof in 2024, water heater and A/C new in 2017. There is a brand new garbage disposal and toilet in the master bathroom. If needed, there are extra hurricane panels. A convenient location, with several waterfront properties nearby. This home would be suitable for first-time home buyers, down-sizing, or investors looking to rent. With the major items replaced, it's ready for your personal decorative taste. This home has good bones, and with a little TLC, it could turn into your dream home.
Key facts
- New water heater
- New a/c
- New roof
Tags
Property features AI
Finance
- Other: Lot approximately 0.23 acres; Paved concrete road access; Directions available
- Financial info: No lease restrictions noted; Furnished
- HOA & community: Street lights in community; No HOA association indicated
Exterior
- Parking: Attached garage (1 car) — 22 x 12
- Security: Hurricane shutters
- Utilities: Public water; Public sewer; Electricity connected; Cable available; Water connected; Sewer connected
- Home design: Single family residence; One story; Faces north; Residential zoning (RSF3.5); Homestead exempt
- Construction: Block, concrete and stucco construction; Shingle roof; Slab foundation; Built with approximately 1,152 sq ft living area
- Exterior features: Hurricane shutters; Exterior lighting; Private mailbox; Rain gutters; Sliding doors
Interior
- Kitchen: Dishwasher; Disposal; Microwave; Range; Range hood; Refrigerator; Electric water heater
- Bedrooms: 2 bedrooms
- Flooring: Ceramic tile
- Bathrooms: 2 full bathrooms
- Heating & cooling: Central heating (electric); Exhaust fan; Central air conditioning
- Interior features: Ceiling fans; Living room / dining room combo; Thermostat; Window treatments
- Laundry & utility: Washer and dryer; Laundry located in garage
Neighborhood map
What this means for you Summary
Snapshot
- This is a 3-bed/2.0-bath single-family listed at $205k.
Deal economics
- At list price, monthly cash flow is $341 ($4k/yr) — positive.
- The deal already cash-flows at list — no discount required.
- Meets the 1% rule at list price ($3k rent vs $205k).
- Recommended offer: $193k (6.0% below list) — sets the bar for market timing.
- Cap rate 10.8% vs local median 4.4% in Port Charlotte — top-decile yield for the area; either an underpriced asset or a hidden risk that comps aren't pricing in. Stress-test before assuming the spread holds.
Location & tenants
- Location reads 65/100 on livability (#655 in FL) — a middle-class / working-renter tenant base. Strengths: cost of living A+, housing A+; Watch: employment D, amenities F, commute F.
- Charlotte (suburban): math 54% / reading 54% proficiency, ranked #22 of 73 in FL (top 30%) — acceptable for families but not a draw, mixed tenant base, ~2y average lease.
- Zoned schools: Meadow Park Elementary School (math 61% / reading 56%, grade B-, #735 of 2,144 statewide, top 35%, 701 students, 59% FRL); Port Charlotte High School (math 23% / reading 38%, grade F, #434 of 667 statewide, top 66%, 1,649 students, 43% FRL) — zoned schools at 51% FRL track the district average.
- Market conditions: Rents soft (-1.6%/yr); 953 active listings in the ZIP; 20 comparable units currently listed for rent nearby; rentals at typical pace (median 22d on market — plan ~3-4 weeks tenant-placement turnaround); 4,585 units permitted in Charlotte County in 2024 (703 in 5+ unit buildings).
- At $2,568/mo this rent would consume 49% of the median local household income ($63k/yr) (locally 501% of renters already pay >50% of income on rent) — very limited rent-growth headroom before tenants either downsize or default.
Forward outlook
- Local home prices are declining (-3.0%/yr); year-one equity from $1k of loan paydown is wiped out by about $6k of value loss. Plan a longer hold.
- Charlotte County population projected at +24% by 2050 — long-run rental-demand tailwind backs the buy-and-hold thesis.
Negotiation context
- It's been on market 74 days — a 6% lower offer ($193k) is reasonable based on typical stale-listing flexibility.
Risks & watch-outs
- Watch-outs: flood insurance adds $427/mo.
- Climate carrying-cost: in FEMA flood zone AE (mandatory federal flood insurance); severe wind risk, 99% chance of damaging wind over 30y; extreme-heat days projected 7→27/yr by 2055 (HVAC capex compounding) — expect insurance premiums to compound above CPI over the hold.
Questions for the listing agent
- It's been on market 74 days. Have you received any prior offers? Is the seller open to a 6% concession, seller financing, or rate buy-down credit?
- What's the actual annual flood-insurance premium (NFIP or private), and is the property in a SFHA with mandatory coverage?
- Why hasn't it sold? Are there any deal-killer items the seller is aware of (foundation, flood, title, zoning, code violations)?
- Is there a deadline driving the sale (1031 exchange, divorce, estate, relocation)? That informs how much negotiation room exists.
- Schools are D-rated, which usually means shorter tenancies and higher turnover. Who's the typical renter profile here, and what's been the actual vacancy rate?
- What's the average days-on-market for RENTAL listings here right now (not sales)? A rising rental-DOM trend means longer vacancies and softer asking-rent achievability than the comps imply.
- What's the recent tenant-quality profile in this submarket — average credit score on applications, eviction rate, late-payment / NSF rate, and stable-employment percentage? A property-management company in the area should have these aggregated.
- How much new for-sale + rental construction is in the pipeline within 1–3 miles? Heavy new supply typically softens prices + rents 12–24 months out; constrained supply supports both.
Investment metrics
- 1% rule
- 1.25% ✓
- Cap rate
- 10.79%
- Cash-on-cash
- 16.06%
- DSCR
- 1.71
- GRM
- 6.7
CMA / ARV
- ARV (on-the-fly)
- $331,776
- Comps found
- 7
Show comp detail 7 sales within ~0.75 mi
| Address | Dist | Beds/Ba | Sqft | Sold | Price | $/sf | Match |
|---|---|---|---|---|---|---|---|
| 18414 Burkholder Cir | 0.35mi | 2/2.0 (-1) | 1,230 (+7%) | 1mo | $339,900 | $276 | 67 |
| 18350 Burkholder Cir | 0.37mi | 3/2.0 | 1,071 (-7%) | 10mo | $300,000 | $280 | 63 |
| 18361 Hottelet Cir | 0.42mi | 2/2.0 (-1) | 1,288 (+12%) | 4mo | $525,000 | $408 | 52 |
| 18067 Avonsdale Cir | 0.43mi | 3/2.0 | 1,248 (+8%) | 18mo | $360,000 | $288 | 51 |
| 4574 Herman Cir | 0.70mi | 2/2.0 (-1) | 1,200 (+4%) | 19mo | $462,500 | $385 | 39 |
| 18666 Goodman Cir | 0.70mi | 2/2.0 (-1) | 1,084 (-6%) | 17mo | $199,000 | $184 | 38 |
| 4508 Belfountain St | 0.43mi | 2/2.0 (-1) | 1,008 (-12%) | 23mo | $324,500 | $322 | 36 |
Match score weights: distance 35% · size 25% · config 20% · recency 20%. Top-matched comps best support the ARV.
Projected returns pro-forma
-3.0% appreciation · 0.0% rent growth · sell at horizon
- IRR
- -9.3%
- Equity multiple
- 0.67×
- Total profit
- $-18,789
- Equity at exit
- $30,566
- IRR
- -5.3%
- Equity multiple
- 0.71×
- Total profit
- $-16,604
- Equity at exit
- $17,725
Cash invested: $57,400 (down + closing). Projections, not guarantees.
Landlord ↔ Tenant lean methodology
- Overall (STATE)
- 87 Strongly Landlord-Friendly
- State Florida
- 87 Strongly Landlord-Friendly · R+3
- County
- — inherits STATE
- City
- — inherits STATE
ZIP-level market 33948
- Home prices YoY
- -14.9%
- Rents YoY
- -1.6%
- Active inventory
- 953
- Price-to-rent
- 6.7×
Monthly cashflow live
- Estimated rent
- $2,568 high interval (Pro) →
- Mortgage (P&I)
- −$1,075
- Tax from tax record
- −$100 /mo · $1,199/yr
- Insurance
- −$85
- Flood insurance flood zone
- −$427 /mo · $5,118/yr
- HOA
- −$0
- Vacancy / Maint / Mgmt
- −$539
- Net cashflow
- $341
Break-even live
UW: 25.0% down · 7.5% · 30yr · 1.5% tax · 5.0% vac · 8.0% maint · 8.0% mgmt
Financing live
Cash to close
- Down payment
- $51,250
- Closing costs
- $6,150
- Reserves months
- —
- Total cash needed
- —
Loan-product check · same deal, 3 products live
Conventional
25% down · 7.5% · 30yr
- Down + closing
- —
- Monthly P&I
- —
- Monthly cashflow
- —
- DSCR
- —
- Eligible?
- —
Personal DTI + credit; lowest rate.
DSCR
20% down · 8.5% · 30yr
- Down + closing
- —
- Monthly P&I
- —
- Monthly cashflow
- —
- DSCR
- —
- Eligible?
- —
No personal income docs; deal must DSCR.
Hard money
10% down · 12.0% · 12mo
- Down + closing
- —
- Monthly P&I
- —
- Monthly cashflow
- —
- DSCR
- —
- Eligible?
- —
Short-term bridge; refi at stabilization.
Rent comps 20 comps
| Address | Beds | Baths | Sqft | Rent | $/sqft | DOM | Units | Dist |
|---|---|---|---|---|---|---|---|---|
| 18686 Van Nuys Cir Port Charlotte, FL | 3.0 | 2.0 | 1168 | $1,600 | $1.37 | 21d | 1 | 0.18mi |
| 18058 Avonsdale Cir Port Charlotte, FL | 3.0 | 2.0 | 1453 | $4,000 | $2.75 | 21d | 1 | 0.48mi |
| 18019 Avonsdale Cir Port Charlotte, FL | 3.0 | 2.0 | 1202 | $1,900 | $1.58 | 21d | 1 | 0.54mi |
| 18810 Ashcroft Cir Port Charlotte, FL | 3.0 | 2.0 | 1387 | $3,800 | $2.74 | 21d | 1 | 0.54mi |
| 4670 Herman Cir Port Charlotte, FL | 3.0 | 2.0 | 1350 | $2,200 | $1.63 | 21d | 1 | 0.57mi |
| 18289 Wolbrette Cir Port Charlotte, FL | 2.0 | 2.0 | 1393 | $4,000 | $2.87 | 21d | 1 | 0.62mi |
| 18634 Goodman Cir Port Charlotte, FL | 3.0 | 1.5 | 1182 | $1,700 | $1.44 | 14d | 1 | 0.65mi |
| 5081 Administration St Port Charlotte, FL | 2.0 | 1.0 | 900 | $1,500 | $1.67 | 21d | 1 | 0.69mi |
| 18493 Lake Worth Blvd Port Charlotte, FL | 2.0 | 2.0 | 1006 | $1,500 | $1.49 | 21d | 1 | 0.80mi |
| 4518 Wynkoop Cir Port Charlotte, FL | 2.0 | 2.0 | 1409 | $1,995 | $1.42 | 14d | 1 | 0.88mi |
| 18312 Driggers Ave Port Charlotte, FL | 3.0 | 2.0 | 1428 | $5,400 | $3.78 | 21d | 1 | 0.90mi |
| 18625 Alphonse Cir Port Charlotte, FL | 2.0 | 2.0 | 960 | $4,000 | $4.17 | 21d | 1 | 0.91mi |
| 18608 Alphonse Cir Port Charlotte, FL | 3.0 | 2.0 | 1441 | $4,000 | $2.78 | 21d | 1 | 0.94mi |
| 4192 Gingold St Port Charlotte, FL | 3.0 | 2.0 | 1127 | $4,200 | $3.73 | 21d | 1 | 0.95mi |
| 4399 Mundella Cir Port Charlotte, FL | 3.0 | 2.0 | 1140 | $3,200 | $2.81 | 21d | 1 | 1.01mi |
| 4112 Gingold St Port Charlotte, FL | 2.0 | 1.5 | 1056 | $3,300 | $3.12 | 21d | 1 | 1.02mi |
| 4342 Ewing Cir Port Charlotte, FL | 3.0 | 2.0 | 1260 | $2,500 | $1.98 | 21d | 1 | 1.03mi |
| 4123 Michel Tree St Port Charlotte, FL | 3.0 | 2.0 | 920 | $1,750 | $1.90 | 21d | 1 | 1.09mi |
| 18522 Robinson Ave Port Charlotte, FL | 3.0 | 2.0 | 1252 | $2,000 | $1.60 | 21d | 1 | 1.25mi |
| 17364 Sabrina Cir Port Charlotte, FL | 3.0 | 2.0 | 1204 | $1,980 | $1.64 | 21d | 1 | 1.28mi |
Listing history 18 events
-
2026-06-18price $205,000 Active 74 DOM
-
2026-06-18days on market $220,000 Active 74 DOM
-
2026-06-17days on market $220,000 Active 73 DOM
-
2026-06-16days on market $220,000 Active 72 DOM
-
2026-06-15days on market $220,000 Active 71 DOM
-
2026-06-14days on market $220,000 Active 69 DOM
-
2026-06-13days on market $220,000 Active 68 DOM
-
2026-06-10days on market $220,000 Active 66 DOM
-
2026-06-09days on market $220,000 Active 65 DOM
-
2026-06-08days on market $220,000 Active 64 DOM
-
2026-06-07days on market $220,000 Active 63 DOM
-
2026-06-05days on market $220,000 Active 60 DOM
-
2026-06-03days on market $220,000 Active 59 DOM
-
2026-06-02days on market $220,000 Active 58 DOM
-
2026-06-01days on market $220,000 Active 57 DOM
-
2026-05-31days on market $220,000 Active 56 DOM
-
2026-05-30days on market $220,000 Active 55 DOM
-
2026-04-05$220,000 Active
ⓘ Source: listings_history table (triggers on properties + properties_extension) + one-shot
backfill from property_details.listing_events for pre-trigger history.
Tax reassessment forecast FL · Resets to sale price
- Current annual tax
- $1,199 · $100/mo
- Projected year-2 tax
- $1,702 · $142/mo
- Expected delta
- +$502/yr (+$42/mo · 41.9%)
ⓘ Screening estimate from a state-policy table — verify with the county assessor before closing.
Climate risk First Street
- Flood 9/10 Extreme FEMA zone AE · 99% chance over 30 yrs
- Wildfire 1/10 Low
- Heat 10/10 Extreme 7 d/yr ≥107°F today · 27 d/yr by 30 yrs out
- Wind 10/10 Extreme 99% chance of damaging wind over 30 yrs
- Air quality 3/10 Moderate 2 unhealthy d/yr today · 2 by 30 yrs out
Nearby sold comps map
Loading sold comps map…
Walkable amenities ~0.75 mi
Loading nearby amenities…
Taxation est. · year 1
- Rental income
- $30,811
- − Mortgage interest
- −$11,483
- − Property taxes
- −$1,199
- − Insurance
- −$6,144
- − Repairs & maintenance
- −$2,465
- − Management
- −$2,465
- − Depreciation
- −$5,964
- Taxable income
- $1,092
- Est. tax owed @ 24.0%
- −$262
- After-tax cash flow
- $3,836/yr
For passive investors: Depreciation is non-cash, so a rental often shows a tax loss while cash-flowing — sheltering income. Rental losses are passive: they offset passive income freely, and up to $25,000/yr can offset ordinary (W-2) income if you actively participate and your MAGI is under $100k (phasing out to $0 by $150k); unused losses carry forward. On sale, claimed depreciation is recaptured at up to 25%, and gains may owe capital-gains tax (a 1031 exchange can defer both). Figures are a year-1 estimate at your 24.0% rate — not tax advice; consult a CPA.
Schools (NCES district)
- District
- Charlotte
- NCES district ID
- 1200240
- Math proficiency
- 54% ▼ -6.00%
- Reading proficiency
- 54% ▼ -1.00%
- Median HH income
- $44,864
- Composite
- 45.62/100
- National rank
- #2586
- State rank
- #22 of 73 in FL
Livability — Port Charlotte
- Score
- 65/100
- State rank
- #655
- US rank
- #13081
Category grades
Schools grade is shown separately in the Schools card above.
Census & demographics
- Census place
- Port Charlotte, FL
- County
- Charlotte County · 196,994 people
- City population
- 102,180
- Metro
- Punta Gorda, FL
- Population (ZIP)
- 18,696
- Household income
- $62,744
- Rent vs Own
- Severe rent burden
- 501.0
Population outlook (Charlotte County) Hauer SSP2
- Today (2025)
- 198,646 people
- By 2030
- 210,507 · +6.0%
- By 2040
- 230,857 · +16.2%
- By 2050
- 247,148 · +24.4%
- By 2075
- 281,777 · +41.8%
- By 2100
- 293,609 · +47.8%
Race, ethnicity, and origin ACS 2023
- Neighborhood character
- Predominantly White (79%)
- Race & ethnicity
- White 79% Two or more races 8% Black 7% Hispanic / Latino 7% Asian 2%
- Hispanic origin (detail)
- Mexican 2% Puerto Rican 1%
- Common ancestry
- Lithuanian 5% Romanian 4% Iranian 2%
- Foreign-born
- 11% · Canada
- Languages at home
- 88% English-only · Spanish 5% Russian/Polish/Slavic 2% Other Indo-European 1%
Political lean MEDSL · Charlotte
- 2024 margin
- Solid R (+34.0) · D 32.7% · R 66.7%
- 2008→2024 swing
- -26.7pp toward R · 2008: -7.2pp · 2024: -34.0pp
- All cycles
- 2024: R+34.0 2020: R+26.6 2016: R+27.8 2012: R+14.3 2008: R+7.2
Not yet ingested
- Civics
- —
Market trends
- HPI YoY
- ▼ -55.31%
- Current HPI
- 315.0548
- Rent YoY
- ▼ -1.63%
- Metro
- Punta Gorda, FL
- State GDP YoY
- ▲ 3.28%
- F500 in state
- 36
Industry mix (Fortune 500 HQ in FL)
| Industry | F500 HQs | Revenue |
|---|---|---|
| Industrial Technology | 2 | $29B |
|
||
| Insurance | 2 | $17B |
|
||
| Retail | 1 | $60B |
|
||
| Technology Distribution | 1 | $58B |
|
||
| Homebuilding | 1 | $35B |
|
||
| Technology Manufacturing | 1 | $35B |
|
||
Price history
1 event — show timeline
- 2026-04-05 Listed $220,000 Stellar MLS as Distributed by MLS Grid
Property tax history
+3.1%/yrLatest (2025): $1,199 · +1.2% YoY. Source: county tax records.
Cash-flow waterfall
monthlySold comps — $/sqft
last 12 mo · ≤1 miLoading sold comps…