6239 Plymouth Rock Ln · Citrus Heights, CA
Flood risk 5/10 · Moderate
- FEMA flood zone
- X (unshaded)
- Chance of flooding over 30 yrs
- 0.32%
- Est. flood insurance / yr
- $507 – $1,088
Fire risk 1/10 · Minimal
- Est. fire insurance / yr
- $659 – $1,223
Heat risk 7/10 · Major
- Hot days now (above 102°F)
- 7 days/yr
- Hot days in 30 yrs
- 16 days/yr
Wind risk 1/10 · Minimal
- Chance of severe wind over 30 yrs
- —
Air-quality risk 10/10 · Severe
- Unhealthy air days now
- 34 days/yr
- Unhealthy air days in 30 yrs
- 36 days/yr
Risk factors via First Street. Map © Google.
Why this score? — see what drove the B- grade
The composite is a weighted blend of 9 inputs, each scored 0–100. Each bar is that input's sub-score; the figure is the points it added to the 100-point composite (weight × sub-score).
- Cash flow +30.0/30.0
- DSCR +10.0/10.0
- 1% rule +9.0/10.0
- ARV discount +6.5/15.0
- Schools +4.4/10.0
- Condition / age +4.0/5.0
- Rent growth +3.0/5.0
- Livability +3.0/5.0
- Appreciation +0.0/10.0
$165,000
🖨 Deal sheet 📄 Offer letter ✓ Due diligence
Listing remarks
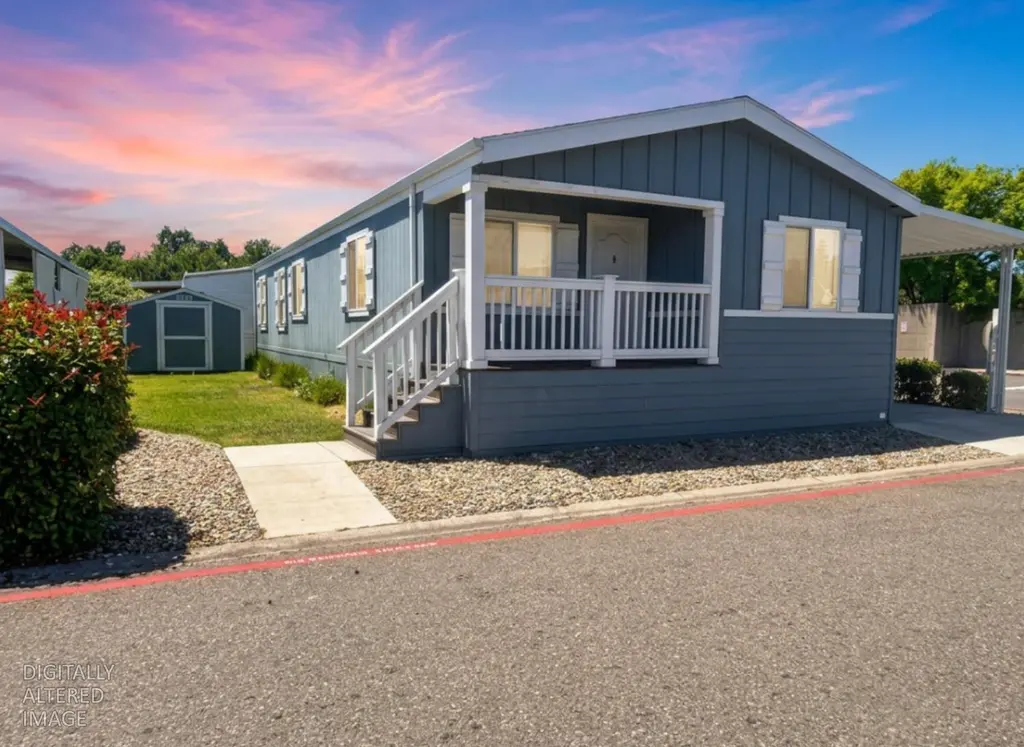
Welcome to 6239 Plymouth Rock Lane, a beautifully maintained one-owner home built in 2019 that showcases true pride of ownership throughout. This spacious residence features beautiful finishes, a thoughtfully designed floor plan, and an exceptionally clean, move-in-ready interior. The bright living spaces and well-appointed kitchen create a warm and inviting atmosphere for both everyday living and entertaining, while generous bedrooms and ample storage provide comfort and functionality. Step outside to enjoy the private side yard, complete with a storage shed for added convenience and extra outdoor storage. Located in a desirable community, residents enjoy access to a sparkling pool, clubho
Key facts
- Clubhouse
- Private side yard
- Storage shed
Tags
Property features AI
Finance
- Other: Located in Creekside Estates subdivision; Directions: East on I-80, exit 98 Greenback, right on Greenback, right on Indian River; Postal code 95621, Citrus Heights, CA
- HOA & community: No homeowners association; Not a senior community
Exterior
- Parking: Attached 2-car garage
- Utilities: 220 volt electric service; Public water; Public sewer; Irrigation from public district
- Home design: Manufactured home (attached); Residential property; Built in 2019; Single-story
- Construction: Shingle roof
- Exterior features: Corner lot; Low-maintenance yard; Shed/storage structure on property; Common facility pool and a private pool
Interior
- Kitchen: Granite counters; Kitchen island; Dining and family room combined
- Bedrooms: 3 bedrooms
- Flooring: Carpet
- Bathrooms: 2 full bathrooms; Bathrooms include shower stall(s), double sinks, and a sunken tub
- Heating & cooling: Central heating; Central air conditioning; Ceiling fans
- Interior features: Cathedral/vaulted living area with great room layout; Front porch; One-level living
- Laundry & utility: Indoor laundry hookups (inside room/area)
Neighborhood map
What this means for you Summary
Snapshot
- This is a 3-bed/2.0-bath manufactured listed at $165k. Condition is rated good.
Deal economics
- At list price, monthly cash flow is $684 ($8k/yr) — positive.
- The deal already cash-flows at list — no discount required.
- Meets the 1% rule at list price ($2k rent vs $165k).
- Cap rate 11.3% vs local median 3.4% in Citrus Heights — top-decile yield for the area; either an underpriced asset or a hidden risk that comps aren't pricing in. Stress-test before assuming the spread holds.
Location & tenants
- Location reads 60/100 on livability (#614 in CA) — a middle-class / working-renter tenant base. Strengths: housing A+; Watch: schools D, crime D-, amenities F.
- San Juan Unified (suburban): math 40% / reading 62% proficiency, ranked #138 of 517 in CA (top 27%) — acceptable for families but not a draw, mixed tenant base, ~2y average lease.
- Market conditions: Rents rising (+1.9%/yr); 210 active listings in the ZIP; 38 comparable units currently listed for rent nearby; rentals at typical pace (median 18d on market — plan ~3-4 weeks tenant-placement turnaround); solid renter incomes; 6,825 units permitted in Sacramento County in 2024 (1,752 in 5+ unit buildings).
- This rent runs 34% of the median local income ($81k/yr) — at the standard rent-burdened threshold; future hikes will face affordability resistance.
Forward outlook
- Local home prices are declining (-3.0%/yr); year-one equity from $1k of loan paydown is wiped out by about $5k of value loss. Plan a longer hold.
- Sacramento County population projected at +17% by 2050 — long-run rental-demand tailwind backs the buy-and-hold thesis.
- At projected returns (-3.0% appreciation + 1.9% rent growth), your $46k cash investment doubles in ~8 years — after that, you're playing with house money.
Negotiation context
- Only 9 days on market — expect competitive offers; lowballing is unlikely to land.
Risks & watch-outs
- Climate carrying-cost: moderate flood risk; extreme-heat days projected 7→16/yr by 2055 (HVAC capex compounding) — expect insurance premiums to compound above CPI over the hold.
Questions for the listing agent
- Is there a deadline driving the sale (1031 exchange, divorce, estate, relocation)? That informs how much negotiation room exists.
- Schools are D-rated, which usually means shorter tenancies and higher turnover. Who's the typical renter profile here, and what's been the actual vacancy rate?
- Crime grade is D in this area — have there been break-ins, vandalism, or insurance claims at this property in the last 3 years? What carrier currently insures it and at what premium?
- What's the average days-on-market for RENTAL listings here right now (not sales)? A rising rental-DOM trend means longer vacancies and softer asking-rent achievability than the comps imply.
- What's the recent tenant-quality profile in this submarket — average credit score on applications, eviction rate, late-payment / NSF rate, and stable-employment percentage? A property-management company in the area should have these aggregated.
- How much new for-sale + rental construction is in the pipeline within 1–3 miles? Heavy new supply typically softens prices + rents 12–24 months out; constrained supply supports both.
Investment metrics
- 1% rule
- 1.40% ✓
- Cap rate
- 11.27%
- Cash-on-cash
- 17.76%
- DSCR
- 1.79
- GRM
- 6.0
CMA / ARV
- ARV (on-the-fly)
- $161,280
- Comps found
- 12
Show comp detail 12 sales within ~0.75 mi
| Address | Dist | Beds/Ba | Sqft | Sold | Price | $/sf | Match |
|---|---|---|---|---|---|---|---|
| 6206 Plymouth Rock Ln #110 | 0.14mi | 3/2.0 | 1,536 (+14%) | 1mo | $159,000 | $104 | 69 |
| 6113 Summerset Ln | 0.63mi | 2/2.0 (-1) | 1,344 (0%) | 1mo | $169,000 | $126 | 64 |
| 6105 Mame Ct | 0.48mi | 3/2.0 | 1,248 (-7%) | 3mo | $85,000 | $68 | 63 |
| 6621 Grosse Point Ct | 0.46mi | 2/2.0 (-1) | 1,248 (-7%) | 1mo | $130,000 | $104 | 61 |
| 6625 Shamus Ct | 0.44mi | 3/2.0 | 1,248 (-7%) | 8mo | $190,000 | $152 | 61 |
| 6116 Mame Ct | 0.49mi | 2/2.0 (-1) | 1,440 (+7%) | 3mo | $179,000 | $124 | 58 |
| 6641 Grosse Point Ct | 0.50mi | 2/2.0 (-1) | 1,464 (+9%) | 3mo | $175,000 | $120 | 54 |
| 6116 Mame Ct #905 | 0.49mi | 2/2.0 (-1) | 1,440 (+7%) | 8mo | $100,000 | $69 | 54 |
| 6637 Grosse Point Ct | 0.50mi | 3/2.0 | 1,536 (+14%) | 1mo | $95,000 | $62 | 52 |
| 6143 Blucher Ln | 0.71mi | 2/2.0 (-1) | 1,401 (+4%) | 8mo | $170,000 | $121 | 48 |
| 6625 Galaxy Ct | 0.45mi | 2/2.0 (-1) | 1,146 (-15%) | 2mo | $155,000 | $135 | 48 |
| 6845 Caywood Ct | 0.72mi | 2/2.0 (-1) | 1,536 (+14%) | 2mo | $150,000 | $98 | 36 |
Match score weights: distance 35% · size 25% · config 20% · recency 20%. Top-matched comps best support the ARV.
Projected returns pro-forma
-3.0% appreciation · 1.9% rent growth · sell at horizon
- IRR
- 8.0%
- Equity multiple
- 1.31×
- Total profit
- $14,321
- Equity at exit
- $24,602
- IRR
- 16.3%
- Equity multiple
- 2.27×
- Total profit
- $58,546
- Equity at exit
- $14,266
Cash invested: $46,200 (down + closing). Projections, not guarantees.
Landlord ↔ Tenant lean methodology
- Overall (STATE)
- 18 Strongly Tenant-Friendly
- State California
- 18 Strongly Tenant-Friendly · D+13
- County
- — inherits STATE
- City
- — inherits STATE
ZIP-level market 95621
- Rents YoY
- 1.9%
- Active inventory
- 210
- Price-to-rent
- 6.0×
Monthly cashflow live
- Estimated rent
- $2,309 high interval (Pro) →
- Mortgage (P&I)
- −$865
- Tax est. 1.5%
- −$206 /mo · $2,475/yr
- Insurance
- −$69
- HOA
- −$0
- Vacancy / Maint / Mgmt
- −$485
- Net cashflow
- $684
Break-even live
UW: 25.0% down · 7.5% · 30yr · 1.5% tax · 5.0% vac · 8.0% maint · 8.0% mgmt
Financing live
Cash to close
- Down payment
- $41,250
- Closing costs
- $4,950
- Reserves months
- —
- Total cash needed
- —
Loan-product check · same deal, 3 products live
Conventional
25% down · 7.5% · 30yr
- Down + closing
- —
- Monthly P&I
- —
- Monthly cashflow
- —
- DSCR
- —
- Eligible?
- —
Personal DTI + credit; lowest rate.
DSCR
20% down · 8.5% · 30yr
- Down + closing
- —
- Monthly P&I
- —
- Monthly cashflow
- —
- DSCR
- —
- Eligible?
- —
No personal income docs; deal must DSCR.
Hard money
10% down · 12.0% · 12mo
- Down + closing
- —
- Monthly P&I
- —
- Monthly cashflow
- —
- DSCR
- —
- Eligible?
- —
Short-term bridge; refi at stabilization.
Rent comps 38 comps
| Address | Beds | Baths | Sqft | Rent | $/sqft | DOM | Units | Dist |
|---|---|---|---|---|---|---|---|---|
| 6219 Oak Valley Ln Citrus Heights, CA | 3.0 | 2.5 | 1304 | $2,295 | $1.76 | 43d | 1 | 0.28mi |
| 6219 Oak Valley Ln Citrus Heights, CA | 3.0 | 3.0 | 1304 | $2,295 | $1.76 | 17d | 1 | 0.28mi |
| 6011 Shadow Ln Citrus Heights, CA | 1.0–2.0 | 1.0–2.0 | 779 | $2,348 | $3.01 | 1d | 15 | 0.32mi |
| 5979 Devecchi Ave Citrus Heights, CA | 1.0–2.0 | 1.0–2.0 | 775 | $1,871 | $2.41 | 1d | 15 | 0.37mi |
| 6203 Ackland Ct Citrus Heights, CA | 3.0 | 1.5 | 1322 | $2,500 | $1.89 | 23d | 1 | 0.42mi |
| 6104 Rockport Ln Citrus Heights, CA | 3.0 | 2.5 | 1150 | $2,295 | $2.00 | 21d | 1 | 0.45mi |
| 5844 Garden Park Ct Unit RV 5877-B Carmichael, CA | 2.0 | 1.0 | 915 | $1,575 | $1.72 | 16d | 1 | 0.62mi |
| 5844 Garden Park Ct Unit RV 5853-D Carmichael, CA | 2.0 | 1.0 | 915 | $1,525 | $1.67 | 16d | 1 | 0.62mi |
| 5718 Manzanita Ave Carmichael, CA | 2.0 | 1.0 | 980 | $2,000 | $2.04 | 43d | 1 | 0.66mi |
| 5922 Petaluma Ct Sacramento, CA | 2.0 | 2.0 | 1048 | $2,075 | $1.98 | 1d | 1 | 0.71mi |
| 5417 Olympic Way Sacramento, CA | 2.0 | 1.0 | 920 | $1,795 | $1.95 | 14d | 1 | 0.76mi |
| 6025 Dewey Dr Citrus Heights, CA | 3.0 | 2.0 | 1847 | $2,500 | $1.35 | 23d | 1 | 0.84mi |
| 5587 Keoncrest Cir Unit 2 Sacramento, CA | 2.0 | 1.5 | 900 | $2,000 | $2.22 | 1d | 1 | 0.85mi |
| 6333 Aslin Way Carmichael, CA | 4.0 | 2.0 | 1257 | $2,750 | $2.19 | 43d | 1 | 0.86mi |
| 6558 Meadowcreek Way Citrus Heights, CA | 3.0 | 2.0 | 1304 | $2,500 | $1.92 | 43d | 1 | 0.87mi |
| 6687 Greenback Ln Citrus Heights, CA | 3.0 | 2.0 | 1323 | $2,495 | $1.89 | 17d | 1 | 0.89mi |
| 6000 Coyle Ave Carmichael, CA | 4.0 | 2.0 | 1120 | $2,295 | $2.05 | 23d | 1 | 0.91mi |
| 6319 Misty Wood Way Citrus Heights, CA | 3.0 | 2.0 | 1454 | $2,500 | $1.72 | 43d | 1 | 0.96mi |
| 6034 Centurion Cir Citrus Heights, CA | 4.0 | 2.0 | 1726 | $3,100 | $1.80 | 43d | 1 | 0.99mi |
| 5233 Calistoga Way Sacramento, CA | 3.0 | 2.0 | 1200 | $2,495 | $2.08 | 1d | 1 | 0.99mi |
| 6225 Wildomar Way Carmichael, CA | 3.0 | 1.0 | 1040 | $3,000 | $2.88 | 43d | 1 | 1.10mi |
| 6913 Gold Run Ave Sacramento, CA | 4.0 | 2.0 | 1474 | $2,800 | $1.90 | 20d | 1 | 1.13mi |
| 6940 Trailride Way Citrus Heights, CA | 3.0 | 2.0 | 1527 | $2,695 | $1.76 | 43d | 1 | 1.13mi |
| 6948 Sunburst Way Citrus Heights, CA | 4.0 | 2.5 | 1673 | $3,000 | $1.79 | 43d | 1 | 1.14mi |
| 6004 Rutland Dr Unit 128 Carmichael, CA | 2.0 | 1.0 | 900 | $1,495 | $1.66 | 3d | 1 | 1.19mi |
| 6841 Concert Way Sacramento, CA | 2.0 | 2.0 | 1000 | $1,995 | $2.00 | 1d | 1 | 1.20mi |
| 5308 Winfield Way #2 Sacramento, CA | 3.0 | 1.5 | 1105 | $2,100 | $1.90 | 43d | 1 | 1.27mi |
| 6600 Hillsdale Blvd Sacramento, CA | 3.0 | 3.0 | 1686 | $2,600 | $1.54 | 16d | 1 | 1.28mi |
| 5300 Winfield Way #2 Sacramento, CA | 3.0 | 1.5 | 1105 | $2,100 | $1.90 | 23d | 1 | 1.30mi |
| 7024 San Altos Cir Citrus Heights, CA | 2.0 | 2.0 | 1120 | $2,800 | $2.50 | 43d | 1 | 1.31mi |
| 5425 Garfield Ave Sacramento, CA | 1.0–2.0 | 1.0–2.0 | 787 | $1,650 | $2.10 | 20d | 5 | 1.34mi |
| 7120 Van Maren Ln Citrus Heights, CA | 3.0 | 2.0 | 1292 | $2,495 | $1.93 | 17d | 1 | 1.34mi |
| 6200 Osullivan Ln Sacramento, CA | 2.0 | 2.0 | 1316 | $1,775 | $1.35 | 7d | 1 | 1.35mi |
| 5322 Hemlock St Sacramento, CA | 1.0–2.0 | 1.0 | 800 | $1,875 | $2.34 | 1d | 2 | 1.39mi |
| 5233 Columbine Way Carmichael, CA | 3.0 | 2.0 | 1008 | $2,375 | $2.36 | 3d | 1 | 1.44mi |
| 7135 Cobalt Way Citrus Heights, CA | 3.0 | 1.0 | 1200 | $1,995 | $1.66 | 3d | 1 | 1.45mi |
| 6172 Peoria Dr Citrus Heights, CA | 2.0 | 1.0 | 917 | $1,695 | $1.85 | 3d | 1 | 1.47mi |
| 6820 Lincoln Oaks Dr Fair Oaks, CA | 3.0 | 2.0 | 1544 | $3,150 | $2.04 | 12d | 1 | 1.48mi |
Listing history 12 events
-
2026-06-18days on market $165,000 Active 9 DOM
-
2026-06-17days on market $165,000 Active 8 DOM
-
2026-06-16days on market $165,000 Active 7 DOM
-
2026-06-15days on market $165,000 Active 6 DOM
-
2026-06-13days on market $165,000 Active 4 DOM
-
2026-06-13days on market $165,000 Active 3 DOM
-
2026-06-10days on market $165,000 Active 1 DOM
-
2026-06-09days on market $165,000 Active 5 DOM
-
2026-06-08days on market $165,000 Active 4 DOM
-
2026-06-07days on market $165,000 Active 3 DOM
-
2026-06-05remarks 699-char remark
-
2026-06-05$165,000 Active 1 DOM
ⓘ Source: listings_history table (triggers on properties + properties_extension) + one-shot
backfill from property_details.listing_events for pre-trigger history.
Climate risk First Street
- Flood 5/10 Major FEMA zone X (unshaded) · 32% chance over 30 yrs
- Wildfire 1/10 Low
- Heat 7/10 Severe 7 d/yr ≥102°F today · 16 d/yr by 30 yrs out
- Wind 1/10 Low
- Air quality 10/10 Extreme 34 unhealthy d/yr today · 36 by 30 yrs out
Nearby sold comps map
Loading sold comps map…
Walkable amenities ~0.75 mi
Loading nearby amenities…
Taxation est. · year 1
- Rental income
- $27,708
- − Mortgage interest
- −$9,243
- − Property taxes
- −$2,475
- − Insurance
- −$825
- − Repairs & maintenance
- −$2,217
- − Management
- −$2,217
- − Depreciation
- −$4,800
- Taxable income
- $5,932
- Est. tax owed @ 24.0%
- −$1,424
- After-tax cash flow
- $6,782/yr
For passive investors: Depreciation is non-cash, so a rental often shows a tax loss while cash-flowing — sheltering income. Rental losses are passive: they offset passive income freely, and up to $25,000/yr can offset ordinary (W-2) income if you actively participate and your MAGI is under $100k (phasing out to $0 by $150k); unused losses carry forward. On sale, claimed depreciation is recaptured at up to 25%, and gains may owe capital-gains tax (a 1031 exchange can defer both). Figures are a year-1 estimate at your 24.0% rate — not tax advice; consult a CPA.
Condition & rehab AI · 13 photos
This home is in good condition with a well-maintained interior and exterior. It is move-in ready and has the potential for minor cosmetic improvements to further enhance its value.
Value-add opportunities
- Resale Paint the exterior siding — A fresh coat of paint can significantly enhance the curb appeal and value of the home.
- Rental Replace worn-out flooring — Upgrading the flooring can improve the overall look and feel of the home, making it more appealing to renters.
Renovation cost estimate screening
Value-add ROI direction
- Resale Paint the exterior siding — A fresh coat of paint can significantly enhance the curb appeal and value of the home. ↑
- Rental Replace worn-out flooring — Upgrading the flooring can improve the overall look and feel of the home, making it more appealing to renters. ↑
ⓘ Cost ranges are severity-bucket heuristics (US national rule-of-thumb). Get contractor quotes + a written scope before underwriting a rehab budget.
Schools (NCES district)
- District
- San Juan Unified
- NCES district ID
- 0634620
- Math proficiency
- 40% ▲ 3.00%
- Reading proficiency
- 62% ▲ 16.00%
- Median HH income
- $55,655
- Composite
- 44.07/100
- National rank
- #2878
- State rank
- #138 of 517 in CA
Livability — Citrus Heights
- Score
- 60/100
- State rank
- #614
- US rank
- #19580
Category grades
Schools grade is shown separately in the Schools card above.
Census & demographics
- Census place
- Citrus Heights, CA
- County
- Sacramento County · 1,539,646 people
- City population
- 89,370
- Metro
- Sacramento-Roseville-Folsom, CA
- Population (ZIP)
- 42,442
- Household income
- $80,901
- Rent vs Own
- Severe rent burden
- 1854.0
Population outlook (Sacramento County) Hauer SSP2
- Today (2025)
- 1,660,763 people
- By 2030
- 1,732,990 · +4.3%
- By 2040
- 1,855,755 · +11.7%
- By 2050
- 1,941,335 · +16.9%
- By 2075
- 2,046,162 · +23.2%
- By 2100
- 1,961,444 · +18.1%
Race, ethnicity, and origin ACS 2023
- Neighborhood character
- Predominantly White (66%)
- Race & ethnicity
- White 66% Hispanic / Latino 19% Two or more races 11% Asian 6% Black 2%
- Hispanic origin (detail)
- Mexican 16%
- Common ancestry
- Subsaharan African 3% Lithuanian 3% Scotch-Irish 2%
- Foreign-born
- 15% · Canada, Vietnam
- Languages at home
- 78% English-only · Spanish 10% Russian/Polish/Slavic 6% Other Indo-European 3%
Political lean MEDSL · Sacramento
- 2024 margin
- D (+19.7) · D 58.1% · R 38.4% · Other 3.5%
- 2008→2024 swing
- +0.7pp no change · 2008: 19.0pp · 2024: 19.7pp
- All cycles
- 2024: D+19.7 2020: D+25.3 2016: D+23.7 2012: D+16.3 2008: D+19.0
Not yet ingested
- Civics
- —
Market trends
- HPI YoY
- ▼ -408.14%
- Current HPI
- 351.9333
- Rent YoY
- ▲ 1.90%
- Metro
- Sacramento-Roseville-Folsom, CA
- State GDP YoY
- ▲ 3.21%
- F500 in state
- 116
Industry mix (Fortune 500 HQ in CA)
| Industry | F500 HQs | Revenue |
|---|---|---|
| Technology | 27 | $1,492B |
|
||
| Financial Services | 3 | $174B |
|
||
| Retail | 3 | $44B |
|
||
| Insurance | 3 | $26B |
|
||
| Media / Entertainment | 2 | $115B |
|
||
| Pharmaceuticals / Biotech | 2 | $62B |
|
||
Cash-flow waterfall
monthlySold comps — $/sqft
last 12 mo · ≤1 miLoading sold comps…