21069 Lyndall Ln · Porter Heights, TX
Flood risk 1/10 · Minimal
- FEMA flood zone
- X (unshaded)
- Chance of flooding over 30 yrs
- 0.0%
- Est. flood insurance / yr
- $507 – $1,088
Fire risk 5/10 · Moderate
- Est. fire insurance / yr
- $1,222 – $2,270
Heat risk 8/10 · Major
- Hot days now (above 110°F)
- 7 days/yr
- Hot days in 30 yrs
- 24 days/yr
Wind risk 8/10 · Major
- Chance of severe wind over 30 yrs
- 99.0%
Air-quality risk 3/10 · Minor
- Unhealthy air days now
- 3 days/yr
- Unhealthy air days in 30 yrs
- 3 days/yr
Risk factors via First Street. Map © Google.
Why this score? — see what drove the C grade
The composite is a weighted blend of 9 inputs, each scored 0–100. Each bar is that input's sub-score; the figure is the points it added to the 100-point composite (weight × sub-score).
- Cash flow +23.9/30.0
- DSCR +7.7/10.0
- ARV discount +7.5/15.0
- 1% rule +5.0/10.0
- Livability +3.2/5.0
- Rent growth +2.9/5.0
- Schools +2.8/10.0
- Condition / age +2.5/5.0
- Appreciation +0.0/10.0
$209,999
🖨 Deal sheet (PDF) 📄 Offer letter ✓ Due diligence
Listing remarks
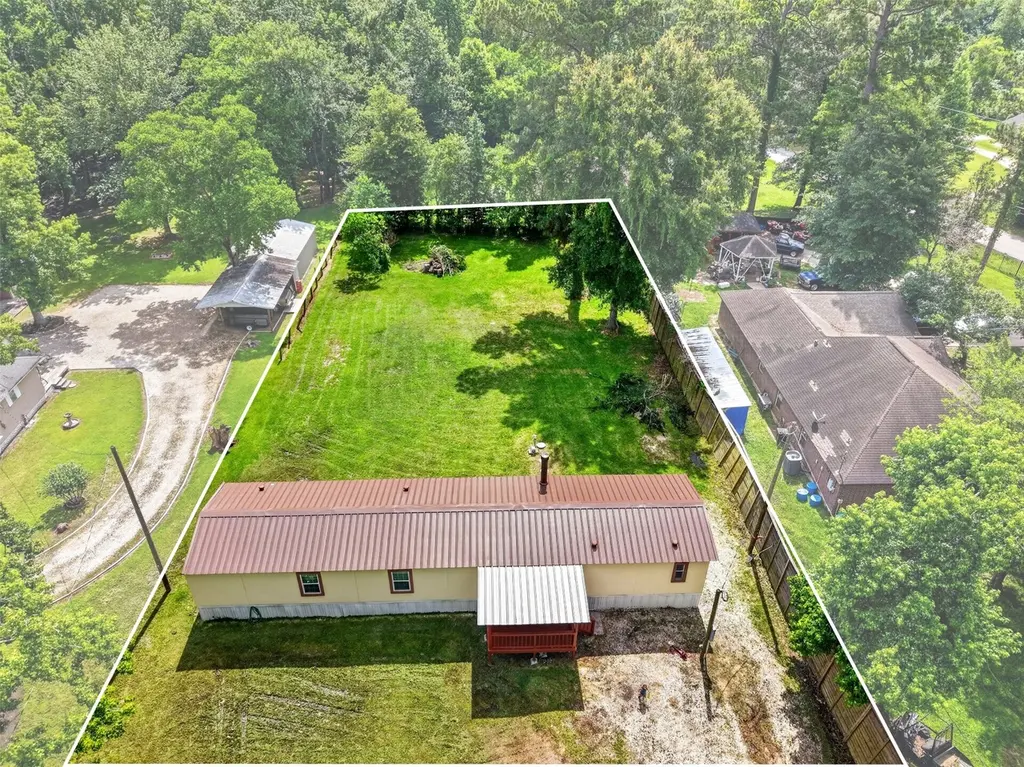
Welcome home to 21069 Lyndall Ln! Nestled on a spacious half-acre lot, this move-in ready property offers the perfect blend of modern updates and unrestricted country living. Step inside to discover new flooring throughout, fresh interior paint, new windows, new ceiling fans, and a cozy wood-burning fireplace that creates a warm and inviting atmosphere. Major exterior improvements include a new metal roof and new stucco exterior, giving you peace of mind for years to come. With NO HOA and NO RESTRICTIONS, the possibilities are endless—bring your chickens, goats, RV, build a pool, workshop, or create the backyard oasis you've always dreamed of. Enjoy the freedom to truly make this prop
Key facts
- New metal roof
- Half-acre lot
- New ceiling fans
Tags
Property features AI
Exterior
- Parking: No designated parking
- Utilities: Aerobic septic / septic tank; Concrete road access; Full ownership
- Home design: Residential property; Faces west; Built in 1997; Single-story entry (first-floor living areas listed)
- Construction: Stucco exterior; Metal roof; Block foundation
- Exterior features: Covered patio; Covered deck; Porch; Patio; Private yard; Partial fencing
Interior
- Kitchen: Electric cooktop; Electric oven; Microwave
- Bedrooms: Primary bedroom (first floor) — 12 x 16; Bedroom (first floor) — 10 x 11; Bedroom (first floor) — 7 x 13
- Flooring: Carpet; Tile
- Bathrooms: 2 full bathrooms; Primary bathroom (first floor) — 7 x 11; Bathroom (first floor) — 7 x 4
- Heating & cooling: Central heating (electric); Central air (electric)
- Interior features: Wood-burning fireplace (1); Double vanity; Kitchen island; Kitchen/family room combo; Tub with shower; Ceiling fans; Kitchen/dining combo
- Laundry & utility: Washer hookup; Electric dryer hookup
Neighborhood map
What this means for you Summary
Snapshot
- This is a 3-bed/2.0-bath manufactured listed at $210k.
Deal economics
- At list price, monthly cash flow is $409 ($5k/yr) — positive.
- The deal already cash-flows at list — no discount required.
- To meet the 1% rule (rent ≥ 1% of price), the offer needs to be $209k (0.3% below list).
- Recommended offer: $207k (1.5% below list) — sets the bar for market timing.
- Cap rate 8.6% vs local median 2.5% in Porter Heights — top-decile yield for the area; either an underpriced asset or a hidden risk that comps aren't pricing in. Stress-test before assuming the spread holds.
Location & tenants
- Location reads 65/100 on livability (#663 in TX) — a middle-class / working-renter tenant base. Strengths: crime A+, employment A+, cost of living A+; Watch: amenities F, commute F, health & safety F.
- New Caney ISD (suburban): math 31% / reading 32% proficiency, ranked #570 of 826 in TX (top 69%) — families likely to look elsewhere, expect single-tenant / working-renter base with shorter leases.
- Zoned schools: Robert Crippen El (math 23% / reading 23%, grade F, #3,277 of 4,322 statewide, top 77%, 858 students, 77% FRL); White Oak Middle (math 38% / reading 32%, grade F, #842 of 1,662 statewide, top 51%, 834 students, 75% FRL); Porter H S (math 31% / reading 38%, grade F, #963 of 1,632 statewide, top 61%, 2,209 students, 65% FRL) — zoned schools average 72% FRL vs 57% district-wide (16 pts higher); higher-poverty schools than district average — tighter screening recommended.
- Market conditions: Rents rising (+1.6%/yr); 953 active listings in the ZIP; 3 comparable units currently listed for rent nearby; rentals leasing fast (median 4d on market — plan ~1-2 weeks tenant-placement turnaround); solid renter incomes; 13,259 units permitted in Montgomery County in 2024 (1,402 in 5+ unit buildings).
Forward outlook
- Local home prices are declining (-3.0%/yr); year-one equity from $1k of loan paydown is wiped out by about $6k of value loss. Plan a longer hold.
- Montgomery County population projected at +65% by 2050 — long-run rental-demand tailwind backs the buy-and-hold thesis.
Negotiation context
- It's been on market 19 days — a 2% lower offer ($207k) is reasonable based on typical stale-listing flexibility.
- 2 sale attempts since 6y ago with the ask held roughly flat each time — persistent listings suggest the price (not the market) is what's stuck; bring a comps-based counter.
Risks & watch-outs
- Climate carrying-cost: severe wind risk, 99% chance of damaging wind over 30y; moderate wildfire risk; extreme-heat days projected 7→24/yr by 2055 (HVAC capex compounding) — expect insurance premiums to compound above CPI over the hold.
Questions for the listing agent
- Is there a deadline driving the sale (1031 exchange, divorce, estate, relocation)? That informs how much negotiation room exists.
- Schools are F-rated, which usually means shorter tenancies and higher turnover. Who's the typical renter profile here, and what's been the actual vacancy rate?
- What's the average days-on-market for RENTAL listings here right now (not sales)? A rising rental-DOM trend means longer vacancies and softer asking-rent achievability than the comps imply.
- What's the recent tenant-quality profile in this submarket — average credit score on applications, eviction rate, late-payment / NSF rate, and stable-employment percentage? A property-management company in the area should have these aggregated.
- How much new for-sale + rental construction is in the pipeline within 1–3 miles? Heavy new supply typically softens prices + rents 12–24 months out; constrained supply supports both.
Investment metrics
- 1% rule
- 1.00% ✗
- Cap rate
- 8.63%
- Cash-on-cash
- 8.34%
- DSCR
- 1.37
- GRM
- 8.4
CMA / ARV
No comps found within radius.
Projected returns pro-forma
-3.0% appreciation · 1.65% rent growth · sell at horizon
- IRR
- -5.0%
- Equity multiple
- 0.81×
- Total profit
- $-10,894
- Equity at exit
- $31,312
- IRR
- 3.1%
- Equity multiple
- 1.21×
- Total profit
- $12,447
- Equity at exit
- $18,157
Cash invested: $58,800 (down + closing). Projections, not guarantees.
Landlord ↔ Tenant lean methodology
- Overall (STATE)
- 87 Strongly Landlord-Friendly
- State Texas
- 87 Strongly Landlord-Friendly · R+5
- County
- — inherits STATE
- City
- — inherits STATE
ZIP-level market 77365
- Home prices YoY
- -33.0%
- Rents YoY
- 1.6%
- Active inventory
- 953
- Price-to-rent
- 8.4×
Monthly cashflow live
- Estimated rent
- $2,094 medium interval (Pro) →
- Mortgage (P&I)
- −$1,101
- Tax from tax record
- −$57 /mo · $680/yr
- Insurance
- −$87
- HOA
- −$0
- Vacancy / Maint / Mgmt
- −$440
- Net cashflow
- $409
Break-even live
Sensitivity live
| Price | -10% $528 | -5% $468 | +0% $409 | +5% $349 | +10% $290 |
|---|---|---|---|---|---|
| Rent | -10% $243 | -5% $326 | +0% $409 | +5% $492 | +10% $574 |
| Rate | -1.0pp $515 | -0.5pp $462 | base $409 | +0.5pp $354 | +1.0pp $299 |
UW: 25.0% down · 7.5% · 30yr · 1.5% tax · 5.0% vac · 8.0% maint · 8.0% mgmt
Financing live
Cash to close
- Down payment
- $52,500
- Closing costs
- $6,300
- Reserves months
- —
- Total cash needed
- —
Loan-product check · same deal, 3 products live
Conventional
25% down · 7.5% · 30yr
- Down + closing
- —
- Monthly P&I
- —
- Monthly cashflow
- —
- DSCR
- —
- Eligible?
- —
Personal DTI + credit; lowest rate.
DSCR
20% down · 8.5% · 30yr
- Down + closing
- —
- Monthly P&I
- —
- Monthly cashflow
- —
- DSCR
- —
- Eligible?
- —
No personal income docs; deal must DSCR.
Hard money
10% down · 12.0% · 12mo
- Down + closing
- —
- Monthly P&I
- —
- Monthly cashflow
- —
- DSCR
- —
- Eligible?
- —
Short-term bridge; refi at stabilization.
Rent comps 3 comps
| Address | Beds | Baths | Sqft | Rent | $/sqft | DOM | Units | Dist |
|---|---|---|---|---|---|---|---|---|
| 21625 Hackamore Ct Porter, TX | 3.0 | 2.0 | 1758 | $2,070 | $1.18 | 0d | 1 | 0.58mi |
| 18167 Woodsdale Ct Porter, TX | 4.0 | 2.5 | 1608 | $1,769 | $1.10 | 4d | 1 | 1.04mi |
| 18644 Swainboro Dr New Caney, TX | 3.0 | 2.0 | 1415 | $2,000 | $1.41 | 45d | 1 | 1.36mi |
Listing history 12 events
-
2026-06-21days on market $209,999 Active 19 DOM
-
2026-06-18days on market $209,999 Active 16 DOM
-
2026-06-17days on market $209,999 Active 15 DOM
-
2026-06-16days on market $209,999 Active 14 DOM
-
2026-06-15days on market $209,999 Active 13 DOM
-
2026-06-13days on market $209,999 Active 11 DOM
-
2026-06-09days on market $209,999 Active 7 DOM
-
2026-06-08days on market $209,999 Active 6 DOM
-
2026-06-07days on market $209,999 Active 5 DOM
-
2026-06-04days on market $209,999 Active 2 DOM
-
2026-06-02remarks 693-char remark
-
2026-06-02$209,999 Active 1 DOM
ⓘ Source: listings_history table (triggers on properties + properties_extension) + one-shot
backfill from property_details.listing_events for pre-trigger history.
Tax reassessment forecast TX · Resets to sale price
- Current annual tax
- $680 · $57/mo
- Projected year-2 tax
- $3,843 · $320/mo
- Expected delta
- +$3,163/yr (+$264/mo · 465.2%)
ⓘ Screening estimate from a state-policy table — verify with the county assessor before closing.
Climate risk First Street
- Flood 1/10 Low FEMA zone X (unshaded) · 0% chance over 30 yrs
- Wildfire 5/10 Major
- Heat 8/10 Severe 7 d/yr ≥110°F today · 24 d/yr by 30 yrs out
- Wind 8/10 Severe 99% chance of damaging wind over 30 yrs
- Air quality 3/10 Moderate 3 unhealthy d/yr today · 3 by 30 yrs out
Nearby sold comps map
Loading sold comps map…
Walkable amenities ~0.75 mi
Loading nearby amenities…
Taxation est. · year 1
- Rental income
- $25,127
- − Mortgage interest
- −$11,763
- − Property taxes
- −$680
- − Insurance
- −$1,050
- − Repairs & maintenance
- −$2,010
- − Management
- −$2,010
- − Depreciation
- −$6,109
- Taxable income
- $1,505
- Est. tax owed @ 24.0%
- −$361
- After-tax cash flow
- $4,544/yr
For passive investors: Depreciation is non-cash, so a rental often shows a tax loss while cash-flowing — sheltering income. Rental losses are passive: they offset passive income freely, and up to $25,000/yr can offset ordinary (W-2) income if you actively participate and your MAGI is under $100k (phasing out to $0 by $150k); unused losses carry forward. On sale, claimed depreciation is recaptured at up to 25%, and gains may owe capital-gains tax (a 1031 exchange can defer both). Figures are a year-1 estimate at your 24.0% rate — not tax advice; consult a CPA.
Schools (NCES district)
- District
- New Caney ISD
- NCES district ID
- 4832400
- Math proficiency
- 31% ▼ -16.00%
- Reading proficiency
- 32% ▼ -6.00%
- Median HH income
- $55,380
- Composite
- 27.97/100
- National rank
- #6857
- State rank
- #570 of 826 in TX
Livability — Porter Heights
- Score
- 65/100
- State rank
- #663
- US rank
- #12479
Category grades
Schools grade is shown separately in the Schools card above.
Census & demographics
- County
- Montgomery County · 663,713 people
- Metro
- Houston-The Woodlands-Sugar Land, TX
- Population (ZIP)
- 46,418
- Household income
- $95,702
- Rent vs Own
- Severe rent burden
- 1016.0
Population outlook (Montgomery County) Hauer SSP2
- Today (2025)
- 713,896 people
- By 2030
- 805,263 · +12.8%
- By 2040
- 992,708 · +39.1%
- By 2050
- 1,179,590 · +65.2%
- By 2075
- 1,628,084 · +128.1%
- By 2100
- 1,937,880 · +171.5%
Race, ethnicity, and origin ACS 2023
- Neighborhood character
- Diverse neighborhood (Simpson 0.59)
- Race & ethnicity
- Hispanic / Latino 46% White 44% Two or more races 15% Black 5% Asian 3%
- Hispanic origin (detail)
- Mexican 39% Puerto Rican 1%
- Common ancestry
- Lithuanian 4% Slovak 2% Romanian 2%
- Foreign-born
- 18% · Canada
- Languages at home
- 59% English-only · Spanish 36% Other Indo-European 2% Russian/Polish/Slavic 1%
Political lean MEDSL · Montgomery
- 2024 margin
- Solid R (+45.5) · D 26.8% · R 72.3%
- 2008→2024 swing
- +7.2pp toward D · 2008: -52.7pp · 2024: -45.5pp
- All cycles
- 2024: R+45.5 2020: R+43.8 2016: R+51.4 2012: R+60.7 2008: R+52.7
Not yet ingested
- Civics
- —
Market trends
- HPI YoY
- ▼ -111.46%
- Current HPI
- 225.9903
- Rent YoY
- ▲ 1.65%
- Metro
- Houston-The Woodlands-Sugar Land, TX
- State GDP YoY
- ▲ 3.95%
- F500 in state
- 110
Industry mix (Fortune 500 HQ in TX)
| Industry | F500 HQs | Revenue |
|---|---|---|
| Energy | 16 | $1,198B |
|
||
| Technology | 5 | $198B |
|
||
| Engineering / Construction | 4 | $72B |
|
||
| Energy Services | 3 | $60B |
|
||
| Utilities | 3 | $41B |
|
||
| Healthcare | 2 | $330B |
|
||
Price history
+40.1% since first listed4 events — show timeline
- 2026-06-02 Listed $209,999 HARMLS
- 2021-02-10 Listing Removed — HARMLS
- 2020-10-13 Listed $149,900 HARMLS
- 2015-10-30 Sold (Public Records) — Public Records
Property tax history
+4.7%/yrLatest (2025): $680 · -8.0% YoY. Source: county tax records.
Cash-flow waterfall
monthlySold comps — $/sqft
last 12 mo · ≤1 miLoading sold comps…