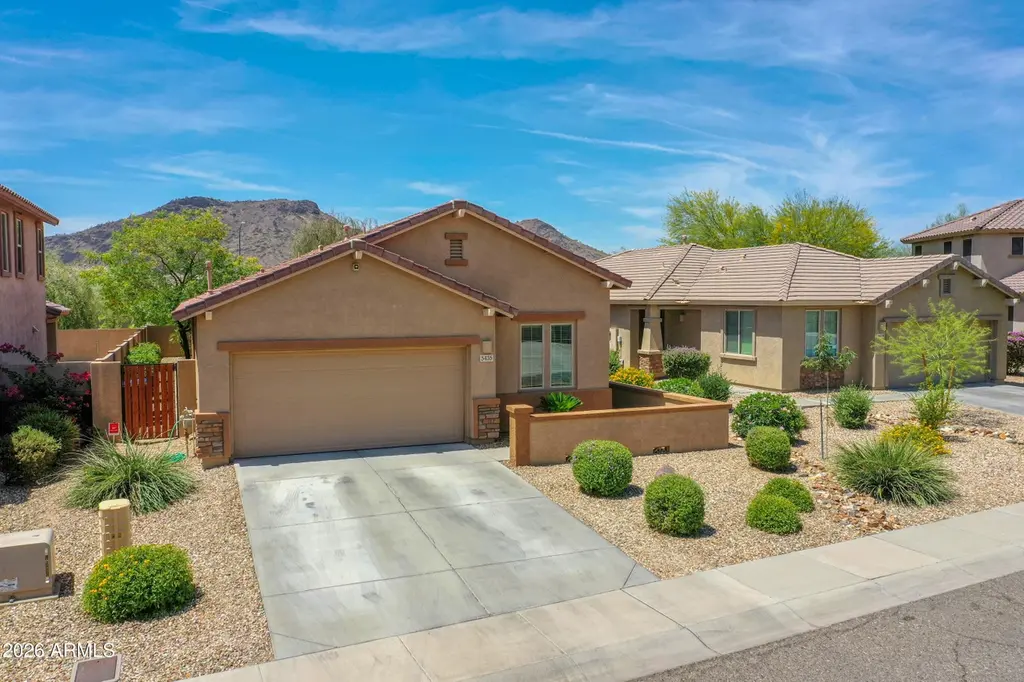
5435 W Fetlock Trl · Phoenix, AZ
Flood risk 1/10 · Minimal
- FEMA flood zone
- X (shaded)
- Chance of flooding over 30 yrs
- 0.0%
- Est. flood insurance / yr
- $507 – $1,088
Fire risk 5/10 · Moderate
- Est. fire insurance / yr
- $610 – $1,132
Heat risk 8/10 · Major
- Hot days now (above 111°F)
- 6 days/yr
- Hot days in 30 yrs
- 15 days/yr
Wind risk 1/10 · Minimal
- Chance of severe wind over 30 yrs
- —
Air-quality risk 2/10 · Minimal
- Unhealthy air days now
- 2 days/yr
- Unhealthy air days in 30 yrs
- 2 days/yr
Risk factors via First Street. Map © Google.
Why this score? — see what drove the D- grade
The composite is a weighted blend of 9 inputs, each scored 0–100. Each bar is that input's sub-score; the figure is the points it added to the 100-point composite (weight × sub-score).
- Appreciation +10.0/10.0
- ARV discount +6.7/15.0
- Cash flow +6.2/30.0
- Schools +4.7/10.0
- Livability +3.8/5.0
- Rent growth +3.1/5.0
- Condition / age +2.5/5.0
- 1% rule +0.6/10.0
- DSCR +0.5/10.0
$535,000
🖨 Deal sheet (PDF) 📄 Offer letter ✓ Due diligence
Listing remarks
Located in the highly sought-after Stetson Valley community, 5435 W Fetlock Trail delivers the combination buyers rarely find in this price range - single-story living, true 4BR functionality, exceptional mountain views from every angle, and a pristine turnkey interior. Enjoy stunning views of Pyramid Peak & Deem Hills from the front and wide-open Ludden Mountain views from the backyard w/ no neighbors behind for outstanding privacy and an incredible backdrop. Inside, the open split-bedroom floor plan offers ideal functionality with the spacious primary suite separated from 3 secondary bedrooms, including a convenient Jack-and-Jill bath accessible from both the hall & one of the
Key facts
- 6,226 sq ft lot
- 2 garage spots
- Built 2011
Property features AI
Finance
- HOA & community: Homeowners association with a $325 quarterly fee that includes grounds maintenance; Community playground; Biking/walking path
Exterior
- Parking: 2 covered parking spaces; 2 open parking spaces; 2-car garage with direct access, garage door opener and attached garage cabinets
- Utilities: City water; Public sewer (connected)
- Home design: Fee simple single-family residence
- Construction: Stucco and painted wood frame construction; Tile and concrete roof
- Exterior features: Front and rear sprinklers with automatic timers; Desert front landscaping; Synthetic grass in back; Gazebo; Block fencing
Interior
- Kitchen: Built-in microwave; Refrigerator; Dishwasher; Garbage disposal; Walk-in pantry
- Bedrooms: Up to 4 bedrooms
- Flooring: Carpet; Tile
- Bathrooms: 2 full bathrooms
- Heating & cooling: Electric heating; Central air conditioning; Ceiling fans; Programmable thermostat
- Interior features: High-speed internet available; Granite counters; Double vanity in bath; Eat-in kitchen; 9+ foot flat ceilings; No interior steps (single level interior); Separate shower and tub; Dual-pane windows
- Laundry & utility: Indoor laundry with washer/dryer hookups
Neighborhood map
What this means for you Summary
Snapshot
- This is a 4-bed/3.0-bath single-family listed at $535k.
Deal economics
- At list price, monthly cash flow is $-980 ($-12k/yr) — negative.
- To cash-flow at today's rent, offer at most $362k (32.3% below list).
- To meet the 1% rule (rent ≥ 1% of price), the offer needs to be $302k (43.6% below list).
- Recommended offer: $302k (43.6% below list) — sets the bar for 1% rule.
- Cap rate 4.1% vs local median 3.3% in Phoenix — meaningfully above typical; check what's discounted (condition, days-on-market, listing class) to confirm the premium yield is real.
Location & tenants
- Location reads 75/100 on livability (#16 in AZ, #3,924 nationally) — a middle-class / working-renter tenant base. Strengths: amenities A+, commute A+, housing A+; Watch: health & safety C-, crime F.
- Deer Valley Unified District (4246) (urban): math 50% / reading 55% proficiency, ranked #33 of 249 in AZ (top 13%) — acceptable for families but not a draw, mixed tenant base, ~2y average lease.
- Zoned schools: Sonoran Foothills School (math 69% / reading 72%, grade A-, #55 of 1,109 statewide, top 5%, 860 students, 15% FRL); Hillcrest Middle School (math 49% / reading 60%, grade B-, #15 of 218 statewide, top 7%, 899 students, 14% FRL); Sandra Day O'Connor High School (math 43% / reading 48%, grade D-, #58 of 381 statewide, top 15%, 2,567 students, 13% FRL).
- Market conditions: Rents rising (+2.3%/yr); 123 active listings in the ZIP; 23 comparable units currently listed for rent nearby; rentals at typical pace (median 17d on market — plan ~3-4 weeks tenant-placement turnaround); high-income renter base; 36,011 units permitted in Maricopa County in 2024 (12,801 in 5+ unit buildings).
Forward outlook
- In year one you build about $57k of equity ($4k loan paydown + $54k appreciation (10.0% local appreciation)).
- Maricopa County population projected at +38% by 2050 — long-run rental-demand tailwind backs the buy-and-hold thesis.
- By year 2, paydown + projected appreciation supports a ~$92k cash-out refi (75% LTV) — recoverable capital for the next deal without selling this one.
Negotiation context
- It's been on market 17 days — a 2% lower offer ($527k) is reasonable based on typical stale-listing flexibility.
Risks & watch-outs
- Climate carrying-cost: moderate wildfire risk; extreme-heat days projected 6→15/yr by 2055 (HVAC capex compounding) — expect insurance premiums to compound above CPI over the hold.
Questions for the listing agent
- What do current leases actually rent for vs. the listed asking? Can we see a recent rent roll and the last 12 months of T-12 income?
- What does the HOA fee cover, when was the last increase, and are there any pending special assessments or reserve-fund shortfalls?
- Is there a deadline driving the sale (1031 exchange, divorce, estate, relocation)? That informs how much negotiation room exists.
- Crime grade is F in this area — have there been break-ins, vandalism, or insurance claims at this property in the last 3 years? What carrier currently insures it and at what premium?
- The area grade is low — what's the realistic commute time and amenity access for the typical tenant pool here? Any planned neighborhood developments (good or bad) we should know about?
- What's the average days-on-market for RENTAL listings here right now (not sales)? A rising rental-DOM trend means longer vacancies and softer asking-rent achievability than the comps imply.
- What's the recent tenant-quality profile in this submarket — average credit score on applications, eviction rate, late-payment / NSF rate, and stable-employment percentage? A property-management company in the area should have these aggregated.
- How much new for-sale + rental construction is in the pipeline within 1–3 miles? Heavy new supply typically softens prices + rents 12–24 months out; constrained supply supports both.
Investment metrics
- 1% rule
- 0.56% ✗
- Cap rate
- 4.10%
- Cash-on-cash
- -7.85%
- DSCR
- 0.65
- GRM
- 14.8
CMA / ARV
- ARV (on-the-fly)
- $525,255
- Comps found
- 12
Show comp detail 12 sales within ~0.75 mi
| Address | Dist | Beds/Ba | Sqft | Sold | Price | $/sf | Match |
|---|---|---|---|---|---|---|---|
| 5435 W Fetlock Trl | 0.00mi | 4/2.0 | 1,805 (0%) | 0mo | $525,000 | $291 | 96 |
| 5511 W Desperado Way | 0.09mi | 4/2.0 | 1,794 (-1%) | 1mo | $510,000 | $284 | 90 |
| 5435 W Quail Track Dr | 0.13mi | 3/2.0 (-1) | 1,794 (-1%) | 6mo | $655,000 | $365 | 79 |
| 26704 N 55th Ave | 0.42mi | 3/2.0 (-1) | 1,813 (+0%) | 3mo | $565,000 | $312 | 68 |
| 5512 W Cavedale Dr | 0.36mi | 3/2.0 (-1) | 1,813 (+0%) | 12mo | $495,000 | $273 | 64 |
| 5253 W Maya Way | 0.35mi | 3/2.0 (-1) | 1,916 (+6%) | 1mo | $645,000 | $337 | 63 |
| 26937 N 52nd Gln | 0.34mi | 3/2.0 (-1) | 1,683 (-7%) | 2mo | $550,000 | $327 | 62 |
| 5455 W Bajada Rd | 0.18mi | 3/2.0 (-1) | 1,574 (-13%) | 1mo | $534,000 | $339 | 60 |
| 5126 W Bajada Rd | 0.37mi | 3/2.0 (-1) | 1,978 (+10%) | 3mo | $555,000 | $281 | 55 |
| 5339 W Chisum Trl | 0.75mi | 3/2.5 (-1) | 1,883 (+4%) | 6mo | $365,000 | $194 | 46 |
| 5130 W Molly Ln | 0.43mi | 3/2.0 (-1) | 1,998 (+11%) | 11mo | $570,000 | $285 | 44 |
| 26408 N 53rd Gln | 0.56mi | 3/2.5 (-1) | 1,661 (-8%) | 11mo | $407,000 | $245 | 44 |
Match score weights: distance 35% · size 25% · config 20% · recency 20%. Top-matched comps best support the ARV.
Projected returns pro-forma
10.0% appreciation · 2.29% rent growth · sell at horizon
- IRR
- 18.6%
- Equity multiple
- 2.51×
- Total profit
- $226,679
- Equity at exit
- $481,970
- IRR
- 17.1%
- Equity multiple
- 5.75×
- Total profit
- $712,064
- Equity at exit
- $1,039,387
Cash invested: $149,800 (down + closing). Projections, not guarantees.
Landlord ↔ Tenant lean methodology
- Overall (STATE)
- 87 Strongly Landlord-Friendly
- State Arizona
- 87 Strongly Landlord-Friendly · R+3
- County
- — inherits STATE
- City
- — inherits STATE
ZIP-level market 85083
- Home prices YoY
- 5.4%
- Rents YoY
- 2.3%
- Active inventory
- 123
- Price-to-rent
- 14.8×
Monthly cashflow live
- Estimated rent
- $3,017 high interval (Pro) →
- Mortgage (P&I)
- −$2,806
- Tax from tax record
- −$227 /mo · $2,719/yr
- Insurance
- −$223
- HOA
- −$108
- Vacancy / Maint / Mgmt
- −$634
- Net cashflow
- $-980
Break-even live
Sensitivity live
| Price | -10% $-677 | -5% $-828 | +0% $-980 | +5% $-1,131 | +10% $-1,283 |
|---|---|---|---|---|---|
| Rent | -10% $-1,218 | -5% $-1,099 | +0% $-980 | +5% $-860 | +10% $-741 |
| Rate | -1.0pp $-710 | -0.5pp $-844 | base $-980 | +0.5pp $-1,118 | +1.0pp $-1,259 |
UW: 25.0% down · 7.5% · 30yr · 1.5% tax · 5.0% vac · 8.0% maint · 8.0% mgmt
Financing live
Cash to close
- Down payment
- $133,750
- Closing costs
- $16,050
- Reserves months
- —
- Total cash needed
- —
Loan-product check · same deal, 3 products live
Conventional
25% down · 7.5% · 30yr
- Down + closing
- —
- Monthly P&I
- —
- Monthly cashflow
- —
- DSCR
- —
- Eligible?
- —
Personal DTI + credit; lowest rate.
DSCR
20% down · 8.5% · 30yr
- Down + closing
- —
- Monthly P&I
- —
- Monthly cashflow
- —
- DSCR
- —
- Eligible?
- —
No personal income docs; deal must DSCR.
Hard money
10% down · 12.0% · 12mo
- Down + closing
- —
- Monthly P&I
- —
- Monthly cashflow
- —
- DSCR
- —
- Eligible?
- —
Short-term bridge; refi at stabilization.
Rent comps 23 comps
| Address | Beds | Baths | Sqft | Rent | $/sqft | DOM | Units | Dist |
|---|---|---|---|---|---|---|---|---|
| 5511 W Desperado Way Phoenix, AZ | 4.0 | 2.0 | 1794 | $2,695 | $1.50 | 1d | 1 | 0.06mi |
| 5432 W Fetlock Trl Phoenix, AZ | 4.0 | 2.5 | 2103 | $2,900 | $1.38 | 14d | 1 | 0.06mi |
| 5412 W Fetlock Trl Phoenix, AZ | 4.0 | 2.0 | 1805 | $3,200 | $1.77 | 45d | 1 | 0.09mi |
| 27424 N 54th Ln Phoenix, AZ | 4.0 | 2.5 | 2104 | $2,885 | $1.37 | 3d | 1 | 0.10mi |
| 5414 W Straight Arrow Ln Phoenix, AZ | 4.0 | 2.0 | 1760 | $4,500 | $2.56 | 45d | 1 | 0.13mi |
| 5388 W Molly Ln Phoenix, AZ | 3.0 | 2.5 | 1871 | $2,099 | $1.12 | 9d | 1 | 0.34mi |
| 27015 N 52nd Gln Phoenix, AZ | 3.0 | 2.0 | 2314 | $2,795 | $1.21 | 20d | 1 | 0.35mi |
| 27105 N 52nd Ave Phoenix, AZ | 3.0 | 2.0 | 2314 | $2,499 | $1.08 | 18d | 1 | 0.37mi |
| 5340 W Molly Ln Phoenix, AZ | 3.0 | 2.5 | 1871 | $2,400 | $1.28 | 26d | 1 | 0.39mi |
| 5235 W Blaylock Dr Phoenix, AZ | 4.0 | 2.0 | 2128 | $2,850 | $1.34 | 26d | 1 | 0.41mi |
| 5118 W Molly Ln Phoenix, AZ | 3.0 | 2.0 | 2128 | $2,450 | $1.15 | 9d | 1 | 0.46mi |
| 26681 N Babbling Brook Dr Phoenix, AZ | 3.0 | 2.5 | 1871 | $2,160 | $1.15 | 9d | 1 | 0.47mi |
| 5310 W Chisum Trl Phoenix, AZ | 3.0 | 2.5 | 1719 | $2,195 | $1.28 | 1d | 1 | 0.71mi |
| 6017 W Running Deer Trl Phoenix, AZ | 5.0 | 3.0 | 2563 | $2,750 | $1.07 | 4d | 1 | 0.83mi |
| 27513 N 63rd Dr Phoenix, AZ | 3.0 | 2.5 | 1866 | $2,395 | $1.28 | 16d | 1 | 1.09mi |
| 6458 W Blue Sky Dr Phoenix, AZ | 4.0 | 3.0 | 2230 | $2,095 | $0.94 | 16d | 1 | 1.30mi |
| 6427 W Silver Sage Ln Phoenix, AZ | 4.0 | 2.5 | 2318 | $2,390 | $1.03 | 12d | 1 | 1.35mi |
| 6427 W Silver Sage Ln Phoenix, AZ | 4.0 | 2.5 | 2318 | $2,415 | $1.04 | 22d | 1 | 1.35mi |
| 6418 W Mark Ln Phoenix, AZ | 4.0 | 2.0 | 2201 | $3,250 | $1.48 | 45d | 1 | 1.45mi |
| 6326 W El Cortez Pl Phoenix, AZ | 4.0 | 2.5 | 2579 | $3,450 | $1.34 | 4d | 1 | 1.46mi |
| 6539 W Jomax Rd Phoenix, AZ | 3.0 | 3.0 | 2526 | $2,495 | $0.99 | 23d | 1 | 1.47mi |
| 6539 W Jomax Rd Phoenix, AZ | 3.0 | 3.0 | 2526 | $2,495 | $0.99 | 12d | 1 | 1.47mi |
| 6539 W Jomax Rd Phoenix, AZ | 3.0 | 3.0 | 2526 | $2,495 | $0.99 | 26d | 1 | 1.47mi |
HOA detail
- Monthly dues
- $108 · $1,296/yr
Listing history 10 events
-
2026-06-08status $535,000 Pending 17 DOM
-
2026-06-07days on market $535,000 Contract Contingent on Buyer Sale 17 DOM
-
2026-06-04days on market $535,000 Contract Contingent on Buyer Sale 14 DOM
-
2026-06-03days on market $535,000 Contract Contingent on Buyer Sale 13 DOM
-
2026-06-02days on market $535,000 Contract Contingent on Buyer Sale 12 DOM
-
2026-06-02status $535,000 Contract Contingent on Buyer Sale 11 DOM
-
2026-06-01days on market $535,000 Active 11 DOM
-
2026-05-31days on market $535,000 Active 10 DOM
-
2026-05-21$535,000 Active
-
2007-12-21soldstatus $21,739,323
ⓘ Source: listings_history table (triggers on properties + properties_extension) + one-shot
backfill from property_details.listing_events for pre-trigger history.
Tax reassessment forecast AZ · Resets to sale price
- Current annual tax
- $2,719 · $227/mo
- Projected year-2 tax
- $3,531 · $294/mo
- Expected delta
- +$812/yr (+$68/mo · 29.8%)
ⓘ Screening estimate from a state-policy table — verify with the county assessor before closing.
Climate risk First Street
- Flood 1/10 Low FEMA zone X (shaded) · 0% chance over 30 yrs
- Wildfire 5/10 Major
- Heat 8/10 Severe 6 d/yr ≥111°F today · 15 d/yr by 30 yrs out
- Wind 1/10 Low
- Air quality 2/10 Low 2 unhealthy d/yr today · 2 by 30 yrs out
Nearby sold comps map
Loading sold comps map…
Walkable amenities ~0.75 mi
Loading nearby amenities…
Taxation est. · year 1
- Rental income
- $36,204
- − Mortgage interest
- −$29,968
- − Property taxes
- −$2,719
- − Insurance
- −$2,675
- − Repairs & maintenance
- −$2,896
- − Management
- −$2,896
- − HOA
- −$1,296
- − Depreciation
- −$15,564
- Taxable loss
- −$21,811
- Est. tax savings @ 24.0%
- +$5,235
- After-tax cash flow
- $-6,522/yr
For passive investors: Depreciation is non-cash, so a rental often shows a tax loss while cash-flowing — sheltering income. Rental losses are passive: they offset passive income freely, and up to $25,000/yr can offset ordinary (W-2) income if you actively participate and your MAGI is under $100k (phasing out to $0 by $150k); unused losses carry forward. On sale, claimed depreciation is recaptured at up to 25%, and gains may owe capital-gains tax (a 1031 exchange can defer both). Figures are a year-1 estimate at your 24.0% rate — not tax advice; consult a CPA.
Schools (NCES district)
- District
- Deer Valley Unified District (4246)
- NCES district ID
- 0407750
- Math proficiency
- 50% ▼ -9.00%
- Reading proficiency
- 55% ▼ -6.00%
- Median HH income
- $72,516
- Composite
- 47.0/100
- National rank
- #2346
- State rank
- #33 of 249 in AZ
Livability — Phoenix
- Score
- 75/100
- State rank
- #16
- US rank
- #3924
Category grades
Schools grade is shown separately in the Schools card above.
Census & demographics
- Census place
- Phoenix, AZ
- County
- Maricopa County · 4,537,380 people
- City population
- 1,500,198
- Metro
- Phoenix-Mesa-Chandler, AZ
- Population (ZIP)
- 21,022
- Household income
- $149,087
- Rent vs Own
- Severe rent burden
- 81.0
Population outlook (Maricopa County) Hauer SSP2
- Today (2025)
- 4,979,203 people
- By 2030
- 5,378,229 · +8.0%
- By 2040
- 6,156,598 · +23.6%
- By 2050
- 6,872,376 · +38.0%
- By 2075
- 8,401,270 · +68.7%
- By 2100
- 9,247,439 · +85.7%
Race, ethnicity, and origin ACS 2023
- Neighborhood character
- Predominantly White (74%)
- Race & ethnicity
- White 74% Asian 10% Hispanic / Latino 10% Two or more races 6% Black 2%
- Hispanic origin (detail)
- Mexican 8%
- Common ancestry
- Portuguese 3% Lithuanian 2% Scandinavian 2%
- Foreign-born
- 14% · Canada, China, Vietnam
- Languages at home
- 83% English-only · Other Indo-European 7% Other Asian/Pacific 3% Spanish 3%
Political lean MEDSL · Maricopa
- 2024 margin
- Toss-up / Even · D 47.7% · R 51.2% · Other 1.1%
- 2008→2024 swing
- +7.1pp toward D · 2008: -10.6pp · 2024: -3.5pp
- All cycles
- 2024: R+3.5 2020: D+2.2 2016: R+3.5 2012: R+12.0 2008: R+10.6
Not yet ingested
- Civics
- —
Market trends
- HPI YoY
- ▲ 14.78%
- Current HPI
- 289.2128
- Rent YoY
- ▲ 2.29%
- Metro
- Phoenix-Mesa-Chandler, AZ
- State GDP YoY
- ▲ 4.54%
- F500 in state
- 20
Industry mix (Fortune 500 HQ in AZ)
| Industry | F500 HQs | Revenue |
|---|---|---|
| Technology | 2 | $13B |
|
||
| Mining / Metals | 1 | $23B |
|
||
| Environmental Services | 1 | $16B |
|
||
| Metals / Steel | 1 | $14B |
|
||
| Technology Distribution | 1 | $9B |
|
||
| Homebuilding | 1 | $8B |
|
||
Price history
-97.6% since first listed6 events — show timeline
- 2026-06-11 Sold (Public Records) $525,000 Public Records
- 2026-06-11 Sold (MLS) $525,000 ARMLS
- 2026-06-08 Pending — ARMLS
- 2026-06-01 Contingent — ARMLS
- 2026-05-21 Listed $535,000 ARMLS
- 2007-12-21 Sold (Public Records) $21,739,323 Public Records
Property tax history
+7.4%/yrLatest (2025): $2,719 · +1.0% YoY. Source: county tax records.
Cash-flow waterfall
monthlySold comps — $/sqft
last 12 mo · ≤1 miLoading sold comps…