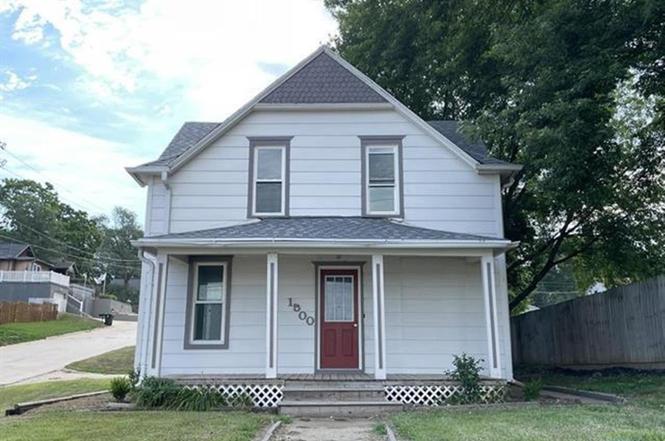
1500 Linn St · Sioux City, IA
Flood risk 1/10 · Minimal
- FEMA flood zone
- X (unshaded)
- Chance of flooding over 30 yrs
- 0.0%
- Est. flood insurance / yr
- $473 – $860
Fire risk 3/10 · Minor
- Est. fire insurance / yr
- $902 – $1,676
Heat risk 3/10 · Minor
- Hot days now (above 102°F)
- 7 days/yr
- Hot days in 30 yrs
- 15 days/yr
Wind risk 2/10 · Minimal
- Chance of severe wind over 30 yrs
- —
Air-quality risk 1/10 · Minimal
- Unhealthy air days now
- 0 days/yr
- Unhealthy air days in 30 yrs
- 0 days/yr
Risk factors via First Street. Map © Google.
Why this score? — see what drove the D- grade
The composite is a weighted blend of 9 inputs, each scored 0–100. Each bar is that input's sub-score; the figure is the points it added to the 100-point composite (weight × sub-score).
- ARV discount +10.9/15.0
- Cash flow +7.2/30.0
- Schools +4.7/10.0
- Livability +3.9/5.0
- Rent growth +2.5/5.0
- Condition / age +2.5/5.0
- 1% rule +2.1/10.0
- DSCR +1.4/10.0
- Appreciation +0.0/10.0
$174,900
🖨 Deal sheet (PDF) 📄 Offer letter ✓ Due diligence
Listing remarks MLS
Nice Morningside 3 Bedroom 1 Bath 2 Stall detached garage. Good roof, newer windows. HUD HOMES are Sold AS IS. SUBMIT OFFERS AT HUDHOMESTORE. COM CASE# 161-374349. Offers will be accepted for ONLY OWNER OCCUPANTS, NON PROPITS & GOVERNMENT AGENCYS until 9/06/2023.
Key facts
- Newer roof
- Finished basement
- 5,200 sq ft lot
Tags
Neighborhood map
What this means for you Summary
Snapshot
- This is a 3-bed/1.0-bath single-family listed at $175k.
Deal economics
- At list price, monthly cash flow is $-238 ($-3k/yr) — negative.
- To cash-flow at today's rent, offer at most $133k (24.1% below list).
- To meet the 1% rule (rent ≥ 1% of price), the offer needs to be $124k (29.0% below list).
- Recommended offer: $124k (29.0% below list) — sets the bar for 1% rule.
- Cap rate 4.7% vs local median 3.7% in Sioux City — meaningfully above typical; check what's discounted (condition, days-on-market, listing class) to confirm the premium yield is real.
Location & tenants
- Location reads 78/100 on livability (#138 in IA, #2,544 nationally) — a middle-class / working-renter tenant base. Strengths: cost of living A+, housing A+, health & safety A+; Watch: crime F, commute F.
- Sioux City Community School District (urban): math 54% / reading 57% proficiency, ranked #264 of 289 in IA (top 91%) — acceptable for families but not a draw, mixed tenant base, ~2y average lease.
- Zoned schools: Spalding Park Elementary (math 59% / reading 55%, grade C+, #436 of 616 statewide, top 74%, 652 students, 69% FRL); East Middle School (math 60% / reading 67%, grade B+, #169 of 246 statewide, top 69%, 1,067 students, 65% FRL); East High School (math 53% / reading 63%, grade C, #275 of 336 statewide, top 83%, 1,495 students, 54% FRL).
- Market conditions: 204 active listings in the ZIP; 5 comparable units currently listed for rent nearby; rentals lingering (median 45d on market — plan ~5-8 weeks vacancy on turnover, expect pricing pressure); 100% of comp listings sitting > 30 days — soft ceiling on asking rent; solid renter incomes; 170 units permitted in Woodbury County in 2024 (90 in 5+ unit buildings).
Forward outlook
- Local home prices are declining (-3.0%/yr); year-one equity from $1k of loan paydown is wiped out by about $5k of value loss. Plan a longer hold.
Negotiation context
- Only 1 days on market — expect competitive offers; lowballing is unlikely to land.
- 3 sale attempts since 3y ago with the ask held roughly flat each time — persistent listings suggest the price (not the market) is what's stuck; bring a comps-based counter.
Risks & watch-outs
- Watch-outs: built in 1920 — expect roof / HVAC / electrical / plumbing capex.
Questions for the listing agent
- What do current leases actually rent for vs. the listed asking? Can we see a recent rent roll and the last 12 months of T-12 income?
- Built in 1920 — when were the roof, HVAC, electrical panel, plumbing, and water heater last replaced?
- Is there a deadline driving the sale (1031 exchange, divorce, estate, relocation)? That informs how much negotiation room exists.
- Crime grade is F in this area — have there been break-ins, vandalism, or insurance claims at this property in the last 3 years? What carrier currently insures it and at what premium?
- The area grade is low — what's the realistic commute time and amenity access for the typical tenant pool here? Any planned neighborhood developments (good or bad) we should know about?
- What's the average days-on-market for RENTAL listings here right now (not sales)? A rising rental-DOM trend means longer vacancies and softer asking-rent achievability than the comps imply.
- What's the recent tenant-quality profile in this submarket — average credit score on applications, eviction rate, late-payment / NSF rate, and stable-employment percentage? A property-management company in the area should have these aggregated.
- How much new for-sale + rental construction is in the pipeline within 1–3 miles? Heavy new supply typically softens prices + rents 12–24 months out; constrained supply supports both.
Investment metrics
- 1% rule
- 0.71% ✗
- Cap rate
- 4.66%
- Cash-on-cash
- -5.84%
- DSCR
- 0.74
- GRM
- 11.7
CMA / ARV
- ARV (on-the-fly)
- $189,256
- Comps found
- 12
Show comp detail 12 sales within ~0.75 mi
| Address | Dist | Beds/Ba | Sqft | Sold | Price | $/sf | Match |
|---|---|---|---|---|---|---|---|
| 2526 Macomb Ave | 0.33mi | 3/2.0 | 1,155 (+0%) | 1mo | $246,000 | $213 | 80 |
| 721 S Linn St | 0.56mi | 3/2.0 | 1,142 (-1%) | 3mo | $178,000 | $156 | 66 |
| 3308 Garretson Ave | 0.56mi | 3/1.0 | 1,200 (+4%) | 7mo | $135,000 | $113 | 62 |
| 3215 5th Ave | 0.67mi | 2/1.0 (-1) | 1,140 (-1%) | 1mo | $208,000 | $182 | 61 |
| 3415 4th Ave | 0.72mi | 3/1.0 | 1,192 (+3%) | 1mo | $150,000 | $126 | 60 |
| 1127 S Cecelia St | 0.47mi | 3/1.5 | 1,246 (+8%) | 7mo | $206,000 | $165 | 57 |
| 1021 S Cecelia St | 0.53mi | 3/1.0 | 1,254 (+9%) | 6mo | $225,000 | $179 | 56 |
| 3230 5th Ave | 0.72mi | 3/1.5 | 1,192 (+3%) | 10mo | $195,000 | $164 | 51 |
| 2800 Dodge Ave | 0.60mi | 2/1.0 (-1) | 1,023 (-11%) | 4mo | $140,700 | $138 | 44 |
| 815 S Cornelia St | 0.74mi | 3/1.5 | 1,242 (+8%) | 9mo | $192,500 | $155 | 43 |
| 3116 4th Ave | 0.54mi | 3/2.0 | 1,297 (+12%) | 9mo | $215,000 | $166 | 43 |
| 3419 Garretson Ave | 0.64mi | 2/1.0 (-1) | 990 (-14%) | 6mo | $143,000 | $144 | 37 |
Match score weights: distance 35% · size 25% · config 20% · recency 20%. Top-matched comps best support the ARV.
Projected returns pro-forma
-3.0% appreciation · 3.0% rent growth · sell at horizon
- IRR
- -26.3%
- Equity multiple
- 0.11×
- Total profit
- $-43,487
- Equity at exit
- $26,078
- IRR
- -23.3%
- Equity multiple
- -0.17×
- Total profit
- $-57,301
- Equity at exit
- $15,122
Cash invested: $48,972 (down + closing). Projections, not guarantees.
Landlord ↔ Tenant lean methodology
- Overall (STATE)
- 83 Strongly Landlord-Friendly
- State Iowa
- 83 Strongly Landlord-Friendly · R+6
- County
- — inherits STATE
- City
- — inherits STATE
ZIP-level market 51106
- Active inventory
- 204
- Price-to-rent
- 11.7×
Monthly cashflow live
- Estimated rent
- $1,241 high interval (Pro) →
- Mortgage (P&I)
- −$917
- Tax from tax record
- −$229 /mo · $2,743/yr
- Insurance
- −$73
- HOA
- −$0
- Vacancy / Maint / Mgmt
- −$261
- Net cashflow
- $-238
Break-even live
Sensitivity live
| Price | -10% $-139 | -5% $-189 | +0% $-238 | +5% $-288 | +10% $-337 |
|---|---|---|---|---|---|
| Rent | -10% $-336 | -5% $-287 | +0% $-238 | +5% $-189 | +10% $-140 |
| Rate | -1.0pp $-150 | -0.5pp $-194 | base $-238 | +0.5pp $-284 | +1.0pp $-330 |
UW: 25.0% down · 7.5% · 30yr · 1.5% tax · 5.0% vac · 8.0% maint · 8.0% mgmt
Financing live
Cash to close
- Down payment
- $43,725
- Closing costs
- $5,247
- Reserves months
- —
- Total cash needed
- —
Loan-product check · same deal, 3 products live
Conventional
25% down · 7.5% · 30yr
- Down + closing
- —
- Monthly P&I
- —
- Monthly cashflow
- —
- DSCR
- —
- Eligible?
- —
Personal DTI + credit; lowest rate.
DSCR
20% down · 8.5% · 30yr
- Down + closing
- —
- Monthly P&I
- —
- Monthly cashflow
- —
- DSCR
- —
- Eligible?
- —
No personal income docs; deal must DSCR.
Hard money
10% down · 12.0% · 12mo
- Down + closing
- —
- Monthly P&I
- —
- Monthly cashflow
- —
- DSCR
- —
- Eligible?
- —
Short-term bridge; refi at stabilization.
Rent comps 5 comps
| Address | Beds | Baths | Sqft | Rent | $/sqft | DOM | Units | Dist |
|---|---|---|---|---|---|---|---|---|
| 1301 S Westcott St Apt 04 Sioux City, IA | 2.0 | 1.0 | 793 | $850 | $1.07 | 44d | 1 | 0.20mi |
| 700 S Linn St Sioux City, IA | 2.0 | 2.0 | 926 | $1,400 | $1.51 | 44d | 1 | 0.57mi |
| 2807 Lincoln Way Sioux City, IA | 2.0–3.0 | 1.0 | 1100 | $1,245 | $1.13 | 44d | 4 | 1.15mi |
| 860 River View Dr South Sioux City, NE | 1.0–2.0 | 1.0–2.0 | 867 | $1,252 | $1.44 | 44d | 1 | 1.33mi |
| 1819 S Lakeport St Apt 4 Sioux City, IA | 2.0 | 1.0 | 850 | $950 | $1.12 | 44d | 1 | 1.45mi |
Listing history 8 events
-
2026-03-18soldstatus $172,000
-
2026-02-07status Pending
-
2026-02-06$174,900 Active
-
2023-11-27soldstatus $132,000 Closed 269-char remark
Show marketing remark (269 chars)
Nice Morningside 3 Bedroom 1 Bath 2 Stall detached garage. Good roof, newer windows. HUD HOMES are Sold AS IS. SUBMIT OFFERS AT HUDHOMESTORE. COM CASE# 161-374349. Offers will be accepted for ONLY OWNER OCCUPANTS, NON PROPITS & GOVERNMENT AGENCYS until 9/06/2023.
-
2023-09-20status Active 269-char remark
Show marketing remark (269 chars)
Nice Morningside 3 Bedroom 1 Bath 2 Stall detached garage. Good roof, newer windows. HUD HOMES are Sold AS IS. SUBMIT OFFERS AT HUDHOMESTORE. COM CASE# 161-374349. Offers will be accepted for ONLY OWNER OCCUPANTS, NON PROPITS & GOVERNMENT AGENCYS until 9/06/2023.
-
2023-08-07$134,000 Active 269-char remark
Show marketing remark (269 chars)
Nice Morningside 3 Bedroom 1 Bath 2 Stall detached garage. Good roof, newer windows. HUD HOMES are Sold AS IS. SUBMIT OFFERS AT HUDHOMESTORE. COM CASE# 161-374349. Offers will be accepted for ONLY OWNER OCCUPANTS, NON PROPITS & GOVERNMENT AGENCYS until 9/06/2023.
-
2018-01-17soldstatus $130,000
-
2017-03-21soldstatus $65,000
ⓘ Source: listings_history table (triggers on properties + properties_extension) + one-shot
backfill from property_details.listing_events for pre-trigger history.
Tax reassessment forecast IA · Partial reset (capped growth)
- Current annual tax
- $2,743 · $229/mo
- Projected year-2 tax
- $2,744 · $229/mo
- Expected delta
- +$1/yr ($0/mo · 0.1%)
ⓘ Screening estimate from a state-policy table — verify with the county assessor before closing.
Climate risk First Street
- Flood 1/10 Low FEMA zone X (unshaded) · 0% chance over 30 yrs
- Wildfire 3/10 Moderate
- Heat 3/10 Moderate 7 d/yr ≥102°F today · 15 d/yr by 30 yrs out
- Wind 2/10 Low
- Air quality 1/10 Low 0 unhealthy d/yr today · 0 by 30 yrs out
Nearby sold comps map
Loading sold comps map…
Walkable amenities ~0.75 mi
Loading nearby amenities…
Taxation est. · year 1
- Rental income
- $14,893
- − Mortgage interest
- −$9,797
- − Property taxes
- −$2,743
- − Insurance
- −$874
- − Repairs & maintenance
- −$1,191
- − Management
- −$1,191
- − Depreciation
- −$5,088
- Taxable loss
- −$5,992
- Est. tax savings @ 24.0%
- +$1,438
- After-tax cash flow
- $-1,420/yr
For passive investors: Depreciation is non-cash, so a rental often shows a tax loss while cash-flowing — sheltering income. Rental losses are passive: they offset passive income freely, and up to $25,000/yr can offset ordinary (W-2) income if you actively participate and your MAGI is under $100k (phasing out to $0 by $150k); unused losses carry forward. On sale, claimed depreciation is recaptured at up to 25%, and gains may owe capital-gains tax (a 1031 exchange can defer both). Figures are a year-1 estimate at your 24.0% rate — not tax advice; consult a CPA.
Schools (NCES district)
- District
- Sioux City Community School District
- NCES district ID
- 1926400
- Math proficiency
- 54% ▼ -7.00%
- Reading proficiency
- 57% ▼ -2.00%
- Median HH income
- $44,967
- Composite
- 46.86/100
- National rank
- #2371
- State rank
- #264 of 289 in IA
Livability — Sioux City
- Score
- 78/100
- State rank
- #138
- US rank
- #2544
Category grades
Schools grade is shown separately in the Schools card above.
Census & demographics
- Census place
- Sioux City, IA
- County
- Woodbury County · 51,789 people
- City population
- 51,789
- Metro
- Sioux City, IA-NE-SD
- Population (ZIP)
- 28,592
- Household income
- $78,434
- Rent vs Own
- Severe rent burden
- 891.0
Population outlook (Woodbury County) Hauer SSP2
- Today (2025)
- 103,226 people
- By 2030
- 103,060 · -0.2%
- By 2040
- 102,533 · -0.7%
- By 2050
- 102,788 · -0.4%
- By 2075
- 107,227 · +3.9%
- By 2100
- 113,980 · +10.4%
Race, ethnicity, and origin ACS 2023
- Neighborhood character
- Predominantly White (78%)
- Race & ethnicity
- White 78% Hispanic / Latino 10% Two or more races 8% Black 6% Asian 1%
- Hispanic origin (detail)
- Mexican 8%
- Common ancestry
- Portuguese 5% Iranian 4% Italian 2%
- Foreign-born
- 5% · Canada
- Languages at home
- 89% English-only · Spanish 8% German/W. Germanic 1% French/Haitian/Cajun 1%
Political lean MEDSL · Woodbury
- 2024 margin
- Strong R (+23.0) · D 37.8% · R 60.9% · Other 1.3%
- 2008→2024 swing
- -22.5pp toward R · 2008: -0.5pp · 2024: -23.0pp
- All cycles
- 2024: R+23.0 2020: R+15.5 2016: R+19.9 2012: R+0.2 2008: R+0.5
Not yet ingested
- Civics
- —
Market trends
- HPI YoY
- ▼ -127.61%
- Current HPI
- 229.6733
- Rent YoY
- —
- Metro
- Sioux City, IA-NE-SD
- State GDP YoY
- ▲ 2.48%
- F500 in state
- 4
Industry mix (Fortune 500 HQ in IA)
| Industry | F500 HQs | Revenue |
|---|---|---|
| Financial Services | 1 | $16B |
|
||
| Retail / Convenience | 1 | $15B |
|
||
Price history
+164.6% since first listed8 events — show timeline
- 2026-03-18 Sold (Public Records) $172,000 Public Records
- 2026-02-07 Pending — NWIA
- 2026-02-06 Listed $174,900 NWIA
- 2023-11-27 Sold (MLS) $132,000 NWIA
- 2023-09-20 Relisted — NWIA
- 2023-08-07 Listed $134,000 NWIA
- 2018-01-17 Sold (Public Records) $130,000 Public Records
- 2017-03-21 Sold (Public Records) $65,000 Public Records
Property tax history
+4.7%/yrLatest (2025): $2,743 · -8.3% YoY. Source: county tax records.
Cash-flow waterfall
monthlySold comps — $/sqft
last 12 mo · ≤1 miLoading sold comps…