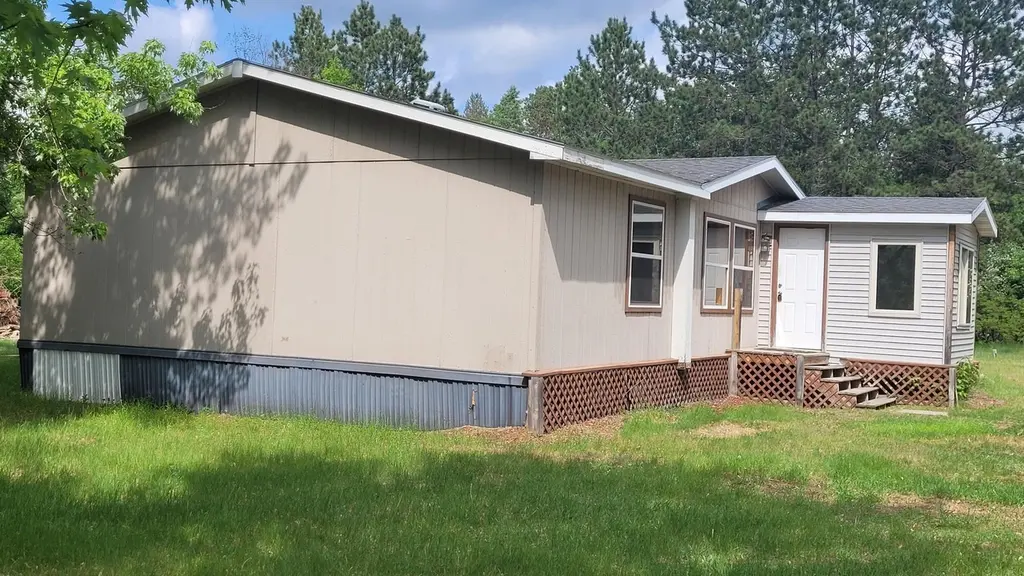
2277 State 84 · Barclay, MN
Flood risk 1/10 · Minimal
- FEMA flood zone
- —
- Chance of flooding over 30 yrs
- 0.0%
- Est. flood insurance / yr
- —
Fire risk 5/10 · Moderate
- Est. fire insurance / yr
- $888 – $1,650
Heat risk 1/10 · Minimal
- Hot days now (above 94°F)
- 7 days/yr
- Hot days in 30 yrs
- 13 days/yr
Wind risk 1/10 · Minimal
- Chance of severe wind over 30 yrs
- —
Air-quality risk 2/10 · Minimal
- Unhealthy air days now
- 2 days/yr
- Unhealthy air days in 30 yrs
- 2 days/yr
Risk factors via First Street. Map © Google.
Why this score? — see what drove the D- grade
The composite is a weighted blend of 9 inputs, each scored 0–100. Each bar is that input's sub-score; the figure is the points it added to the 100-point composite (weight × sub-score).
- Cash flow +13.6/30.0
- ARV discount +7.5/15.0
- DSCR +4.1/10.0
- Schools +3.0/10.0
- 1% rule +2.6/10.0
- Rent growth +2.5/5.0
- Livability +2.5/5.0
- Condition / age +2.5/5.0
- Appreciation +0.0/10.0
$135,000
🖨 Deal sheet 📄 Offer letter ✓ Due diligence
Listing remarks MLS
Three bedroom, two bathroom Pine river home on 1.24 acres. You will enjoy the large yard, nice size master bedroom, built-ins around the wood burning fireplace, and more! Schedule your showing today!
Key facts
- Outdoor recreation
- Private bath
- Spacious kitchen
Tags
Property features AI
Finance
- Other: Not fractional ownership
Exterior
- Parking: Gravel parking
- Utilities: Well water; Private sewer; Propane fuel
- Home design: Residential property; One-level home; Manufactured home
- Construction: Asphalt roof; Built on a foundation (foundation area ~1,872); Above-grade finished area approximately 1,872
- Exterior features: Vinyl exterior; Level topography; Lot roughly 1.24 acres (approximately 164 x 330)
Interior
- Kitchen: Kitchen with window
- Bedrooms: 3 bedrooms on one level
- Bathrooms: 2 full bathrooms
- Heating & cooling: Forced air heating; No central air
- Interior features: All living facilities on one level; Main floor laundry; Natural woodwork; Kitchen window; Wood-burning fireplace
- Laundry & utility: Main floor laundry
Neighborhood map
What this means for you Summary
Snapshot
- This is a 3-bed/2.0-bath single-family listed at $135k.
Deal economics
- At list price, monthly cash flow is $8 ($96/yr) — positive.
- The deal already cash-flows at list — no discount required.
- To meet the 1% rule (rent ≥ 1% of price), the offer needs to be $103k (24.0% below list).
- Recommended offer: $103k (24.0% below list) — sets the bar for 1% rule.
Location & tenants
- Location reads: area grade D — affects rentability + tenant quality, not the cash-flow math above.
- Pine River-Backus School District (rural): math 26% / reading 46% proficiency, ranked #250 of 301 in MN (top 83%) — families likely to look elsewhere, expect single-tenant / working-renter base with shorter leases.
- Market conditions: 61 active listings in the ZIP; 285 units permitted in Cass County in 2024 (0 in 5+ unit buildings).
Forward outlook
- Local home prices are declining (-3.0%/yr); year-one equity from $933 of loan paydown is wiped out by about $4k of value loss. Plan a longer hold.
- Cass County population projected at -20% by 2050 — secular population decline; favor cash flow + early exit over multi-decade hold.
Negotiation context
- Only 13 days on market — expect competitive offers; lowballing is unlikely to land.
- 6 sale attempts since 10y ago with the ask held roughly flat each time — persistent listings suggest the price (not the market) is what's stuck; bring a comps-based counter.
Risks & watch-outs
- Climate carrying-cost: moderate wildfire risk — expect insurance premiums to compound above CPI over the hold.
Questions for the listing agent
- Is there a deadline driving the sale (1031 exchange, divorce, estate, relocation)? That informs how much negotiation room exists.
- The area grade is low — what's the realistic commute time and amenity access for the typical tenant pool here? Any planned neighborhood developments (good or bad) we should know about?
- What's the average days-on-market for RENTAL listings here right now (not sales)? A rising rental-DOM trend means longer vacancies and softer asking-rent achievability than the comps imply.
- What's the recent tenant-quality profile in this submarket — average credit score on applications, eviction rate, late-payment / NSF rate, and stable-employment percentage? A property-management company in the area should have these aggregated.
- How much new for-sale + rental construction is in the pipeline within 1–3 miles? Heavy new supply typically softens prices + rents 12–24 months out; constrained supply supports both.
Investment metrics
- 1% rule
- 0.76% ✗
- Cap rate
- 6.36%
- Cash-on-cash
- 0.25%
- DSCR
- 1.01
- GRM
- 11.0
CMA / ARV
No comps found within radius.
Projected returns pro-forma
-3.0% appreciation · 3.0% rent growth · sell at horizon
- IRR
- -16.0%
- Equity multiple
- 0.43×
- Total profit
- $-21,433
- Equity at exit
- $20,129
- IRR
- -7.7%
- Equity multiple
- 0.52×
- Total profit
- $-18,273
- Equity at exit
- $11,672
Cash invested: $37,800 (down + closing). Projections, not guarantees.
Landlord ↔ Tenant lean methodology
- Overall (STATE)
- 46 Balanced
- State Minnesota
- 46 Balanced · D+2
- County
- — inherits STATE
- City
- — inherits STATE
ZIP-level market 56474
- Home prices YoY
- -7.4%
- Active inventory
- 61
- Price-to-rent
- 11.0×
Monthly cashflow live
- Estimated rent
- $1,026 medium interval (Pro) →
- Mortgage (P&I)
- −$708
- Tax from tax record
- −$38 /mo · $460/yr
- Insurance
- −$56
- HOA
- −$0
- Vacancy / Maint / Mgmt
- −$215
- Net cashflow
- $8
Break-even live
UW: 25.0% down · 7.5% · 30yr · 1.5% tax · 5.0% vac · 8.0% maint · 8.0% mgmt
Financing live
Cash to close
- Down payment
- $33,750
- Closing costs
- $4,050
- Reserves months
- —
- Total cash needed
- —
Loan-product check · same deal, 3 products live
Conventional
25% down · 7.5% · 30yr
- Down + closing
- —
- Monthly P&I
- —
- Monthly cashflow
- —
- DSCR
- —
- Eligible?
- —
Personal DTI + credit; lowest rate.
DSCR
20% down · 8.5% · 30yr
- Down + closing
- —
- Monthly P&I
- —
- Monthly cashflow
- —
- DSCR
- —
- Eligible?
- —
No personal income docs; deal must DSCR.
Hard money
10% down · 12.0% · 12mo
- Down + closing
- —
- Monthly P&I
- —
- Monthly cashflow
- —
- DSCR
- —
- Eligible?
- —
Short-term bridge; refi at stabilization.
Listing history 11 events
-
2026-06-18days on market $135,000 Active 13 DOM
-
2026-06-17days on market $135,000 Active 12 DOM
-
2026-06-16days on market $135,000 Active 11 DOM
-
2026-06-15days on market $135,000 Active 10 DOM
-
2026-06-13days on market $135,000 Active 8 DOM
-
2026-06-12days on market $135,000 Active 7 DOM
-
2026-06-09days on market $135,000 Active 4 DOM
-
2026-06-08days on market $135,000 Active 3 DOM
-
2026-06-07days on market $135,000 Active 2 DOM
-
2026-06-07remarks 699-char remark
-
2026-06-07$135,000 Active 1 DOM
ⓘ Source: listings_history table (triggers on properties + properties_extension) + one-shot
backfill from property_details.listing_events for pre-trigger history.
Tax reassessment forecast MN · Partial reset (capped growth)
- Current annual tax
- $460 · $38/mo
- Projected year-2 tax
- $986 · $82/mo
- Expected delta
- +$526/yr (+$44/mo · 114.3%)
ⓘ Screening estimate from a state-policy table — verify with the county assessor before closing.
Climate risk First Street
- Flood 1/10 Low 0% chance over 30 yrs
- Wildfire 5/10 Major
- Heat 1/10 Low 7 d/yr ≥94°F today · 13 d/yr by 30 yrs out
- Wind 1/10 Low
- Air quality 2/10 Low 2 unhealthy d/yr today · 2 by 30 yrs out
Nearby sold comps map
Loading sold comps map…
Walkable amenities ~0.75 mi
Loading nearby amenities…
Taxation est. · year 1
- Rental income
- $12,311
- − Mortgage interest
- −$7,562
- − Property taxes
- −$460
- − Insurance
- −$675
- − Repairs & maintenance
- −$985
- − Management
- −$985
- − Depreciation
- −$3,927
- Taxable loss
- −$2,283
- Est. tax savings @ 24.0%
- +$548
- After-tax cash flow
- $643/yr
For passive investors: Depreciation is non-cash, so a rental often shows a tax loss while cash-flowing — sheltering income. Rental losses are passive: they offset passive income freely, and up to $25,000/yr can offset ordinary (W-2) income if you actively participate and your MAGI is under $100k (phasing out to $0 by $150k); unused losses carry forward. On sale, claimed depreciation is recaptured at up to 25%, and gains may owe capital-gains tax (a 1031 exchange can defer both). Figures are a year-1 estimate at your 24.0% rate — not tax advice; consult a CPA.
Schools (NCES district)
- District
- Pine River-Backus School District
- NCES district ID
- 2728970
- Math proficiency
- 26% ▼ -21.00%
- Reading proficiency
- 46% ▼ -9.00%
- Median HH income
- $42,909
- Composite
- 30.42/100
- National rank
- #6239
- State rank
- #250 of 301 in MN
Livability — Barclay
No livability data for this city. (Only ~50 U.S. cities are tracked.)
Census & demographics
- Population (ZIP)
- 4,471
Population outlook (Cass County) Hauer SSP2
- Today (2025)
- 27,371 people
- By 2030
- 26,311 · -3.9%
- By 2040
- 23,945 · -12.5%
- By 2050
- 21,889 · -20.0%
- By 2075
- 18,435 · -32.6%
- By 2100
- 14,478 · -47.1%
Race, ethnicity, and origin ACS 2023
- Neighborhood character
- Predominantly White (89%)
- Race & ethnicity
- White 89% Two or more races 7% Hispanic / Latino 2% Asian 1% Native American 1%
- Common ancestry
- Portuguese 13% Romanian 4% Lithuanian 3%
- Foreign-born
- 2% · Canada
- Languages at home
- 97% English-only · Spanish 1% Tagalog/Filipino 1%
Political lean MEDSL · Cass
- 2024 margin
- Solid R (+33.4) · D 32.6% · R 66.0% · Other 1.3%
- 2008→2024 swing
- -24.9pp toward R · 2008: -8.5pp · 2024: -33.4pp
- All cycles
- 2024: R+33.4 2020: R+28.9 2016: R+31.7 2012: R+13.1 2008: R+8.5
Not yet ingested
- Civics
- —
Market trends
- HPI YoY
- ▼ -19.61%
- Current HPI
- 244.0289
- Rent YoY
- —
- Metro
- —
- State GDP YoY
- ▲ 2.41%
- F500 in state
- 34
Industry mix (Fortune 500 HQ in MN)
| Industry | F500 HQs | Revenue |
|---|---|---|
| Healthcare | 2 | $407B |
|
||
| Retail | 2 | $150B |
|
||
| Consumer Goods | 2 | $32B |
|
||
| Industrial Machinery | 2 | $6B |
|
||
| Agriculture | 1 | $40B |
|
||
| Healthcare / Medical Devices | 1 | $32B |
|
||
Price history
+53.6% since first listed21 events — show timeline
- 2026-06-04 Listed $135,000 NORTHSTARMLS as Distributed by MLS Grid
- 2022-11-15 Sold (Public Records) $152,500 Public Records
- 2022-11-11 Sold (MLS) $152,500 NORTHSTARMLS as Distributed by MLS Grid
- 2022-10-17 Pending — NORTHSTARMLS as Distributed by MLS Grid
- 2022-09-26 Price Changed $154,900 NORTHSTARMLS as Distributed by MLS Grid
- 2022-09-13 Relisted — NORTHSTARMLS as Distributed by MLS Grid
- 2022-09-13 Price Changed $159,900 NORTHSTARMLS as Distributed by MLS Grid
- 2022-08-18 Pending — NORTHSTARMLS as Distributed by MLS Grid
- 2022-08-11 Listed $164,900 NORTHSTARMLS as Distributed by MLS Grid
- 2022-08-10 Coming Soon $164,900 NORTHSTARMLS as Distributed by MLS Grid
- 2019-01-11 Sold (Public Records) $84,000 Public Records
- 2018-12-14 Sold (MLS) $84,000 NORTHSTARMLS as Distributed by MLS Grid
- 2018-11-27 Listing Removed — NORTHSTARMLS as Distributed by MLS Grid
- 2018-11-05 Pending — NORTHSTARMLS as Distributed by MLS Grid
- 2018-09-28 Price Changed $80,900 NORTHSTARMLS as Distributed by MLS Grid
- 2018-08-07 Price Changed $84,900 NORTHSTARMLS as Distributed by MLS Grid
- 2018-05-26 Listed $80,900 NORTHSTARMLS as Distributed by MLS Grid
- 2018-05-26 Listed $89,900 NORTHSTARMLS as Distributed by MLS Grid
- 2017-08-01 Listing Removed — NORTHSTARMLS as Distributed by MLS Grid
- 2017-05-12 Price Changed $79,900 NORTHSTARMLS as Distributed by MLS Grid
- 2016-08-02 Listed $87,900 NORTHSTARMLS as Distributed by MLS Grid
Property tax history
+0.6%/yrLatest (2025): $460 · +11.7% YoY. Source: county tax records.
Cash-flow waterfall
monthlySold comps — $/sqft
last 12 mo · ≤1 miLoading sold comps…