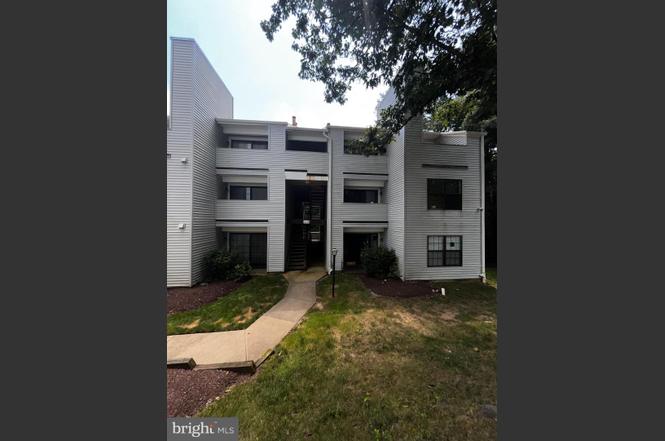
1641 Carriage House Ter Unit 1641-F · White Oak, MD
Flood risk No data
- FEMA flood zone
- —
- Chance of flooding over 30 yrs
- %
- Est. flood insurance / yr
- —
Fire risk No data
- Est. fire insurance / yr
- —
Heat risk No data
- Hot days now (above °F)
- days/yr
- Hot days in 30 yrs
- days/yr
Wind risk No data
- Chance of severe wind over 30 yrs
- %
Air-quality risk No data
- Unhealthy air days now
- days/yr
- Unhealthy air days in 30 yrs
- days/yr
Risk factors via First Street. Map © Google.
Why this score? — see what drove the C- grade
The composite is a weighted blend of 9 inputs, each scored 0–100. Each bar is that input's sub-score; the figure is the points it added to the 100-point composite (weight × sub-score).
- Cash flow +18.3/30.0
- 1% rule +10.0/10.0
- ARV discount +7.5/15.0
- DSCR +5.8/10.0
- Schools +3.6/10.0
- Livability +3.6/5.0
- Rent growth +3.0/5.0
- Condition / age +2.5/5.0
- Appreciation +0.0/10.0
$119,900
🖨 Deal sheet (PDF) 📄 Offer letter ✓ Due diligence
Listing remarks
* INVESTOR SPECIAL * 1 bed, 1.5 bath with a loft. Great location. Bring your vision. Unlimited potential. Sold strictly AS-IS. The condominium project is FHA APPROVED.
Key facts
- $481 HOA
- Parking
- Built 1986
Neighborhood map
What this means for you Summary
Snapshot
- This is a 1-bed/1.5-bath condo listed at $120k.
Deal economics
- At list price, monthly cash flow is $111 ($1k/yr) — positive.
- The deal already cash-flows at list — no discount required.
- Meets the 1% rule at list price ($2k rent vs $120k).
- Recommended offer: $106k (12.0% below list) — sets the bar for market timing.
Location & tenants
- Location reads 71/100 on livability (#152 in MD) — a middle-class / working-renter tenant base. Strengths: commute A+, health & safety A, employment B+; Watch: schools D+, crime D+, cost of living F.
- Montgomery County Public Schools (suburban): math 27% / reading 45% proficiency, ranked #3 of 24 in MD (top 12%) — families likely to look elsewhere, expect single-tenant / working-renter base with shorter leases.
- Market conditions: Rents rising (+1.9%/yr); 105 active listings in the ZIP; 19 comparable units currently listed for rent nearby; rentals leasing fast (median 9d on market — plan ~1-2 weeks tenant-placement turnaround); solid renter incomes; 3,880 units permitted in Montgomery County in 2024 (2,054 in 5+ unit buildings).
Forward outlook
- Local home prices are declining (-3.0%/yr); year-one equity from $829 of loan paydown is wiped out by about $4k of value loss. Plan a longer hold.
- Montgomery County population projected at +27% by 2050 — long-run rental-demand tailwind backs the buy-and-hold thesis.
Negotiation context
- It's been on market 125 days — a 12% lower offer ($106k) is reasonable based on typical stale-listing flexibility.
Risks & watch-outs
- Watch-outs: HOA is 27% of rent.
Questions for the listing agent
- It's been on market 125 days. Have you received any prior offers? Is the seller open to a 12% concession, seller financing, or rate buy-down credit?
- What does the HOA fee cover, when was the last increase, and are there any pending special assessments or reserve-fund shortfalls?
- Any open or pending special assessments — roof, HVAC, plumbing, elevator, façade? What's the per-unit balance and payoff schedule, and is the seller paying it off at close or rolling it to the buyer?
- Why hasn't it sold? Are there any deal-killer items the seller is aware of (foundation, flood, title, zoning, code violations)?
- Is there a deadline driving the sale (1031 exchange, divorce, estate, relocation)? That informs how much negotiation room exists.
- Schools are D-rated, which usually means shorter tenancies and higher turnover. Who's the typical renter profile here, and what's been the actual vacancy rate?
- Crime grade is D in this area — have there been break-ins, vandalism, or insurance claims at this property in the last 3 years? What carrier currently insures it and at what premium?
- What's the average days-on-market for RENTAL listings here right now (not sales)? A rising rental-DOM trend means longer vacancies and softer asking-rent achievability than the comps imply.
- What's the recent tenant-quality profile in this submarket — average credit score on applications, eviction rate, late-payment / NSF rate, and stable-employment percentage? A property-management company in the area should have these aggregated.
- How much new apartment / multifamily construction is in the pipeline within 1–3 miles? Heavy new supply (>2% of stock underway) typically softens rents 12–24 months out; light construction supports rent growth.
Investment metrics
- 1% rule
- 1.50% ✓
- Cap rate
- 7.40%
- Cash-on-cash
- 3.96%
- DSCR
- 1.18
- GRM
- 5.6
CMA / ARV
No comps found within radius.
Projected returns pro-forma
-3.0% appreciation · 1.94% rent growth · sell at horizon
- IRR
- -11.6%
- Equity multiple
- 0.58×
- Total profit
- $-13,946
- Equity at exit
- $17,877
- IRR
- -4.5%
- Equity multiple
- 0.72×
- Total profit
- $-9,367
- Equity at exit
- $10,367
Cash invested: $33,572 (down + closing). Projections, not guarantees.
Landlord ↔ Tenant lean methodology
- Overall (STATE)
- 27 Tenant-Leaning
- State Maryland
- 27 Tenant-Leaning · D+14
- County
- — inherits STATE
- City
- — inherits STATE
ZIP-level market 20904
- Rents YoY
- 1.9%
- Active inventory
- 105
- Price-to-rent
- 5.6×
Monthly cashflow live
- Estimated rent
- $1,798 high interval (Pro) →
- Mortgage (P&I)
- −$629
- Tax est. 1.5%
- −$150 /mo · $1,798/yr
- Insurance
- −$50
- HOA
- −$481
- Vacancy / Maint / Mgmt
- −$378
- Net cashflow
- $111
Break-even live
Sensitivity live
| Price | -10% $194 | -5% $152 | +0% $111 | +5% $69 | +10% $28 |
|---|---|---|---|---|---|
| Rent | -10% $-31 | -5% $40 | +0% $111 | +5% $182 | +10% $253 |
| Rate | -1.0pp $171 | -0.5pp $141 | base $111 | +0.5pp $80 | +1.0pp $48 |
UW: 25.0% down · 7.5% · 30yr · 1.5% tax · 5.0% vac · 8.0% maint · 8.0% mgmt
Financing live
Cash to close
- Down payment
- $29,975
- Closing costs
- $3,597
- Reserves months
- —
- Total cash needed
- —
Loan-product check · same deal, 3 products live
Conventional
25% down · 7.5% · 30yr
- Down + closing
- —
- Monthly P&I
- —
- Monthly cashflow
- —
- DSCR
- —
- Eligible?
- —
Personal DTI + credit; lowest rate.
DSCR
20% down · 8.5% · 30yr
- Down + closing
- —
- Monthly P&I
- —
- Monthly cashflow
- —
- DSCR
- —
- Eligible?
- —
No personal income docs; deal must DSCR.
Hard money
10% down · 12.0% · 12mo
- Down + closing
- —
- Monthly P&I
- —
- Monthly cashflow
- —
- DSCR
- —
- Eligible?
- —
Short-term bridge; refi at stabilization.
Rent comps 19 comps
| Address | Beds | Baths | Sqft | Rent | $/sqft | DOM | Units | Dist |
|---|---|---|---|---|---|---|---|---|
| 11770 Carriage House Dr Silver Spring, MD | 2.0 | 1.0 | 900 | $2,300 | $2.56 | 45d | 1 | 0.00mi |
| 1647 Carriage House Ter Silver Spring, MD | 2.0 | 2.0 | 800 | $2,000 | $2.50 | 45d | 1 | 0.04mi |
| 11542 February Cir Silver Spring, MD | 1.0–3.0 | 1.0–2.0 | 1034 | $1,511 | $1.46 | 1d | 17 | 0.17mi |
| 12001 Old Columbia Pike Silver Spring, MD | 2.0 | 2.0 | 1117 | $1,750 | $1.57 | 23d | 1 | 0.29mi |
| 12001 Old Columbia Pike Silver Spring, MD | 1.0 | 1.0 | 774 | $1,725 | $2.23 | 6d | 2 | 0.30mi |
| 11550 Stewart Ln Silver Spring, MD | 1.0–3.0 | 1.0–2.0 | 943 | $1,336 | $1.42 | 1d | 33 | 0.39mi |
| 11401 July Dr Silver Spring, MD | 2.0 | 2.0 | 1061 | $1,966 | $1.85 | 23d | 9 | 0.51mi |
| 11430 Lockwood Dr Silver Spring, MD | 1.0–2.0 | 1.0–2.0 | 937 | $1,369 | $1.46 | 1d | 19 | 0.65mi |
| 11431 Lockwood Dr Silver Spring, MD | 2.0 | 1.0 | 836 | $1,899 | $2.27 | 26d | 1 | 0.73mi |
| 11431 Lockwood Dr Silver Spring, MD | — | 1.0 | 600 | $1,199 | $2.00 | 23d | 1 | 0.73mi |
| 11431 Lockwood Dr Silver Spring, MD | 1.0–2.0 | 1.0 | 728 | $1,257 | $1.73 | 0d | 1 | 0.73mi |
| 11431 Lockwood Dr Silver Spring, MD | 1.0 | 1.0 | 684 | $1,425 | $2.08 | 4d | 1 | 0.73mi |
| 11431 Lockwood Dr Silver Spring, MD | 2.0 | 1.0 | 836 | $1,930 | $2.31 | 45d | 1 | 0.73mi |
| 17 Featherwood Ct Silver Spring, MD | 1.0–3.0 | 1.0–2.0 | 979 | $1,733 | $1.77 | 0d | 25 | 0.81mi |
| 11225 Oak Leaf Dr Silver Spring, MD | 3.0 | 1.0–2.0 | 917 | $1,361 | $1.48 | 0d | 187 | 0.95mi |
| 12230 Longfield Dr Silver Spring, MD | 1.0–3.0 | 1.0–2.5 | 1793 | $2,020 | $1.13 | 1d | 13 | 1.03mi |
| 12801 Old Columbia Pike Silver Spring, MD | 2.0 | 2.0 | 915 | $2,014 | $2.20 | 9d | 5 | 1.39mi |
| 11402 Cherry Hill Rd #103 Beltsville, MD | 1.0 | 1.0 | 759 | $1,300 | $1.71 | 45d | 1 | 1.43mi |
| 11370 Cherry Hill Rd Unit 1P104 Beltsville, MD | 1.0 | 1.0 | 759 | $1,500 | $1.98 | 45d | 1 | 1.47mi |
HOA detail condo
- Monthly dues
- $481 · $5,772/yr
- Assessments
- None detected in remarks — confirm with the listing agent.
Listing history 4 events
-
2026-06-21days on market $119,900 Active 125 DOM
-
2026-06-18days on market $119,900 Active 122 DOM
-
2026-06-18remarks 172-char remark
-
2026-06-18$119,900 Active 121 DOM
ⓘ Source: listings_history table (triggers on properties + properties_extension) + one-shot
backfill from property_details.listing_events for pre-trigger history.
Nearby sold comps map
Loading sold comps map…
Walkable amenities ~0.75 mi
Loading nearby amenities…
Taxation est. · year 1
- Rental income
- $21,576
- − Mortgage interest
- −$6,716
- − Property taxes
- −$1,798
- − Insurance
- −$600
- − Repairs & maintenance
- −$1,726
- − Management
- −$1,726
- − HOA
- −$5,772
- − Depreciation
- −$3,488
- Taxable loss
- −$250
- Est. tax savings @ 24.0%
- +$60
- After-tax cash flow
- $1,390/yr
For passive investors: Depreciation is non-cash, so a rental often shows a tax loss while cash-flowing — sheltering income. Rental losses are passive: they offset passive income freely, and up to $25,000/yr can offset ordinary (W-2) income if you actively participate and your MAGI is under $100k (phasing out to $0 by $150k); unused losses carry forward. On sale, claimed depreciation is recaptured at up to 25%, and gains may owe capital-gains tax (a 1031 exchange can defer both). Figures are a year-1 estimate at your 24.0% rate — not tax advice; consult a CPA.
Schools (NCES district)
- District
- Montgomery County Public Schools
- NCES district ID
- 2400480
- Math proficiency
- 27% ▼ -21.00%
- Reading proficiency
- 45% ▼ -10.00%
- Median HH income
- $97,191
- Composite
- 35.62/100
- National rank
- #4889
- State rank
- #3 of 24 in MD
Livability — White Oak
- Score
- 71/100
- State rank
- #152
- US rank
- #6752
Category grades
Schools grade is shown separately in the Schools card above.
Census & demographics
- Census place
- White Oak, MD
- County
- Montgomery County · 961,106 people
- Metro
- Washington-Arlington-Alexandria, DC-VA-MD-WV
- Population (ZIP)
- 58,646
- Household income
- $96,025
- Rent vs Own
- Severe rent burden
- 3682.0
Population outlook (Montgomery County) Hauer SSP2
- Today (2025)
- 1,173,231 people
- By 2030
- 1,237,402 · +5.5%
- By 2040
- 1,365,115 · +16.4%
- By 2050
- 1,491,592 · +27.1%
- By 2075
- 1,803,893 · +53.8%
- By 2100
- 2,035,619 · +73.5%
Race, ethnicity, and origin ACS 2023
- Neighborhood character
- Diverse neighborhood (Simpson 0.69)
- Race & ethnicity
- Black 48% White 20% Hispanic / Latino 16% Asian 11% Two or more races 8%
- Hispanic origin (detail)
- Mexican 2% Dominican 2%
- Common ancestry
- Hispanic 2% Romanian 1% Slovak 1%
- Foreign-born
- 39% · Canada, Vietnam, China
- Languages at home
- 53% English-only · Spanish 14% French/Haitian/Cajun 8% Other Indo-European 4%
Political lean MEDSL · Montgomery
- 2024 margin
- Solid D (+53.3) · D 75.2% · R 21.9% · Other 2.9%
- 2008→2024 swing
- +8.7pp toward D · 2008: 44.6pp · 2024: 53.3pp
- All cycles
- 2024: D+53.3 2020: D+59.6 2016: D+55.5 2012: D+43.4 2008: D+44.6
Not yet ingested
- Civics
- —
Market trends
- HPI YoY
- ▼ -344.79%
- Current HPI
- 262.4101
- Rent YoY
- ▲ 1.94%
- Metro
- Washington-Arlington-Alexandria, DC-VA-MD-WV
- State GDP YoY
- ▲ 2.97%
- F500 in state
- 12
Industry mix (Fortune 500 HQ in MD)
| Industry | F500 HQs | Revenue |
|---|---|---|
| Aerospace / Defense | 1 | $71B |
|
||
| Utilities | 1 | $25B |
|
||
| Hotels | 1 | $24B |
|
||
| Consumer Goods | 1 | $7B |
|
||
| Real Estate | 1 | $6B |
|
||
| Chemicals | 1 | $2B |
|
||
Cash-flow waterfall
monthlySold comps — $/sqft
last 12 mo · ≤1 miLoading sold comps…