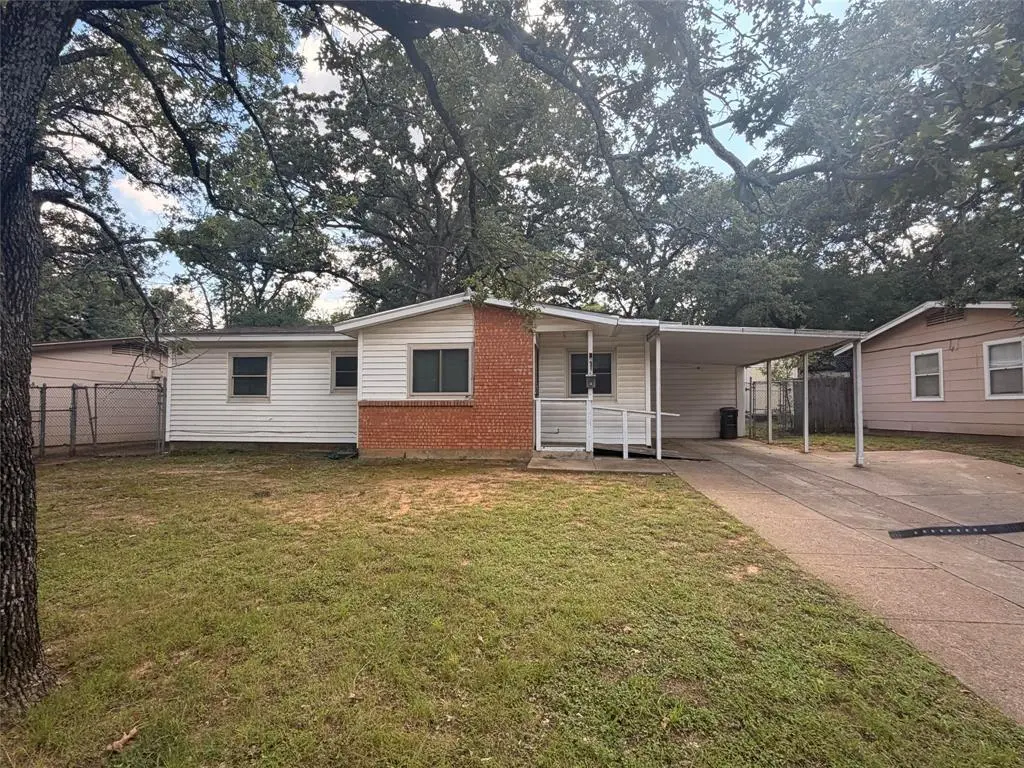
6416 Ava Court Dr · Fort Worth, TX
Flood risk 1/10 · Minimal
- FEMA flood zone
- X (unshaded)
- Chance of flooding over 30 yrs
- 0.0%
- Est. flood insurance / yr
- $507 – $1,088
Fire risk 1/10 · Minimal
- Est. fire insurance / yr
- $1,222 – $2,270
Heat risk 7/10 · Major
- Hot days now (above 110°F)
- 7 days/yr
- Hot days in 30 yrs
- 23 days/yr
Wind risk 6/10 · Moderate
- Chance of severe wind over 30 yrs
- 27.0%
Air-quality risk 3/10 · Minor
- Unhealthy air days now
- 2 days/yr
- Unhealthy air days in 30 yrs
- 4 days/yr
Risk factors via First Street. Map © Google.
Why this score? — see what drove the B- grade
The composite is a weighted blend of 9 inputs, each scored 0–100. Each bar is that input's sub-score; the figure is the points it added to the 100-point composite (weight × sub-score).
- Cash flow +26.0/30.0
- ARV discount +15.0/15.0
- DSCR +8.7/10.0
- 1% rule +7.4/10.0
- Livability +4.0/5.0
- Condition / age +2.5/5.0
- Rent growth +2.4/5.0
- Schools +2.0/10.0
- Appreciation +0.0/10.0
$125,000
🖨 Deal sheet 📄 Offer letter ✓ Due diligence
Listing remarks
Great investment opportunity in an established neighborhood. Solid foundation and a functional layout with potential to add square footage and increase value. Whether you’re looking for a buy-and-hold rental or a value-add project, this property holds multiple exit strategies. - Solid Foundation -Clean Title - Perfect Buy and hold rental -Potential to Add Square Footage & Increase Value -Excellent Fix & Flip Opportunity
Key facts
- Clean title
- Solid foundation
- 7,405 sq ft lot
Tags
Property features AI
Finance
- Other: No restrictions listed
- Financial info: Listing terms: Cash; No second mortgage indicated
- HOA & community: No homeowners association
Exterior
- Parking: Carport (covered) with space for 1 vehicle
- Utilities: City water; Not in a municipal utility district
- Home design: Single family residence; One story; Accessible entrance; Not attached to another property
- Construction: Built in 1958; Frame construction; Composition roof; Slab foundation
- Exterior features: Additional/other exterior features; Lot under 0.5 acre (approximately 0.17 acre)
Interior
- Kitchen: Small kitchen (approx. 4 x 8); No appliances included
- Bedrooms: 3 bedrooms (all on the main level); Primary bedroom about 11 x 10; Second bedroom about 8 x 9; Third bedroom about 10 x 9
- Flooring: Laminate flooring
- Bathrooms: 1 full bathroom (primary bath about 7 x 5)
- Heating & cooling: Central heating; No cooling listed
- Interior features: Paneling interior; One-level home; Six total rooms; One living area
- Laundry & utility: No washer/dryer listed
Neighborhood map
What this means for you Summary
Snapshot
- This is a 3-bed/1.0-bath single-family listed at $125k.
Deal economics
- At list price, monthly cash flow is $311 ($4k/yr) — positive.
- The deal already cash-flows at list — no discount required.
- Meets the 1% rule at list price ($2k rent vs $125k).
- Cap rate 9.3% vs local median 3.9% in Fort Worth — top-decile yield for the area; either an underpriced asset or a hidden risk that comps aren't pricing in. Stress-test before assuming the spread holds.
Location & tenants
- Location reads 80/100 on livability (#49 in TX, #1,954 nationally) — a professional / high-income tenant draw. Strengths: amenities A+, cost of living A+, housing A+; Watch: schools D+, crime F.
- Fort Worth ISD (urban): math 18% / reading 28% proficiency, ranked #742 of 826 in TX (top 90%) — low school quality limits family demand, transient renter base, plan for 1-2y turnover; 73% free/reduced lunch — lower-income household profile, screen leases tightly.
- Market conditions: Rents soft (-0.4%/yr); 169 active listings in the ZIP; 12 comparable units currently listed for rent nearby; rentals at typical pace (median 19d on market — plan ~3-4 weeks tenant-placement turnaround); 18,938 units permitted in Tarrant County in 2024 (8,336 in 5+ unit buildings).
- This rent runs 32% of the median local income ($58k/yr) — at the standard rent-burdened threshold; future hikes will face affordability resistance.
Forward outlook
- Local home prices are declining (-3.0%/yr); year-one equity from $864 of loan paydown is wiped out by about $4k of value loss. Plan a longer hold.
- Tarrant County population projected at +41% by 2050 — long-run rental-demand tailwind backs the buy-and-hold thesis.
Negotiation context
- Only 8 days on market — expect competitive offers; lowballing is unlikely to land.
Risks & watch-outs
- Watch-outs: built in 1958 — expect roof / HVAC / electrical / plumbing capex.
- Climate carrying-cost: major wind risk, 27% chance of damaging wind over 30y; extreme-heat days projected 7→23/yr by 2055 (HVAC capex compounding) — expect insurance premiums to compound above CPI over the hold.
Questions for the listing agent
- Built in 1958 — when were the roof, HVAC, electrical panel, plumbing, and water heater last replaced?
- Is there a deadline driving the sale (1031 exchange, divorce, estate, relocation)? That informs how much negotiation room exists.
- Schools are D-rated, which usually means shorter tenancies and higher turnover. Who's the typical renter profile here, and what's been the actual vacancy rate?
- Crime grade is F in this area — have there been break-ins, vandalism, or insurance claims at this property in the last 3 years? What carrier currently insures it and at what premium?
- What's the average days-on-market for RENTAL listings here right now (not sales)? A rising rental-DOM trend means longer vacancies and softer asking-rent achievability than the comps imply.
- What's the recent tenant-quality profile in this submarket — average credit score on applications, eviction rate, late-payment / NSF rate, and stable-employment percentage? A property-management company in the area should have these aggregated.
- How much new for-sale + rental construction is in the pipeline within 1–3 miles? Heavy new supply typically softens prices + rents 12–24 months out; constrained supply supports both.
Investment metrics
- 1% rule
- 1.24% ✓
- Cap rate
- 9.28%
- Cash-on-cash
- 10.67%
- DSCR
- 1.47
- GRM
- 6.7
CMA / ARV
- ARV (on-the-fly)
- $181,240
- Comps found
- 6
Show comp detail 6 sales within ~0.75 mi
| Address | Dist | Beds/Ba | Sqft | Sold | Price | $/sf | Match |
|---|---|---|---|---|---|---|---|
| 6421 Ava Court Dr | 0.03mi | 3/1.0 | 792 (+0%) | 18mo | $199,000 | $251 | 83 |
| 6271 Ava Court Dr | 0.18mi | 3/1.0 | 800 (+2%) | 7mo | $185,000 | $231 | 83 |
| 6308 Vel Dr | 0.12mi | 3/1.0 | 900 (+14%) | 2mo | $207,000 | $230 | 69 |
| 6525 Truman Dr | 0.11mi | 3/1.0 | 900 (+14%) | 5mo | $157,000 | $174 | 67 |
| 2340 Debra Court Dr | 0.20mi | 3/1.0 | 900 (+14%) | 17mo | $199,000 | $221 | 53 |
| 2112 Ransom Ter | 0.73mi | 2/1.0 (-1) | 768 (-2%) | 13mo | $132,500 | $173 | 45 |
Match score weights: distance 35% · size 25% · config 20% · recency 20%. Top-matched comps best support the ARV.
Projected returns pro-forma
-3.0% appreciation · 0.0% rent growth · sell at horizon
- IRR
- -3.9%
- Equity multiple
- 0.86×
- Total profit
- $-4,934
- Equity at exit
- $18,638
- IRR
- 1.8%
- Equity multiple
- 1.11×
- Total profit
- $3,844
- Equity at exit
- $10,808
Cash invested: $35,000 (down + closing). Projections, not guarantees.
Landlord ↔ Tenant lean methodology
- Overall (STATE)
- 87 Strongly Landlord-Friendly
- State Texas
- 87 Strongly Landlord-Friendly · R+5
- County
- — inherits STATE
- City
- — inherits STATE
ZIP-level market 76112
- Home prices YoY
- -32.0%
- Rents YoY
- -0.4%
- Active inventory
- 169
- Price-to-rent
- 6.7×
Monthly cashflow live
- Estimated rent
- $1,555 high interval (Pro) →
- Mortgage (P&I)
- −$656
- Tax from tax record
- −$210 /mo · $2,517/yr
- Insurance
- −$52
- HOA
- −$0
- Vacancy / Maint / Mgmt
- −$327
- Net cashflow
- $311
Break-even live
UW: 25.0% down · 7.5% · 30yr · 1.5% tax · 5.0% vac · 8.0% maint · 8.0% mgmt
Financing live
Cash to close
- Down payment
- $31,250
- Closing costs
- $3,750
- Reserves months
- —
- Total cash needed
- —
Loan-product check · same deal, 3 products live
Conventional
25% down · 7.5% · 30yr
- Down + closing
- —
- Monthly P&I
- —
- Monthly cashflow
- —
- DSCR
- —
- Eligible?
- —
Personal DTI + credit; lowest rate.
DSCR
20% down · 8.5% · 30yr
- Down + closing
- —
- Monthly P&I
- —
- Monthly cashflow
- —
- DSCR
- —
- Eligible?
- —
No personal income docs; deal must DSCR.
Hard money
10% down · 12.0% · 12mo
- Down + closing
- —
- Monthly P&I
- —
- Monthly cashflow
- —
- DSCR
- —
- Eligible?
- —
Short-term bridge; refi at stabilization.
Rent comps 12 comps
| Address | Beds | Baths | Sqft | Rent | $/sqft | DOM | Units | Dist |
|---|---|---|---|---|---|---|---|---|
| 2913 Hunter St Fort Worth, TX | 2.0 | 1.0 | 1000 | $1,595 | $1.59 | 19d | 1 | 1.00mi |
| 3700 Radford Rd Fort Worth, TX | 3.0 | 2.0 | 1124 | $1,650 | $1.47 | 13d | 1 | 1.16mi |
| 3700 Radford Rd Fort Worth, TX | 3.0 | 2.0 | 1124 | $1,650 | $1.47 | 24d | 1 | 1.16mi |
| 1810 Wiseman Ave Fort Worth, TX | 3.0 | 2.0 | 1000 | $1,500 | $1.50 | 44d | 1 | 1.18mi |
| 1804 Andrew Ave Fort Worth, TX | 2.0 | 1.0 | 764 | $1,395 | $1.83 | 17d | 1 | 1.24mi |
| 3201 Mount Horum Way Fort Worth, TX | 3.0 | 2.0 | 1045 | $1,699 | $1.63 | 6d | 1 | 1.32mi |
| 2128 R. W. Bivens Ln Fort Worth, TX | 3.0 | 2.0 | 1045 | $1,615 | $1.55 | 14d | 1 | 1.34mi |
| 2708 Hunter St Fort Worth, TX | 2.0 | 1.0 | 987 | $1,550 | $1.57 | 24d | 1 | 1.35mi |
| 5913 Montague St Fort Worth, TX | 3.0 | 2.0 | 1090 | $1,549 | $1.42 | 14d | 1 | 1.35mi |
| 5336 Cottey St Fort Worth, TX | 3.0 | 2.0 | 1045 | $1,699 | $1.63 | 44d | 1 | 1.36mi |
| 6617 Greenlee St Fort Worth, TX | 2.0 | 1.0 | 1050 | $1,499 | $1.43 | 21d | 1 | 1.37mi |
| 3848 Waldorf St Fort Worth, TX | 2.0 | 1.0 | 734 | $1,195 | $1.63 | 5d | 1 | 1.47mi |
Listing history 6 events
-
2026-06-17days on market $125,000 Active 8 DOM
-
2026-06-16days on market $125,000 Active 7 DOM
-
2026-06-15days on market $125,000 Active 6 DOM
-
2026-06-13days on market $125,000 Active 4 DOM
-
2026-06-10remarks 439-char remark
-
2026-06-10$125,000 Active 1 DOM
ⓘ Source: listings_history table (triggers on properties + properties_extension) + one-shot
backfill from property_details.listing_events for pre-trigger history.
Tax reassessment forecast TX · Resets to sale price
- Current annual tax
- $2,517 · $210/mo
- Projected year-2 tax
- $2,517 · $210/mo
- Expected delta
- $0/yr ($0/mo · 0.0%)
ⓘ Screening estimate from a state-policy table — verify with the county assessor before closing.
Climate risk First Street
- Flood 1/10 Low FEMA zone X (unshaded) · 0% chance over 30 yrs
- Wildfire 1/10 Low
- Heat 7/10 Severe 7 d/yr ≥110°F today · 23 d/yr by 30 yrs out
- Wind 6/10 Major 27% chance of damaging wind over 30 yrs
- Air quality 3/10 Moderate 2 unhealthy d/yr today · 4 by 30 yrs out
Nearby sold comps map
Loading sold comps map…
Walkable amenities ~0.75 mi
Loading nearby amenities…
Taxation est. · year 1
- Rental income
- $18,663
- − Mortgage interest
- −$7,002
- − Property taxes
- −$2,517
- − Insurance
- −$625
- − Repairs & maintenance
- −$1,493
- − Management
- −$1,493
- − Depreciation
- −$3,636
- Taxable income
- $1,896
- Est. tax owed @ 24.0%
- −$455
- After-tax cash flow
- $3,280/yr
For passive investors: Depreciation is non-cash, so a rental often shows a tax loss while cash-flowing — sheltering income. Rental losses are passive: they offset passive income freely, and up to $25,000/yr can offset ordinary (W-2) income if you actively participate and your MAGI is under $100k (phasing out to $0 by $150k); unused losses carry forward. On sale, claimed depreciation is recaptured at up to 25%, and gains may owe capital-gains tax (a 1031 exchange can defer both). Figures are a year-1 estimate at your 24.0% rate — not tax advice; consult a CPA.
Schools (NCES district)
- District
- Fort Worth ISD
- NCES district ID
- 4819700
- Math proficiency
- 18% ▼ -16.00%
- Reading proficiency
- 28% ▼ -6.00%
- Median HH income
- $42,109
- Composite
- 19.61/100
- National rank
- #8753
- State rank
- #742 of 826 in TX
Livability — Fort Worth
- Score
- 80/100
- State rank
- #49
- US rank
- #1954
Category grades
Schools grade is shown separately in the Schools card above.
Census & demographics
- Census place
- Fort Worth, TX
- County
- Tarrant County · 2,033,669 people
- City population
- 911,619
- Metro
- Dallas-Fort Worth-Arlington, TX
- Population (ZIP)
- 44,514
- Household income
- $57,724
- Rent vs Own
- Severe rent burden
- 3056.0
Population outlook (Tarrant County) Hauer SSP2
- Today (2025)
- 2,380,417 people
- By 2030
- 2,578,900 · +8.3%
- By 2040
- 2,974,995 · +25.0%
- By 2050
- 3,350,489 · +40.8%
- By 2075
- 4,216,909 · +77.2%
- By 2100
- 4,741,527 · +99.2%
Race, ethnicity, and origin ACS 2023
- Neighborhood character
- Diverse neighborhood (Simpson 0.69)
- Race & ethnicity
- Black 38% Hispanic / Latino 34% White 21% Two or more races 19% Asian 3%
- Hispanic origin (detail)
- Mexican 28% Puerto Rican 1%
- Common ancestry
- Lithuanian 1% Slovak 1% Swiss 1%
- Foreign-born
- 15% · Canada, Vietnam
- Languages at home
- 67% English-only · Spanish 29% Other Indo-European 1% Vietnamese 1%
Political lean MEDSL · Tarrant
- 2024 margin
- Lean R (+5.1) · D 46.7% · R 51.9% · Other 1.4%
- 2008→2024 swing
- +6.6pp toward D · 2008: -11.7pp · 2024: -5.1pp
- All cycles
- 2024: R+5.1 2020: D+0.2 2016: R+8.7 2012: R+15.7 2008: R+11.7
Not yet ingested
- Civics
- —
Market trends
- HPI YoY
- ▼ -158.49%
- Current HPI
- 336.6297
- Rent YoY
- ▼ -0.43%
- Metro
- Dallas-Fort Worth-Arlington, TX
- State GDP YoY
- ▲ 3.95%
- F500 in state
- 110
Industry mix (Fortune 500 HQ in TX)
| Industry | F500 HQs | Revenue |
|---|---|---|
| Energy | 16 | $1,198B |
|
||
| Technology | 5 | $198B |
|
||
| Engineering / Construction | 4 | $72B |
|
||
| Energy Services | 3 | $60B |
|
||
| Utilities | 3 | $41B |
|
||
| Healthcare | 2 | $330B |
|
||
Price history
1 event — show timeline
- 2026-06-09 Listed $125,000 NTREIS
Property tax history
+8.6%/yrLatest (2025): $2,517 · -2.4% YoY. Source: county tax records.
Cash-flow waterfall
monthlySold comps — $/sqft
last 12 mo · ≤1 miLoading sold comps…