 Duplex
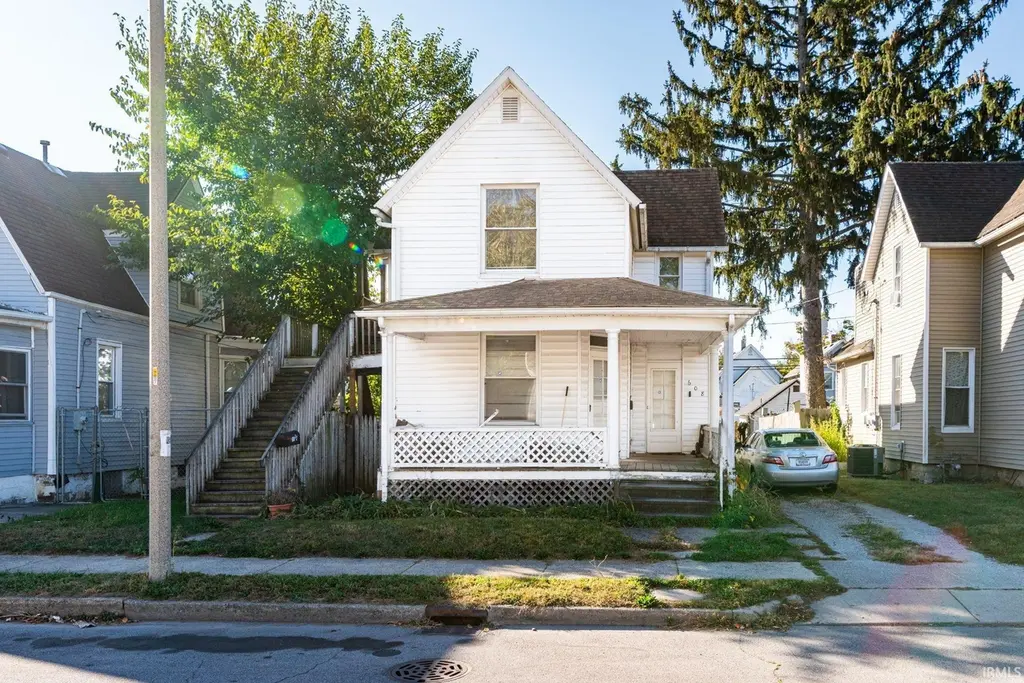
608 Anderson Ave · Fort Wayne, IN
Flood risk 5/10 · Moderate
- FEMA flood zone
- X
- Chance of flooding over 30 yrs
- 0.24%
- Est. flood insurance / yr
- $507 – $1,088
Fire risk 1/10 · Minimal
- Est. fire insurance / yr
- $717 – $1,331
Heat risk 3/10 · Minor
- Hot days now (above 100°F)
- 7 days/yr
- Hot days in 30 yrs
- 17 days/yr
Wind risk 2/10 · Minimal
- Chance of severe wind over 30 yrs
- —
Air-quality risk 3/10 · Minor
- Unhealthy air days now
- 2 days/yr
- Unhealthy air days in 30 yrs
- 3 days/yr
Risk factors via First Street. Map © Google.
Why this score? — see what drove the B- grade
The composite is a weighted blend of 9 inputs, each scored 0–100. Each bar is that input's sub-score; the figure is the points it added to the 100-point composite (weight × sub-score).
- Cash flow +29.5/30.0
- DSCR +10.0/10.0
- 1% rule +8.5/10.0
- ARV discount +8.4/15.0
- Livability +4.2/5.0
- Rent growth +2.7/5.0
- Condition / age +2.5/5.0
- Schools +2.2/10.0
- Appreciation +0.0/10.0
$170,000
🖨 Deal sheet (PDF) 📄 Offer letter ✓ Due diligence
Multi-family units
County records classify this as Multi-Family (2-4 Unit). Listing-text estimate: 2 units. confirmed
Listing remarks MLS
This cash-flowing duplex is a strong investment opportunity located just minutes from downtown Fort Wayne. The property features a 2-bedroom, 1-bath main floor unit currently renting for $750/month, along with a 1-bedroom, 1-bath upper unit generating $850/month—bringing total monthly income to $1,600. Utilities are efficiently structured with two electric meters, one gas meter (serving the lower unit with gas heat), and a single water meter, with water and sewer expenses allocated through a RUBS (Ratio Utility Billing System). The upper unit is fully electric, and tenants provide their own air conditioning units. The owner currently covers lawn care, and the property is professionally managed, offering a turnkey, low-maintenance investment for both seasoned and new investors alike.
Key facts
- Fully electric
- Downtown fort wayne
- Two electric meters
Tags
Neighborhood map
What this means for you Summary
Snapshot
- This is a 2 × 3-bed/1.0-bath units multifamily listed at $170k.
Deal economics
- At list price, monthly cash flow is $606 ($7k/yr) — positive. Per door: $303/mo.
- The deal already cash-flows at list — no discount required.
- Meets the 1% rule at list price ($2k rent vs $170k).
- Recommended offer: $165k (3.0% below list) — sets the bar for market timing.
- Cap rate 10.6% vs local median 4.7% in Fort Wayne — top-decile yield for the area; either an underpriced asset or a hidden risk that comps aren't pricing in. Stress-test before assuming the spread holds.
Location & tenants
- Location reads 84/100 on livability (#6 in IN, #676 nationally) — a professional / high-income tenant draw. Strengths: amenities A+, commute A+, cost of living A+; Watch: crime C-, employment D+.
- Fort Wayne Community Schools (urban): math 22% / reading 29% proficiency, ranked #263 of 301 in IN (top 87%) — low school quality limits family demand, transient renter base, plan for 1-2y turnover; 60% free/reduced lunch — lower-income household profile, screen leases tightly.
- Zoned schools: Forest Park Elementary School (math 21% / reading 22%, grade F, #803 of 994 statewide, top 81%, 601 students, 75% FRL); Lakeside Middle School (math 8% / reading 17%, grade F, #310 of 330 statewide, top 94%, 502 students, 78% FRL); North Side High School (math 19% / reading 51%, grade F, #266 of 369 statewide, top 73%, 1,474 students, 66% FRL).
- Market conditions: Rents flat; 113 active listings in the ZIP; 19 comparable units currently listed for rent nearby; rentals at typical pace (median 23d on market — plan ~3-4 weeks tenant-placement turnaround); 42% of comp listings sitting > 30 days — soft ceiling on asking rent; 1,861 units permitted in Allen County in 2024 (576 in 5+ unit buildings).
Forward outlook
- Local home prices are declining (-3.0%/yr); year-one equity from $1k of loan paydown is wiped out by about $5k of value loss. Plan a longer hold.
- Allen County population projected at +10% by 2050 — modest demand growth; plan on rents tracking national, not racing it.
- At projected returns (-3.0% appreciation + 0.8% rent growth), your $48k cash investment doubles in ~10 years — after that, you're playing with house money.
Negotiation context
- It's been on market 56 days — a 3% lower offer ($165k) is reasonable based on typical stale-listing flexibility.
- 5 sale attempts since 10y ago with the ask held roughly flat each time — persistent listings suggest the price (not the market) is what's stuck; bring a comps-based counter.
- Current owner paid $125k; 36% above their basis — modest negotiation headroom, anchor on the comps not their cost.
Risks & watch-outs
- Watch-outs: built in 1925 — expect roof / HVAC / electrical / plumbing capex.
- Climate carrying-cost: moderate flood risk — expect insurance premiums to compound above CPI over the hold.
Questions for the listing agent
- It's been on market 56 days. Have you received any prior offers? Is the seller open to a 3% concession, seller financing, or rate buy-down credit?
- Can we see the unit-by-unit rent roll, current vacancy, and any below-market leases? What's the average tenancy length?
- What capital expenditures (roof, boiler, parking lot, exteriors) have been made in the last 5 years, and what's planned in the next 2?
- Built in 1925 — when were the roof, HVAC, electrical panel, plumbing, and water heater last replaced?
- Is there a deadline driving the sale (1031 exchange, divorce, estate, relocation)? That informs how much negotiation room exists.
- Schools are D-rated, which usually means shorter tenancies and higher turnover. Who's the typical renter profile here, and what's been the actual vacancy rate?
- What's the average days-on-market for RENTAL listings here right now (not sales)? A rising rental-DOM trend means longer vacancies and softer asking-rent achievability than the comps imply.
- What's the recent tenant-quality profile in this submarket — average credit score on applications, eviction rate, late-payment / NSF rate, and stable-employment percentage? A property-management company in the area should have these aggregated.
- How much new apartment / multifamily construction is in the pipeline within 1–3 miles? Heavy new supply (>2% of stock underway) typically softens rents 12–24 months out; light construction supports rent growth.
Investment metrics
- 1% rule
- 1.35% ✓
- Cap rate
- 10.57%
- Cash-on-cash
- 15.28%
- DSCR
- 1.68
- GRM
- 6.2
CMA / ARV
- ARV (median comp)
- $173,574
- List price
- $170,000
- Delta
- -2.06%
- Verdict
- FAIR
- Comps
- 20 within 1.0 mi
Show comp detail 7 sales within ~0.75 mi
| Address | Dist | Beds/Ba | Sqft | Sold | Price | $/sf | Match |
|---|---|---|---|---|---|---|---|
| 1331 Spy Run Ave | 0.18mi | 4/4.0 | 1,608 (-1%) | 6mo | $235,000 | $146 | 78 |
| 1822 Tecumseh St | 0.49mi | 4/2.0 | 1,662 (+3%) | 8mo | $138,000 | $83 | 66 |
| 1806 Crescent Ave | 0.58mi | 4/2.0 | 1,672 (+3%) | 10mo | $230,000 | $138 | 59 |
| 1714 Saint Joe Blvd | 0.29mi | 3/2.0 (-1) | 1,492 (-8%) | 22mo | $170,000 | $114 | 50 |
| 1117 Edgewater Ave | 0.56mi | 3/2.0 (-1) | 1,708 (+5%) | 20mo | $225,000 | $132 | 43 |
| 846 Columbia Ave | 0.44mi | 4/2.0 | 1,841 (+14%) | 18mo | $126,000 | $68 | 41 |
| 1114 Crescent Ave | 0.54mi | 3/2.0 (-1) | 1,786 (+10%) | 22mo | $220,000 | $123 | 34 |
Match score weights: distance 35% · size 25% · config 20% · recency 20%. Top-matched comps best support the ARV.
Projected returns pro-forma
-3.0% appreciation · 0.75% rent growth · sell at horizon
- IRR
- 3.4%
- Equity multiple
- 1.13×
- Total profit
- $6,051
- Equity at exit
- $25,348
- IRR
- 10.6%
- Equity multiple
- 1.74×
- Total profit
- $35,331
- Equity at exit
- $14,698
Cash invested: $47,600 (down + closing). Projections, not guarantees.
Landlord ↔ Tenant lean methodology
- Overall (STATE)
- 90 Strongly Landlord-Friendly
- State Indiana
- 90 Strongly Landlord-Friendly · R+11
- County
- — inherits STATE
- City
- — inherits STATE
ZIP-level market 46805
- Rents YoY
- 0.8%
- Active inventory
- 113
- Price-to-rent
- 12.4×
Monthly cashflow live
- Estimated rent
- $2,287 high interval (Pro) →
- Mortgage (P&I)
- −$891
- Tax from tax record
- −$238 /mo · $2,858/yr
- Insurance
- −$71
- HOA
- −$0
- Vacancy / Maint / Mgmt
- −$480
- Net cashflow
- $606
Break-even live
Sensitivity live
| Price | -10% $702 | -5% $654 | +0% $606 | +5% $558 | +10% $510 |
|---|---|---|---|---|---|
| Rent | -10% $426 | -5% $516 | +0% $606 | +5% $697 | +10% $787 |
| Rate | -1.0pp $692 | -0.5pp $649 | base $606 | +0.5pp $562 | +1.0pp $517 |
2-unit breakdown (identical units grouped — click to expand)
| Units | Beds | Baths | Est. rent |
|---|---|---|---|
| 2× units | 3 | 1 | $2,288 |
| #1 | 3 | 1 | $1,144 |
| #2 | 3 | 1 | $1,144 |
| Total (2 units) | $2,287 | ||
UW: 25.0% down · 7.5% · 30yr · 1.5% tax · 5.0% vac · 8.0% maint · 8.0% mgmt
Financing live
Cash to close
- Down payment
- $42,500
- Closing costs
- $5,100
- Reserves months
- —
- Total cash needed
- —
Loan-product check · same deal, 3 products live
Conventional
25% down · 7.5% · 30yr
- Down + closing
- —
- Monthly P&I
- —
- Monthly cashflow
- —
- DSCR
- —
- Eligible?
- —
Personal DTI + credit; lowest rate.
DSCR
20% down · 8.5% · 30yr
- Down + closing
- —
- Monthly P&I
- —
- Monthly cashflow
- —
- DSCR
- —
- Eligible?
- —
No personal income docs; deal must DSCR.
Hard money
10% down · 12.0% · 12mo
- Down + closing
- —
- Monthly P&I
- —
- Monthly cashflow
- —
- DSCR
- —
- Eligible?
- —
Short-term bridge; refi at stabilization.
Rent comps 19 comps
| Address | Beds | Baths | Sqft | Rent | $/sqft | DOM | Units | Dist |
|---|---|---|---|---|---|---|---|---|
| 1516 Bayer Ave Fort Wayne, IN | 4.0 | 2.0 | 1280 | $1,299 | $1.01 | 16d | 1 | 0.36mi |
| 805 Edgewater Ave Fort Wayne, IN | 3.0 | 1.0 | 1075 | $1,550 | $1.44 | 16d | 1 | 0.44mi |
| 807 Edgewater Ave Fort Wayne, IN | 3.0 | 1.0 | 1075 | $1,450 | $1.35 | 23d | 1 | 0.44mi |
| 1726 Tecumseh St Fort Wayne, IN | 3.0 | 1.0 | 1280 | $1,350 | $1.05 | 16d | 1 | 0.46mi |
| 2403 N Clinton St Fort Wayne, IN | 3.0 | 2.0 | 1666 | $1,750 | $1.05 | 46d | 1 | 0.74mi |
| 2315 Terrace Rd Fort Wayne, IN | 3.0 | 1.0 | 1466 | $1,600 | $1.09 | 46d | 1 | 0.76mi |
| 1132 S Hanna St Unit 1 Fort Wayne, IN | 4.0 | 1.5 | 1656 | $1,600 | $0.97 | 46d | 1 | 0.82mi |
| 607 Curdes Ave Fort Wayne, IN | 3.0 | 1.5 | 1072 | $1,450 | $1.35 | 23d | 1 | 0.92mi |
| 702 Archer Ave Fort Wayne, IN | 3.0 | 1.5 | 1273 | $1,499 | $1.18 | 46d | 1 | 1.00mi |
| 739 W 4th St Fort Wayne, IN | 4.0 | 2.0 | 1750 | $1,995 | $1.14 | 16d | 1 | 1.00mi |
| 1131 E Lewis St Fort Wayne, IN | 4.0 | 2.0 | 1476 | $1,950 | $1.32 | 16d | 1 | 1.02mi |
| 2008 N Anthony Blvd Fort Wayne, IN | 3.0 | 2.5 | 2035 | $1,825 | $0.90 | 16d | 1 | 1.04mi |
| 1501 E Lewis St Fort Wayne, IN | 4.0 | 1.0 | 2000 | $1,450 | $0.72 | 46d | 1 | 1.17mi |
| 603 Lavina St Fort Wayne, IN | 3.0 | 2.0 | 1872 | $1,899 | $1.01 | 46d | 1 | 1.28mi |
| 2508 Woodward Ave Fort Wayne, IN | 3.0 | 1.0 | 1300 | $1,700 | $1.31 | 16d | 1 | 1.37mi |
| 877 Lavina St Fort Wayne, IN | 1.0–3.0 | 1.0–2.0 | 997 | $2,980 | $2.99 | 46d | 17 | 1.37mi |
| 859 Buchanan St Fort Wayne, IN | 1.0–4.0 | 1.0 | 887 | $1,249 | $1.41 | 23d | 1 | 1.42mi |
| 1118 Rockhill St Fort Wayne, IN | 3.0 | 3.0 | 1790 | $2,300 | $1.28 | 46d | 1 | 1.43mi |
| 1502 3rd St Fort Wayne, IN | 3.0 | 1.5 | 1344 | $1,650 | $1.23 | 16d | 1 | 1.45mi |
Listing history 11 events
-
2026-04-01$170,000 Active 799-char remark
Show marketing remark (799 chars)
This cash-flowing duplex is a strong investment opportunity located just minutes from downtown Fort Wayne. The property features a 2-bedroom, 1-bath main floor unit currently renting for $750/month, along with a 1-bedroom, 1-bath upper unit generating $850/month—bringing total monthly income to $1,600. Utilities are efficiently structured with two electric meters, one gas meter (serving the lower unit with gas heat), and a single water meter, with water and sewer expenses allocated through a RUBS (Ratio Utility Billing System). The upper unit is fully electric, and tenants provide their own air conditioning units. The owner currently covers lawn care, and the property is professionally managed, offering a turnkey, low-maintenance investment for both seasoned and new investors alike.
-
2025-11-22historical $750
-
2025-08-13price $750
-
2025-05-03price $800
-
2025-05-01$850
-
2022-03-22soldstatus $125,000 255-char remark
Show marketing remark (255 chars)
Both units are occupied. Just North of Downtown Ft Wayne. 2, two bedroom units. Unit 1 is on the main level with an updated bathroom. Unit 2 is on the upper level. Owner pays all water & sewer, other utilities are separate. Sold with Tenants Rights.
-
2022-02-02$139,900 255-char remark
Show marketing remark (255 chars)
Both units are occupied. Just North of Downtown Ft Wayne. 2, two bedroom units. Unit 1 is on the main level with an updated bathroom. Unit 2 is on the upper level. Owner pays all water & sewer, other utilities are separate. Sold with Tenants Rights.
-
2019-06-24soldstatus $65,000
-
2019-03-14$69,900
-
2016-09-16soldstatus $45,900
-
2016-07-18$49,900
ⓘ Source: listings_history table (triggers on properties + properties_extension) + one-shot
backfill from property_details.listing_events for pre-trigger history.
Tax reassessment forecast IN · Partial reset (capped growth)
- Current annual tax
- $2,858 · $238/mo
- Projected year-2 tax
- $2,858 · $238/mo
- Expected delta
- $0/yr ($0/mo · 0.0%)
ⓘ Screening estimate from a state-policy table — verify with the county assessor before closing.
Climate risk First Street
- Flood 5/10 Major FEMA zone X · 24% chance over 30 yrs
- Wildfire 1/10 Low
- Heat 3/10 Moderate 7 d/yr ≥100°F today · 17 d/yr by 30 yrs out
- Wind 2/10 Low
- Air quality 3/10 Moderate 2 unhealthy d/yr today · 3 by 30 yrs out
Nearby sold comps map
Loading sold comps map…
Walkable amenities ~0.75 mi
Loading nearby amenities…
Taxation est. · year 1
- Rental income
- $27,444
- − Mortgage interest
- −$9,523
- − Property taxes
- −$2,858
- − Insurance
- −$850
- − Repairs & maintenance
- −$2,196
- − Management
- −$2,196
- − Depreciation
- −$4,945
- Taxable income
- $4,877
- Est. tax owed @ 24.0%
- −$1,171
- After-tax cash flow
- $6,105/yr
For passive investors: Depreciation is non-cash, so a rental often shows a tax loss while cash-flowing — sheltering income. Rental losses are passive: they offset passive income freely, and up to $25,000/yr can offset ordinary (W-2) income if you actively participate and your MAGI is under $100k (phasing out to $0 by $150k); unused losses carry forward. On sale, claimed depreciation is recaptured at up to 25%, and gains may owe capital-gains tax (a 1031 exchange can defer both). Figures are a year-1 estimate at your 24.0% rate — not tax advice; consult a CPA.
Schools (NCES district)
- District
- Fort Wayne Community Schools
- NCES district ID
- 1803630
- Math proficiency
- 22% ▼ -11.00%
- Reading proficiency
- 29% ▼ -7.00%
- Median HH income
- $41,951
- Composite
- 21.68/100
- National rank
- #8275
- State rank
- #263 of 301 in IN
Livability — Fort Wayne
- Score
- 84/100
- State rank
- #6
- US rank
- #676
Category grades
Schools grade is shown separately in the Schools card above.
Census & demographics
- Census place
- Fort Wayne, IN
- County
- Allen County · 326,813 people
- City population
- 326,813
- Metro
- Fort Wayne, IN
- Population (ZIP)
- 21,437
- Household income
- $52,154
- Rent vs Own
- Severe rent burden
- 904.0
Population outlook (Allen County) Hauer SSP2
- Today (2025)
- 394,020 people
- By 2030
- 405,128 · +2.8%
- By 2040
- 423,476 · +7.5%
- By 2050
- 435,137 · +10.4%
- By 2075
- 450,293 · +14.3%
- By 2100
- 424,101 · +7.6%
Race, ethnicity, and origin ACS 2023
- Neighborhood character
- Predominantly White (72%)
- Race & ethnicity
- White 72% Black 9% Two or more races 8% Hispanic / Latino 7% Asian 5%
- Hispanic origin (detail)
- Mexican 4%
- Common ancestry
- Lithuanian 3% Slovak 3% Italian 2%
- Foreign-born
- 6% · Philippines, Canada
- Languages at home
- 91% English-only · Other Asian/Pacific 3% Spanish 3%
Political lean MEDSL · Allen
- 2024 margin
- R (+12.5) · D 42.9% · R 55.4% · Other 1.7%
- 2008→2024 swing
- -8.1pp toward R · 2008: -4.3pp · 2024: -12.5pp
- All cycles
- 2024: R+12.5 2020: R+11.2 2016: R+19.6 2012: R+16.8 2008: R+4.3
Not yet ingested
- Civics
- —
Market trends
- HPI YoY
- ▼ -356.64%
- Current HPI
- 286.2643
- Rent YoY
- ▲ 0.75%
- Metro
- Fort Wayne, IN
- State GDP YoY
- ▲ 2.90%
- F500 in state
- 18
Industry mix (Fortune 500 HQ in IN)
| Industry | F500 HQs | Revenue |
|---|---|---|
| Industrial Machinery | 2 | $37B |
|
||
| Healthcare | 1 | $177B |
|
||
| Pharmaceuticals | 1 | $45B |
|
||
| Metals / Steel | 1 | $18B |
|
||
| Agriculture | 1 | $17B |
|
||
| Packaging | 1 | $12B |
|
||
Price history
+240.7% since first listed11 events — show timeline
- 2026-04-01 Listed $170,000 IRMLS
- 2025-11-22 Rental Removed $750 TENANTTURNER2
- 2025-08-13 Price Changed $750 TENANTTURNER2
- 2025-05-03 Price Changed $800 TENANTTURNER2
- 2025-05-01 Listed for Rent $850 TENANTTURNER2
- 2022-03-22 Sold (MLS) $125,000 IRMLS
- 2022-02-02 Listed $139,900 IRMLS
- 2019-06-24 Sold (MLS) $65,000 IRMLS
- 2019-03-14 Listed $69,900 IRMLS
- 2016-09-16 Sold (MLS) $45,900 IRMLS
- 2016-07-18 Listed $49,900 IRMLS
Property tax history
+6.3%/yrLatest (2024): $2,858 · +3.1% YoY. Source: county tax records.
Cash-flow waterfall
monthlySold comps — $/sqft
last 12 mo · ≤1 miLoading sold comps…