1468 Grand Ave #9 · San Leandro, CA
Flood risk 1/10 · Minimal
- FEMA flood zone
- X (unshaded)
- Chance of flooding over 30 yrs
- 0.0%
- Est. flood insurance / yr
- $507 – $1,088
Fire risk 4/10 · Minor
- Est. fire insurance / yr
- $659 – $1,223
Heat risk 3/10 · Minor
- Hot days now (above 87°F)
- 7 days/yr
- Hot days in 30 yrs
- 15 days/yr
Wind risk 1/10 · Minimal
- Chance of severe wind over 30 yrs
- —
Air-quality risk 7/10 · Major
- Unhealthy air days now
- 12 days/yr
- Unhealthy air days in 30 yrs
- 12 days/yr
Risk factors via First Street. Map © Google.
Why this score? — see what drove the B+ grade
The composite is a weighted blend of 9 inputs, each scored 0–100. Each bar is that input's sub-score; the figure is the points it added to the 100-point composite (weight × sub-score).
- Cash flow +30.0/30.0
- ARV discount +12.4/15.0
- 1% rule +10.0/10.0
- DSCR +10.0/10.0
- Condition / age +4.0/5.0
- Schools +3.4/10.0
- Livability +3.4/5.0
- Rent growth +2.9/5.0
- Appreciation +0.0/10.0
$97,000
🖨 Deal sheet 📄 Offer letter ✓ Due diligence
Listing remarks
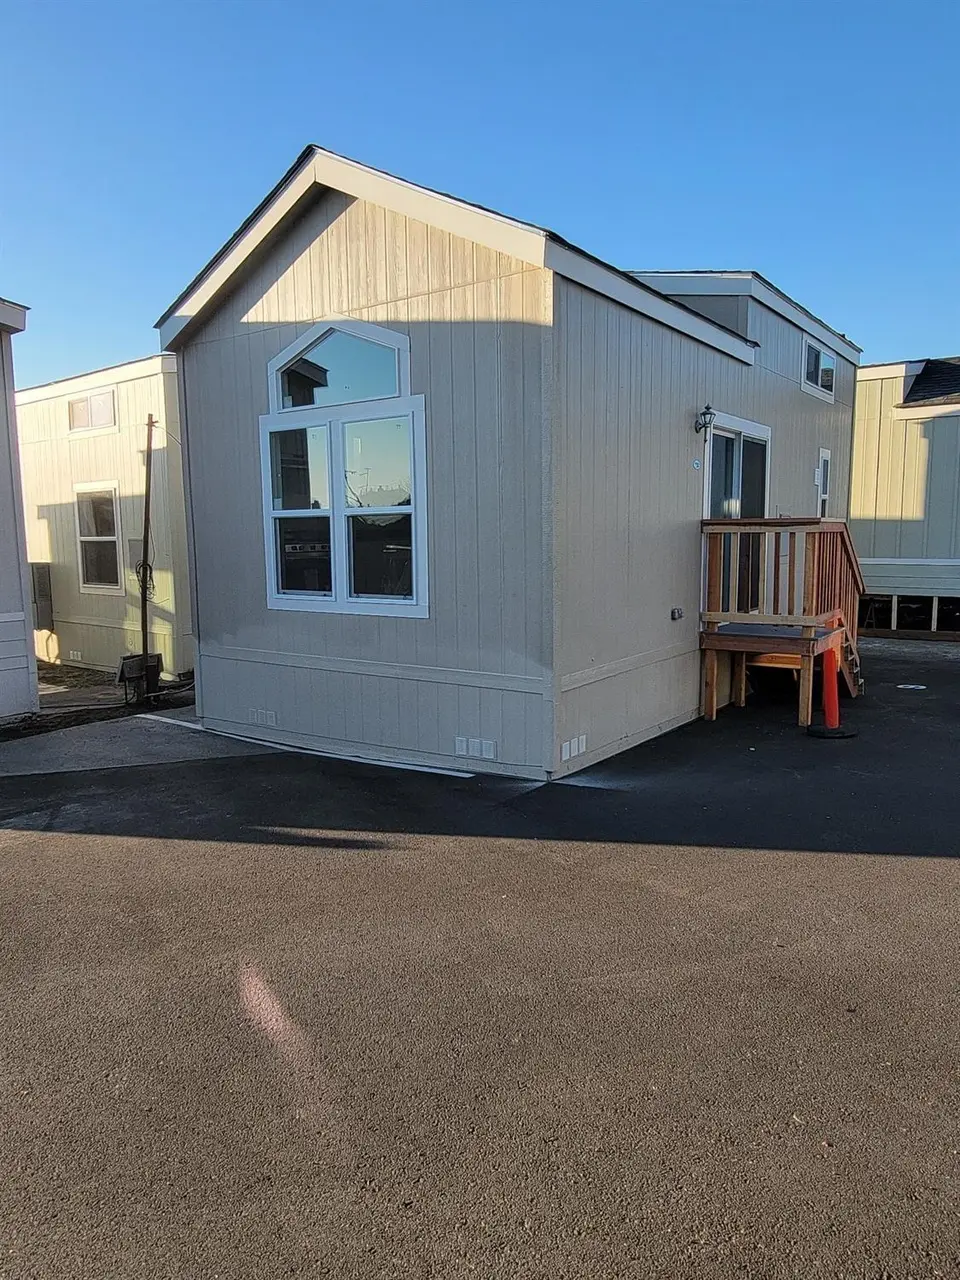
Updated and move-in ready, this charming 1-bedroom, 1-bath park model home with a spacious loft offers comfortable, efficient living in a well-maintained mobile home community. Thoughtfully upgraded throughout, the home features a beautifully appointed kitchen with a gas stove, modern finishes, and a functional layout that maximizes every square foot. The open living area creates a bright and inviting atmosphere, while the loft provides flexible space ideal for storage, guests, or a home office. Conveniently located for commuters, this home offers easy access to nearby freeways, shopping, dining, and everyday essentials. A great opportunity for low-maintenance living in a desirable park set
Key facts
- Flexible space
- Open living area
- Gas stove
Tags
Property features AI
Finance
- Other: Located in a non-senior community; Address: 1468 Grand Ave #9, San Leandro, CA 94577 (unit located closest to the street/near park exit)
- Financial info: Land lease: No (listed land lease amount present in source but treated as not applicable)
- HOA & community: No association
Exterior
- Parking: Assigned parking; Off-street parking
- Utilities: Public water; Public sewer; Electric: other; Cable available
- Home design: Manufactured in-park (park model); Original condition; Built in 2022; Skirting: wood and fiberglass
- Construction: Skirted with wood and fiberglass
- Exterior features: Composition roof; No notable lot features
Interior
- Kitchen: Free-standing gas range; Free-standing refrigerator; Hood over range
- Bedrooms: 1 bedroom
- Flooring: Carpet; Laminate
- Bathrooms: 1 full bathroom with shower stall(s)
- Heating & cooling: Wall unit(s) for cooling; Other heating
- Interior features: Stone counter in the kitchen; Dual-pane full windows; Porch steps; Unfurnished; Washer/dryer stacked included (inside unit); Pets allowed
- Laundry & utility: Stacked washer/dryer included inside the unit; Gas water heater
Neighborhood map
What this means for you Summary
Snapshot
- This is a 1-bed/1.0-bath manufactured listed at $97k. Condition is rated good.
Deal economics
- At list price, monthly cash flow is $775 ($9k/yr) — positive.
- The deal already cash-flows at list — no discount required.
- Meets the 1% rule at list price ($2k rent vs $97k).
- Recommended offer: $96k (1.5% below list) — sets the bar for market timing.
- Cap rate 15.9% vs local median 2.0% in San Leandro — top-decile yield for the area; either an underpriced asset or a hidden risk that comps aren't pricing in. Stress-test before assuming the spread holds.
Location & tenants
- Location reads 68/100 on livability (#289 in CA) — a middle-class / working-renter tenant base. Strengths: commute A+, employment A+, health & safety A+; Watch: amenities C-, schools D, crime F.
- San Leandro Unified (urban): math 28% / reading 42% proficiency, ranked #831 of 1,400 in CA (top 59%) — families likely to look elsewhere, expect single-tenant / working-renter base with shorter leases.
- Market conditions: Rents rising (+1.7%/yr); 106 active listings in the ZIP; solid renter incomes; 1,742 units permitted in Alameda County in 2024 (856 in 5+ unit buildings).
Forward outlook
- Local home prices are declining (-3.0%/yr); year-one equity from $671 of loan paydown is wiped out by about $3k of value loss. Plan a longer hold.
- Alameda County population projected at +34% by 2050 — long-run rental-demand tailwind backs the buy-and-hold thesis.
- At projected returns (-3.0% appreciation + 1.7% rent growth), your $27k cash investment doubles in ~4 years — after that, you're playing with house money.
Negotiation context
- It's been on market 20 days — a 2% lower offer ($96k) is reasonable based on typical stale-listing flexibility.
Questions for the listing agent
- Is there a deadline driving the sale (1031 exchange, divorce, estate, relocation)? That informs how much negotiation room exists.
- Schools are D-rated, which usually means shorter tenancies and higher turnover. Who's the typical renter profile here, and what's been the actual vacancy rate?
- Crime grade is F in this area — have there been break-ins, vandalism, or insurance claims at this property in the last 3 years? What carrier currently insures it and at what premium?
- What's the average days-on-market for RENTAL listings here right now (not sales)? A rising rental-DOM trend means longer vacancies and softer asking-rent achievability than the comps imply.
- What's the recent tenant-quality profile in this submarket — average credit score on applications, eviction rate, late-payment / NSF rate, and stable-employment percentage? A property-management company in the area should have these aggregated.
- How much new for-sale + rental construction is in the pipeline within 1–3 miles? Heavy new supply typically softens prices + rents 12–24 months out; constrained supply supports both.
Investment metrics
- 1% rule
- 1.89% ✓
- Cap rate
- 15.88%
- Cash-on-cash
- 34.25%
- DSCR
- 2.52
- GRM
- 4.4
CMA / ARV
- ARV (on-the-fly)
- $108,966
- Comps found
- 1
Show comp detail 1 sale within ~0.75 mi
| Address | Dist | Beds/Ba | Sqft | Sold | Price | $/sf | Match |
|---|---|---|---|---|---|---|---|
| 1468 Grand Ave #40 | 0.00mi | 1/1.0 | 393 (-8%) | 10mo | $99,950 | $254 | 77 |
Match score weights: distance 35% · size 25% · config 20% · recency 20%. Top-matched comps best support the ARV.
Projected returns pro-forma
-3.0% appreciation · 1.74% rent growth · sell at horizon
- IRR
- 28.2%
- Equity multiple
- 2.16×
- Total profit
- $31,395
- Equity at exit
- $14,463
- IRR
- 34.9%
- Equity multiple
- 4.01×
- Total profit
- $81,865
- Equity at exit
- $8,387
Cash invested: $27,160 (down + closing). Projections, not guarantees.
Landlord ↔ Tenant lean methodology
- Overall (STATE)
- 18 Strongly Tenant-Friendly
- State California
- 18 Strongly Tenant-Friendly · D+13
- County
- — inherits STATE
- City
- — inherits STATE
ZIP-level market 94577
- Rents YoY
- 1.7%
- Active inventory
- 106
- Price-to-rent
- 4.4×
Monthly cashflow live
- Estimated rent
- $1,830 medium interval (Pro) →
- Mortgage (P&I)
- −$509
- Tax est. 1.5%
- −$121 /mo · $1,455/yr
- Insurance
- −$40
- HOA
- −$0
- Vacancy / Maint / Mgmt
- −$384
- Net cashflow
- $775
Break-even live
UW: 25.0% down · 7.5% · 30yr · 1.5% tax · 5.0% vac · 8.0% maint · 8.0% mgmt
Financing live
Cash to close
- Down payment
- $24,250
- Closing costs
- $2,910
- Reserves months
- —
- Total cash needed
- —
Loan-product check · same deal, 3 products live
Conventional
25% down · 7.5% · 30yr
- Down + closing
- —
- Monthly P&I
- —
- Monthly cashflow
- —
- DSCR
- —
- Eligible?
- —
Personal DTI + credit; lowest rate.
DSCR
20% down · 8.5% · 30yr
- Down + closing
- —
- Monthly P&I
- —
- Monthly cashflow
- —
- DSCR
- —
- Eligible?
- —
No personal income docs; deal must DSCR.
Hard money
10% down · 12.0% · 12mo
- Down + closing
- —
- Monthly P&I
- —
- Monthly cashflow
- —
- DSCR
- —
- Eligible?
- —
Short-term bridge; refi at stabilization.
Listing history 13 events
-
2026-06-18days on market $97,000 Active 20 DOM
-
2026-06-17days on market $97,000 Active 19 DOM
-
2026-06-16days on market $97,000 Active 18 DOM
-
2026-06-15days on market $97,000 Active 17 DOM
-
2026-06-13days on market $97,000 Active 15 DOM
-
2026-06-09days on market $97,000 Active 11 DOM
-
2026-06-08days on market $97,000 Active 10 DOM
-
2026-06-07days on market $97,000 Active 9 DOM
-
2026-06-04days on market $97,000 Active 6 DOM
-
2026-06-03days on market $97,000 Active 5 DOM
-
2026-06-02days on market $97,000 Active 4 DOM
-
2026-06-01days on market $97,000 Active 3 DOM
-
2026-05-31days on market $97,000 Active 2 DOM
ⓘ Source: listings_history table (triggers on properties + properties_extension) + one-shot
backfill from property_details.listing_events for pre-trigger history.
Climate risk First Street
- Flood 1/10 Low FEMA zone X (unshaded) · 0% chance over 30 yrs
- Wildfire 4/10 Moderate
- Heat 3/10 Moderate 7 d/yr ≥87°F today · 15 d/yr by 30 yrs out
- Wind 1/10 Low
- Air quality 7/10 Severe 12 unhealthy d/yr today · 12 by 30 yrs out
Nearby sold comps map
Loading sold comps map…
Walkable amenities ~0.75 mi
Loading nearby amenities…
Taxation est. · year 1
- Rental income
- $21,959
- − Mortgage interest
- −$5,434
- − Property taxes
- −$1,455
- − Insurance
- −$485
- − Repairs & maintenance
- −$1,757
- − Management
- −$1,757
- − Depreciation
- −$2,822
- Taxable income
- $8,250
- Est. tax owed @ 24.0%
- −$1,980
- After-tax cash flow
- $7,323/yr
For passive investors: Depreciation is non-cash, so a rental often shows a tax loss while cash-flowing — sheltering income. Rental losses are passive: they offset passive income freely, and up to $25,000/yr can offset ordinary (W-2) income if you actively participate and your MAGI is under $100k (phasing out to $0 by $150k); unused losses carry forward. On sale, claimed depreciation is recaptured at up to 25%, and gains may owe capital-gains tax (a 1031 exchange can defer both). Figures are a year-1 estimate at your 24.0% rate — not tax advice; consult a CPA.
Condition & rehab AI · 1 photo
This move-in ready manufactured home is in excellent condition with no visible repairs needed. It offers a great opportunity for low-maintenance living in a desirable park setting.
Value-add opportunities
- Both Painting exterior and interior walls — Enhances curb appeal and interior aesthetics
- Both Landscaping and curb appeal improvements — Improves curb appeal and enhances property value
- Both New flooring in kitchen and bathrooms — Enhances functionality and aesthetics
- Both New kitchen appliances — Modernizes the kitchen and enhances functionality
Renovation cost estimate screening
Value-add ROI direction
- Both Painting exterior and interior walls — Enhances curb appeal and interior aesthetics ↑
- Both Landscaping and curb appeal improvements — Improves curb appeal and enhances property value ↑
- Both New flooring in kitchen and bathrooms — Enhances functionality and aesthetics ↑
- Both New kitchen appliances — Modernizes the kitchen and enhances functionality ↑
ⓘ Cost ranges are severity-bucket heuristics (US national rule-of-thumb). Get contractor quotes + a written scope before underwriting a rehab budget.
Schools (NCES district)
- District
- San Leandro Unified
- NCES district ID
- 0634680
- Math proficiency
- 28% ▲ 3.00%
- Reading proficiency
- 42% ▲ 5.00%
- Median HH income
- $63,377
- Composite
- 34.23/100
- National rank
- #10252
- State rank
- #831 of 1400 in CA
Livability — San Leandro
- Score
- 68/100
- State rank
- #289
- US rank
- #9768
Category grades
Schools grade is shown separately in the Schools card above.
Census & demographics
- Census place
- San Leandro, CA
- County
- Alameda County · 1,614,355 people
- City population
- 88,086
- Metro
- San Francisco-Oakland-Berkeley, CA
- Population (ZIP)
- 46,317
- Household income
- $108,772
- Rent vs Own
- Severe rent burden
- 2005.0
Population outlook (Alameda County) Hauer SSP2
- Today (2025)
- 1,928,884 people
- By 2030
- 2,069,146 · +7.3%
- By 2040
- 2,338,405 · +21.2%
- By 2050
- 2,586,608 · +34.1%
- By 2075
- 3,061,911 · +58.7%
- By 2100
- 3,234,133 · +67.7%
Race, ethnicity, and origin ACS 2023
- Neighborhood character
- Highly diverse neighborhood (Simpson 0.76)
- Race & ethnicity
- Hispanic / Latino 31% Asian 28% White 23% Two or more races 14% Black 12% Native American 2% Pacific Islander 1%
- Hispanic origin (detail)
- Mexican 23%
- Common ancestry
- Russian 2% Italian 1% Lithuanian 1%
- Foreign-born
- 34% · Canada, China, Vietnam
- Languages at home
- 51% English-only · Spanish 23% Chinese 10% Tagalog/Filipino 7%
Political lean MEDSL · Alameda
- 2024 margin
- Solid D (+53.6) · D 74.6% · R 21.0% · Other 4.4%
- 2008→2024 swing
- -5.9pp toward R · 2008: 59.5pp · 2024: 53.6pp
- All cycles
- 2024: D+53.6 2020: D+62.5 2016: D+64.4 2012: D+59.8 2008: D+59.5
Not yet ingested
- Civics
- —
Market trends
- HPI YoY
- ▼ -867.55%
- Current HPI
- 265.2446
- Rent YoY
- ▲ 1.74%
- Metro
- San Francisco-Oakland-Berkeley, CA
- State GDP YoY
- ▲ 3.21%
- F500 in state
- 116
Industry mix (Fortune 500 HQ in CA)
| Industry | F500 HQs | Revenue |
|---|---|---|
| Technology | 27 | $1,492B |
|
||
| Financial Services | 3 | $174B |
|
||
| Retail | 3 | $44B |
|
||
| Insurance | 3 | $26B |
|
||
| Media / Entertainment | 2 | $115B |
|
||
| Pharmaceuticals / Biotech | 2 | $62B |
|
||
Cash-flow waterfall
monthlySold comps — $/sqft
last 12 mo · ≤1 miLoading sold comps…