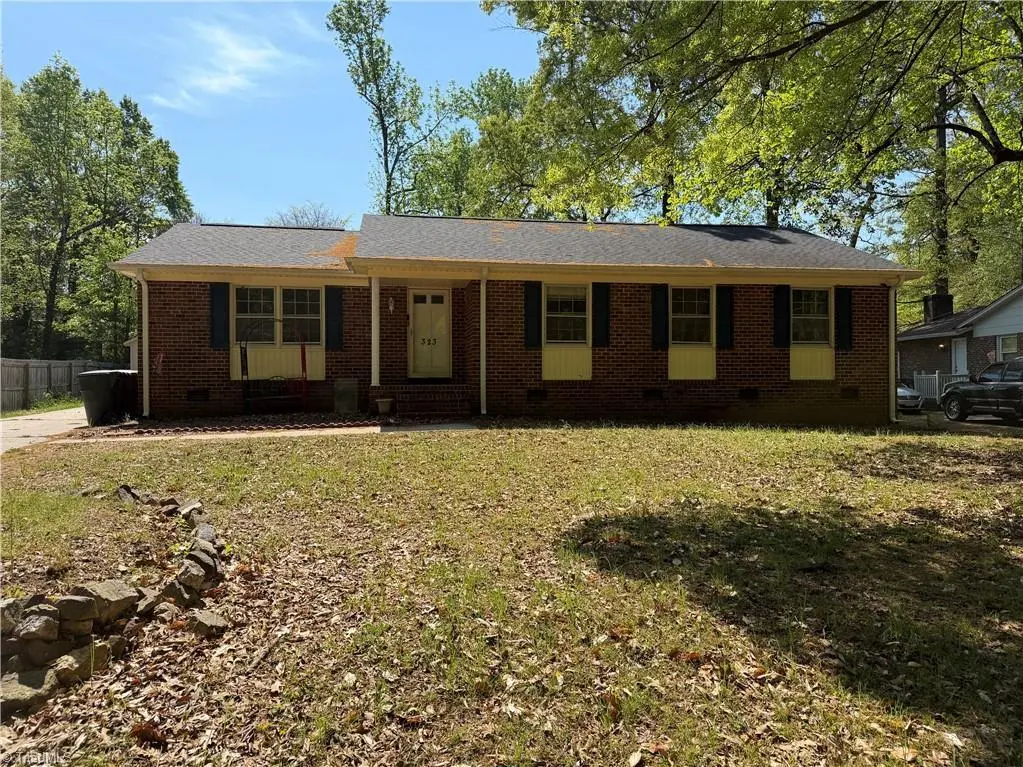
323 Largo Dr · Greensboro, NC
Flood risk 1/10 · Minimal
- FEMA flood zone
- X (unshaded)
- Chance of flooding over 30 yrs
- 0.0%
- Est. flood insurance / yr
- $507 – $1,088
Fire risk 1/10 · Minimal
- Est. fire insurance / yr
- $906 – $1,684
Heat risk 5/10 · Moderate
- Hot days now (above 103°F)
- 7 days/yr
- Hot days in 30 yrs
- 17 days/yr
Wind risk 5/10 · Moderate
- Chance of severe wind over 30 yrs
- 20.0%
Air-quality risk 2/10 · Minimal
- Unhealthy air days now
- 1 days/yr
- Unhealthy air days in 30 yrs
- 1 days/yr
Risk factors via First Street. Map © Google.
Why this score? — see what drove the D+ grade
The composite is a weighted blend of 9 inputs, each scored 0–100. Each bar is that input's sub-score; the figure is the points it added to the 100-point composite (weight × sub-score).
- ARV discount +14.1/15.0
- Cash flow +12.3/30.0
- Livability +4.0/5.0
- DSCR +3.7/10.0
- Schools +3.6/10.0
- 1% rule +3.1/10.0
- Rent growth +3.0/5.0
- Condition / age +2.5/5.0
- Appreciation +0.0/10.0
$225,000
🖨 Deal sheet 📄 Offer letter ✓ Due diligence
Listing remarks
Solid brick ranch in the Woodlea neighborhood featuring 4 bedrooms and 2 full baths, offering plenty of space and opportunity! The home boasts a spacious layout with a formal living room, dining room, den with generous living areas—ideal for everyday living and entertaining. Step outside to a fenced backyard and enjoy the added convenience of a one-car detached garage. Perfectly located with easy access to major highways, shopping, and restaurants. While the property will require updates, it presents an excellent opportunity to customize and add value. Being sold as-is, it is well-suited for renovation financing options such as an FHA 203(k) loan or similar programs.
Key facts
- Dining room
- Formal living room
- Shopping
Tags
Property features AI
Finance
- HOA & community: No association
Exterior
- Parking: Detached 1-car garage; Driveway parking
- Security: Dead bolt(s)
- Utilities: Public water; Public sewer; Gas water heater; Natural gas heating
- Home design: Residential stick/site-built house; One story; Built in 1966; Den with fireplace
- Construction: Brick construction
- Exterior features: City lot; Public maintained road
Interior
- Kitchen: Oven
- Bedrooms: Main level bedrooms (multiple rooms on main level)
- Flooring: Vinyl flooring; Wood flooring
- Bathrooms: 2 full bathrooms
- Heating & cooling: Central air conditioning; Forced air heating (natural gas)
- Interior features: Primary bedroom on main level; Dead bolt(s)
- Laundry & utility: Washer hookup; Dryer connection; Laundry on main level; Gas water heater
Neighborhood map
What this means for you Summary
Snapshot
- This is a 3-bed/2.0-bath single-family listed at $225k.
Deal economics
- At list price, monthly cash flow is $-40 ($-480/yr) — negative.
- To cash-flow at today's rent, offer at most $218k (3.1% below list).
- To meet the 1% rule (rent ≥ 1% of price), the offer needs to be $182k (19.1% below list).
- Recommended offer: $182k (19.1% below list) — sets the bar for 1% rule.
- Cap rate 6.1% vs local median 3.8% in Greensboro — top-decile yield for the area; either an underpriced asset or a hidden risk that comps aren't pricing in. Stress-test before assuming the spread holds.
Location & tenants
- Location reads 81/100 on livability (#12 in NC, #1,335 nationally) — a professional / high-income tenant draw. Strengths: amenities A+, commute A+, cost of living A+; Watch: employment D, crime F.
- Guilford County Schools (urban): math 39% / reading 45% proficiency, ranked #99 of 178 in NC (top 56%) — families likely to look elsewhere, expect single-tenant / working-renter base with shorter leases.
- Market conditions: Rents rising (+2.2%/yr); 261 active listings in the ZIP; 10 comparable units currently listed for rent nearby; rentals at typical pace (median 19d on market — plan ~3-4 weeks tenant-placement turnaround); 3,843 units permitted in Guilford County in 2024 (2,397 in 5+ unit buildings).
- This rent runs 37% of the median local income ($60k/yr) — at the standard rent-burdened threshold; future hikes will face affordability resistance.
Forward outlook
- Local home prices are declining (-3.0%/yr); year-one equity from $2k of loan paydown is wiped out by about $7k of value loss. Plan a longer hold.
- Guilford County population projected at +26% by 2050 — long-run rental-demand tailwind backs the buy-and-hold thesis.
Negotiation context
- It's been on market 58 days — a 3% lower offer ($218k) is reasonable based on typical stale-listing flexibility.
- Current owner paid $84k; list at $225k implies a 169% gain — meaningful room to come down on a strong offer.
Risks & watch-outs
- Climate carrying-cost: moderate wind risk, 20% chance of damaging wind over 30y; extreme-heat days projected 7→17/yr by 2055 (HVAC capex compounding) — expect insurance premiums to compound above CPI over the hold.
Questions for the listing agent
- What do current leases actually rent for vs. the listed asking? Can we see a recent rent roll and the last 12 months of T-12 income?
- It's been on market 58 days. Have you received any prior offers? Is the seller open to a 19% concession, seller financing, or rate buy-down credit?
- Built in 1966 — when were the roof, HVAC, electrical panel, plumbing, and water heater last replaced?
- Is there a deadline driving the sale (1031 exchange, divorce, estate, relocation)? That informs how much negotiation room exists.
- Crime grade is F in this area — have there been break-ins, vandalism, or insurance claims at this property in the last 3 years? What carrier currently insures it and at what premium?
- The area grade is low — what's the realistic commute time and amenity access for the typical tenant pool here? Any planned neighborhood developments (good or bad) we should know about?
- What's the average days-on-market for RENTAL listings here right now (not sales)? A rising rental-DOM trend means longer vacancies and softer asking-rent achievability than the comps imply.
- What's the recent tenant-quality profile in this submarket — average credit score on applications, eviction rate, late-payment / NSF rate, and stable-employment percentage? A property-management company in the area should have these aggregated.
- How much new for-sale + rental construction is in the pipeline within 1–3 miles? Heavy new supply typically softens prices + rents 12–24 months out; constrained supply supports both.
Investment metrics
- 1% rule
- 0.81% ✗
- Cap rate
- 6.08%
- Cash-on-cash
- -0.76%
- DSCR
- 0.97
- GRM
- 10.3
CMA / ARV
- ARV (on-the-fly)
- $264,000
- Comps found
- 12
Show comp detail 12 sales within ~0.75 mi
| Address | Dist | Beds/Ba | Sqft | Sold | Price | $/sf | Match |
|---|---|---|---|---|---|---|---|
| 411 W Montcastle Dr | 0.09mi | 3/2.0 | 1,620 (-8%) | 2mo | $287,500 | $177 | 81 |
| 316 W Montcastle Dr | 0.04mi | 3/1.5 | 1,600 (-9%) | 6mo | $159,225 | $100 | 76 |
| 305 Apple Ridge Rd | 0.21mi | 3/2.5 | 1,720 (-2%) | 10mo | $272,500 | $158 | 76 |
| 3319 Woodlea Dr | 0.23mi | 3/1.5 | 1,866 (+6%) | 2mo | $226,000 | $121 | 75 |
| 204 Glenview Dr | 0.37mi | 3/2.0 | 1,768 (+0%) | 14mo | $225,000 | $127 | 70 |
| 3305 Woodlea Dr | 0.29mi | 3/2.0 | 1,552 (-12%) | 6mo | $250,000 | $161 | 62 |
| 320 Apple Ridge Rd | 0.27mi | 3/3.0 | 1,621 (-8%) | 12mo | $238,000 | $147 | 60 |
| 3910 Red Chief St | 0.73mi | 3/2.0 | 1,728 (-2%) | 7mo | $258,000 | $149 | 57 |
| 3 Brook Pine Cir | 0.51mi | 4/2.5 (+1) | 1,887 (+7%) | 8mo | $275,000 | $146 | 51 |
| 417 Woodlake Dr | 0.72mi | 4/2.0 (+1) | 1,696 (-4%) | 7mo | $259,000 | $153 | 50 |
| 6 Woodclub Ct | 0.65mi | 3/2.0 | 1,587 (-10%) | 11mo | $240,000 | $151 | 44 |
| 410 Woodlake Dr | 0.68mi | 3/2.0 | 1,567 (-11%) | 14mo | $235,000 | $150 | 39 |
Match score weights: distance 35% · size 25% · config 20% · recency 20%. Top-matched comps best support the ARV.
Projected returns pro-forma
-3.0% appreciation · 2.18% rent growth · sell at horizon
- IRR
- -18.4%
- Equity multiple
- 0.36×
- Total profit
- $-40,516
- Equity at exit
- $33,548
- IRR
- -12.4%
- Equity multiple
- 0.29×
- Total profit
- $-44,654
- Equity at exit
- $19,454
Cash invested: $63,000 (down + closing). Projections, not guarantees.
Landlord ↔ Tenant lean methodology
- Overall (STATE)
- 85 Strongly Landlord-Friendly
- State North Carolina
- 85 Strongly Landlord-Friendly · R+3
- County
- — inherits STATE
- City
- — inherits STATE
ZIP-level market 27406
- Rents YoY
- 2.2%
- Active inventory
- 261
- Price-to-rent
- 10.3×
Monthly cashflow live
- Estimated rent
- $1,821 high interval (Pro) →
- Mortgage (P&I)
- −$1,180
- Tax from tax record
- −$205 /mo · $2,456/yr
- Insurance
- −$94
- HOA
- −$0
- Vacancy / Maint / Mgmt
- −$382
- Net cashflow
- $-40
Break-even live
UW: 25.0% down · 7.5% · 30yr · 1.5% tax · 5.0% vac · 8.0% maint · 8.0% mgmt
Financing live
Cash to close
- Down payment
- $56,250
- Closing costs
- $6,750
- Reserves months
- —
- Total cash needed
- —
Loan-product check · same deal, 3 products live
Conventional
25% down · 7.5% · 30yr
- Down + closing
- —
- Monthly P&I
- —
- Monthly cashflow
- —
- DSCR
- —
- Eligible?
- —
Personal DTI + credit; lowest rate.
DSCR
20% down · 8.5% · 30yr
- Down + closing
- —
- Monthly P&I
- —
- Monthly cashflow
- —
- DSCR
- —
- Eligible?
- —
No personal income docs; deal must DSCR.
Hard money
10% down · 12.0% · 12mo
- Down + closing
- —
- Monthly P&I
- —
- Monthly cashflow
- —
- DSCR
- —
- Eligible?
- —
Short-term bridge; refi at stabilization.
Rent comps 10 comps
| Address | Beds | Baths | Sqft | Rent | $/sqft | DOM | Units | Dist |
|---|---|---|---|---|---|---|---|---|
| 2807 Green Crest Ct Greensboro, NC | 3.0 | 2.0 | 1392 | $1,899 | $1.36 | 23d | 1 | 0.19mi |
| 8 Covey Ln Greensboro, NC | 1.0–3.0 | 1.0–2.0 | 927 | $1,350 | $1.46 | 14d | 10 | 0.25mi |
| 3222 S Elm Eugene St Greensboro, NC | 3.0 | 2.0 | 1708 | $1,750 | $1.02 | 23d | 1 | 0.42mi |
| 206 Lasalle Way Greensboro, NC | 3.0 | 2.5 | 1753 | $1,945 | $1.11 | 19d | 1 | 0.72mi |
| 506 Rocky Knoll Rd Greensboro, NC | 4.0 | 2.0 | 1676 | $1,595 | $0.95 | 14d | 1 | 0.74mi |
| 305 Humble Rd Unit 1391421P Greensboro, NC | 4.0 | 3.0 | 2098 | $3,134 | $1.49 | 14d | 1 | 0.82mi |
| 911 Tipperary Dr Greensboro, NC | 4.0 | 3.0 | 2200 | $1,750 | $0.80 | 19d | 1 | 0.93mi |
| 20 Windale Ct Greensboro, NC | 3.0 | 2.5 | 1558 | $1,925 | $1.24 | 21d | 1 | 0.96mi |
| 402 Triumphant Rd Greensboro, NC | 4.0 | 3.0 | 1791 | $2,200 | $1.23 | 14d | 1 | 1.00mi |
| 816 Nestleway Dr Greensboro, NC | 3.0 | 2.5 | 1584 | $2,050 | $1.29 | 19d | 1 | 1.09mi |
Listing history 17 events
-
2026-06-18days on market $225,000 Active 58 DOM
-
2026-06-17days on market $225,000 Active 57 DOM
-
2026-06-16days on market $225,000 Active 56 DOM
-
2026-06-15days on market $225,000 Active 55 DOM
-
2026-06-14days on market $225,000 Active 53 DOM
-
2026-06-10days on market $225,000 Active 50 DOM
-
2026-06-09days on market $225,000 Active 49 DOM
-
2026-06-08days on market $225,000 Active 48 DOM
-
2026-06-07days on market $225,000 Active 47 DOM
-
2026-06-03days on market $225,000 Active 43 DOM
-
2026-06-02days on market $225,000 Active 42 DOM
-
2026-06-01days on market $225,000 Active 41 DOM
-
2026-05-31days on market $225,000 Active 40 DOM
-
2026-05-31days on market $225,000 Active 39 DOM
-
2026-04-21$225,000 Active
-
1989-02-01soldstatus $83,700
-
1985-10-01soldstatus $75,500
ⓘ Source: listings_history table (triggers on properties + properties_extension) + one-shot
backfill from property_details.listing_events for pre-trigger history.
Tax reassessment forecast NC · Resets to sale price
- Current annual tax
- $2,456 · $205/mo
- Projected year-2 tax
- $2,456 · $205/mo
- Expected delta
- $0/yr ($0/mo · 0.0%)
ⓘ Screening estimate from a state-policy table — verify with the county assessor before closing.
Climate risk First Street
- Flood 1/10 Low FEMA zone X (unshaded) · 0% chance over 30 yrs
- Wildfire 1/10 Low
- Heat 5/10 Major 7 d/yr ≥103°F today · 17 d/yr by 30 yrs out
- Wind 5/10 Major 20% chance of damaging wind over 30 yrs
- Air quality 2/10 Low 1 unhealthy d/yr today · 1 by 30 yrs out
Nearby sold comps map
Loading sold comps map…
Walkable amenities ~0.75 mi
Loading nearby amenities…
Taxation est. · year 1
- Rental income
- $21,848
- − Mortgage interest
- −$12,603
- − Property taxes
- −$2,456
- − Insurance
- −$1,125
- − Repairs & maintenance
- −$1,748
- − Management
- −$1,748
- − Depreciation
- −$6,545
- Taxable loss
- −$4,377
- Est. tax savings @ 24.0%
- +$1,051
- After-tax cash flow
- $571/yr
For passive investors: Depreciation is non-cash, so a rental often shows a tax loss while cash-flowing — sheltering income. Rental losses are passive: they offset passive income freely, and up to $25,000/yr can offset ordinary (W-2) income if you actively participate and your MAGI is under $100k (phasing out to $0 by $150k); unused losses carry forward. On sale, claimed depreciation is recaptured at up to 25%, and gains may owe capital-gains tax (a 1031 exchange can defer both). Figures are a year-1 estimate at your 24.0% rate — not tax advice; consult a CPA.
Schools (NCES district)
- District
- Guilford County Schools
- NCES district ID
- 3701920
- Math proficiency
- 39% ▲ 1.00%
- Reading proficiency
- 45% ▲ 1.00%
- Median HH income
- $46,315
- Composite
- 35.78/100
- National rank
- #4842
- State rank
- #99 of 178 in NC
Livability — Greensboro
- Score
- 81/100
- State rank
- #12
- US rank
- #1335
Category grades
Schools grade is shown separately in the Schools card above.
Census & demographics
- Census place
- Greensboro, NC
- County
- Guilford County · 487,190 people
- City population
- 329,421
- Metro
- Greensboro-High Point, NC
- Population (ZIP)
- 60,651
- Household income
- $59,563
- Rent vs Own
- Severe rent burden
- 2462.0
Population outlook (Guilford County) Hauer SSP2
- Today (2025)
- 584,596 people
- By 2030
- 616,851 · +5.5%
- By 2040
- 678,451 · +16.1%
- By 2050
- 734,788 · +25.7%
- By 2075
- 862,985 · +47.6%
- By 2100
- 948,704 · +62.3%
Race, ethnicity, and origin ACS 2023
- Neighborhood character
- Diverse neighborhood (Simpson 0.64)
- Race & ethnicity
- Black 52% White 26% Hispanic / Latino 13% Two or more races 10% Asian 2%
- Hispanic origin (detail)
- Mexican 7% Puerto Rican 2%
- Common ancestry
- Italian 1% Serbian 1% Lithuanian 1%
- Foreign-born
- 10% · Canada, Vietnam, United Kingdom
- Languages at home
- 83% English-only · Spanish 11% Vietnamese 1% Other Asian/Pacific 1%
Political lean MEDSL · Guilford
- 2024 margin
- Strong D (+21.8) · D 60.2% · R 38.4% · Other 1.4%
- 2008→2024 swing
- +3.5pp toward D · 2008: 18.4pp · 2024: 21.8pp
- All cycles
- 2024: D+21.8 2020: D+23.1 2016: D+20.0 2012: D+16.5 2008: D+18.4
Not yet ingested
- Civics
- —
Market trends
- HPI YoY
- ▼ -146.70%
- Current HPI
- 243.2612
- Rent YoY
- ▲ 2.18%
- Metro
- Greensboro-High Point, NC
- State GDP YoY
- ▲ 3.28%
- F500 in state
- 26
Industry mix (Fortune 500 HQ in NC)
| Industry | F500 HQs | Revenue |
|---|---|---|
| Financial Services | 2 | $213B |
|
||
| Retail | 2 | $95B |
|
||
| Industrial Conglomerate | 1 | $38B |
|
||
| Metals / Steel | 1 | $35B |
|
||
| Utilities | 1 | $30B |
|
||
| Industrial Machinery | 1 | $19B |
|
||
Price history
+198.0% since first listed3 events — show timeline
- 2026-04-21 Listed $225,000 Triad MLS
- 1989-02-01 Sold (Public Records) $83,700 Public Records
- 1985-10-01 Sold (Public Records) $75,500 Public Records
Property tax history
+4.3%/yrLatest (2025): $2,456 · -1.0% YoY. Source: county tax records.
Cash-flow waterfall
monthlySold comps — $/sqft
last 12 mo · ≤1 miLoading sold comps…