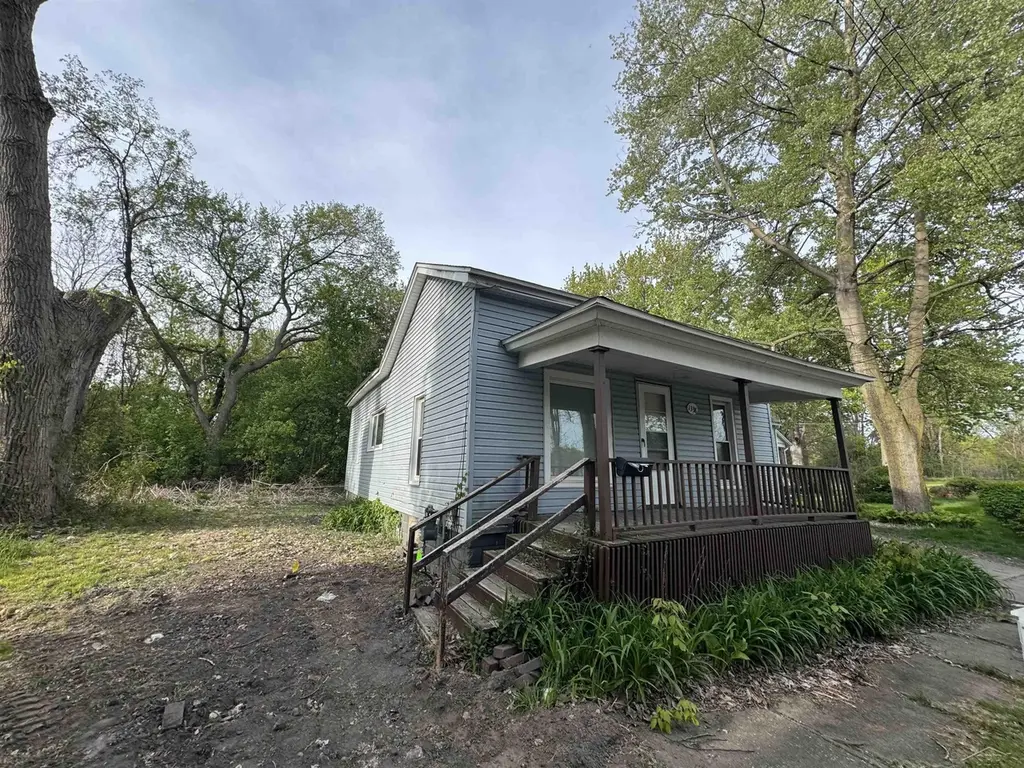
1338 Sears St · Saginaw, MI
Flood risk 6/10 · Moderate
- FEMA flood zone
- X (shaded)
- Chance of flooding over 30 yrs
- 0.67%
- Est. flood insurance / yr
- $507 – $1,088
Fire risk 1/10 · Minimal
- Est. fire insurance / yr
- $784 – $1,456
Heat risk 2/10 · Minimal
- Hot days now (above 100°F)
- 7 days/yr
- Hot days in 30 yrs
- 14 days/yr
Wind risk 1/10 · Minimal
- Chance of severe wind over 30 yrs
- —
Air-quality risk 2/10 · Minimal
- Unhealthy air days now
- 1 days/yr
- Unhealthy air days in 30 yrs
- 2 days/yr
Risk factors via First Street. Map © Google.
Why this score? — see what drove the B+ grade
The composite is a weighted blend of 9 inputs, each scored 0–100. Each bar is that input's sub-score; the figure is the points it added to the 100-point composite (weight × sub-score).
- Cash flow +30.0/30.0
- ARV discount +15.0/15.0
- 1% rule +10.0/10.0
- DSCR +10.0/10.0
- Livability +3.2/5.0
- Rent growth +2.5/5.0
- Condition / age +2.5/5.0
- Schools +2.0/10.0
- Appreciation +0.0/10.0
$39,900
🖨 Deal sheet 📄 Offer letter ✓ Due diligence
Listing remarks MLS
Move-in ready and full of updates! This 3 bedroom, 1 bath home features updated windows, flooring, paint, bathroom, and siding, giving the home a fresh modern feel throughout. Spacious layout with plenty of potential for a homeowner or investor alike. Call today for your personal showing.
Key facts
- Updated siding
- Updated windows
- Updated paint
Tags
Property features AI
Finance
- Other: No additional financial amenities provided
- Financial info: No investor or income/expense details provided
- HOA & community: Homeowners association present
Exterior
- Parking: No parking details provided
- Security: No security features provided
- Utilities: Public water; Public sewer available; Sewer available
- Home design: Single-family residence; One story
- Construction: Vinyl siding
- Exterior features: Paved road access; Lot zoned for residential use; Lot dimensions approximately 49 x 61; Lot size about 0.6 acres
Interior
- Kitchen: No kitchen appliance list provided
- Bedrooms: Total of 4 rooms (includes bedrooms and living spaces)
- Flooring: No flooring information provided
- Bathrooms: 1 full bathroom
- Heating & cooling: Forced air heating; Natural gas heating; No cooling
- Interior features: Gas water heater; Crawl space basement
- Laundry & utility: No laundry or utility appliances listed
Neighborhood map
What this means for you Summary
Snapshot
- This is a 3-bed/1.0-bath single-family listed at $40k.
Deal economics
- At list price, monthly cash flow is $681 ($8k/yr) — positive.
- The deal already cash-flows at list — no discount required.
- Meets the 1% rule at list price ($1k rent vs $40k).
- Recommended offer: $39k (3.0% below list) — sets the bar for market timing.
- Cap rate 26.8% vs local median 8.3% in Saginaw — top-decile yield for the area; either an underpriced asset or a hidden risk that comps aren't pricing in. Stress-test before assuming the spread holds.
Location & tenants
- Location reads 63/100 on livability (#521 in MI) — a middle-class / working-renter tenant base. Strengths: cost of living A+, housing A+, health & safety A+; Watch: schools F, crime F, amenities F.
- Saginaw School District (urban): math 20% / reading 29% proficiency, ranked #444 of 540 in MI (top 82%) — low school quality limits family demand, transient renter base, plan for 1-2y turnover; 76% free/reduced lunch — lower-income household profile, screen leases tightly.
- Market conditions: 199 active listings in the ZIP; 154 units permitted in Saginaw County in 2024 (0 in 5+ unit buildings).
Forward outlook
- Local home prices are declining (-3.0%/yr); year-one equity from $276 of loan paydown is wiped out by about $1k of value loss. Plan a longer hold.
- Saginaw County population projected at -25% by 2050 — secular population decline; favor cash flow + early exit over multi-decade hold.
- At projected returns (-3.0% appreciation + 3.0% rent growth), your $11k cash investment doubles in ~2 years — after that, you're playing with house money.
Negotiation context
- It's been on market 38 days — a 3% lower offer ($39k) is reasonable based on typical stale-listing flexibility.
- 6 sale attempts since 15y ago; this cycle's ask has dropped $5k (11%) from the opening price — seller is motivated, your offer sets the floor, not the list.
- Current owner paid $3k; list at $40k implies a 1230% gain — meaningful room to come down on a strong offer.
Risks & watch-outs
- Watch-outs: built in 1884 — expect roof / HVAC / electrical / plumbing capex.
- Climate carrying-cost: major flood risk — expect insurance premiums to compound above CPI over the hold.
Questions for the listing agent
- It's been on market 38 days. Have you received any prior offers? Is the seller open to a 3% concession, seller financing, or rate buy-down credit?
- Built in 1884 — when were the roof, HVAC, electrical panel, plumbing, and water heater last replaced?
- Is there a deadline driving the sale (1031 exchange, divorce, estate, relocation)? That informs how much negotiation room exists.
- Schools are F-rated, which usually means shorter tenancies and higher turnover. Who's the typical renter profile here, and what's been the actual vacancy rate?
- Crime grade is F in this area — have there been break-ins, vandalism, or insurance claims at this property in the last 3 years? What carrier currently insures it and at what premium?
- What's the average days-on-market for RENTAL listings here right now (not sales)? A rising rental-DOM trend means longer vacancies and softer asking-rent achievability than the comps imply.
- What's the recent tenant-quality profile in this submarket — average credit score on applications, eviction rate, late-payment / NSF rate, and stable-employment percentage? A property-management company in the area should have these aggregated.
- How much new for-sale + rental construction is in the pipeline within 1–3 miles? Heavy new supply typically softens prices + rents 12–24 months out; constrained supply supports both.
Investment metrics
- 1% rule
- 2.96% ✓
- Cap rate
- 26.77%
- Cash-on-cash
- 73.12%
- DSCR
- 4.25
- GRM
- 2.8
CMA / ARV
- ARV (on-the-fly)
- $69,000
- Comps found
- 4
Show comp detail 4 sales within ~0.75 mi
| Address | Dist | Beds/Ba | Sqft | Sold | Price | $/sf | Match |
|---|---|---|---|---|---|---|---|
| 996 Athens Rd | 0.73mi | 3/1.0 | 936 (+2%) | 2mo | $70,000 | $75 | 61 |
| 514 N 8th St | 0.28mi | 3/1.0 | 1,058 (+15%) | 8mo | $17,000 | $16 | 55 |
| 2422 Snelling Pl | 0.74mi | 3/1.0 | 988 (+7%) | 1mo | $97,084 | $98 | 52 |
| 228 N 3rd Ave | 0.53mi | 2/1.0 (-1) | 1,022 (+11%) | 3mo | $47,500 | $46 | 49 |
Match score weights: distance 35% · size 25% · config 20% · recency 20%. Top-matched comps best support the ARV.
Projected returns pro-forma
-3.0% appreciation · 3.0% rent growth · sell at horizon
- IRR
- 72.9%
- Equity multiple
- 4.30×
- Total profit
- $36,893
- Equity at exit
- $5,949
- IRR
- 76.7%
- Equity multiple
- 8.87×
- Total profit
- $87,965
- Equity at exit
- $3,450
Cash invested: $11,172 (down + closing). Projections, not guarantees.
Landlord ↔ Tenant lean methodology
- Overall (STATE)
- 62 Landlord-Friendly
- State Michigan
- 62 Landlord-Friendly · EVEN
- County
- — inherits STATE
- City
- — inherits STATE
ZIP-level market 48601
- Home prices YoY
- -32.1%
- Active inventory
- 199
- Price-to-rent
- 2.8×
Monthly cashflow live
- Estimated rent
- $1,181 medium interval (Pro) →
- Mortgage (P&I)
- −$209
- Tax from tax record
- −$26 /mo · $318/yr
- Insurance
- −$17
- HOA
- −$0
- Vacancy / Maint / Mgmt
- −$248
- Net cashflow
- $681
Break-even live
UW: 25.0% down · 7.5% · 30yr · 1.5% tax · 5.0% vac · 8.0% maint · 8.0% mgmt
Financing live
Cash to close
- Down payment
- $9,975
- Closing costs
- $1,197
- Reserves months
- —
- Total cash needed
- —
Loan-product check · same deal, 3 products live
Conventional
25% down · 7.5% · 30yr
- Down + closing
- —
- Monthly P&I
- —
- Monthly cashflow
- —
- DSCR
- —
- Eligible?
- —
Personal DTI + credit; lowest rate.
DSCR
20% down · 8.5% · 30yr
- Down + closing
- —
- Monthly P&I
- —
- Monthly cashflow
- —
- DSCR
- —
- Eligible?
- —
No personal income docs; deal must DSCR.
Hard money
10% down · 12.0% · 12mo
- Down + closing
- —
- Monthly P&I
- —
- Monthly cashflow
- —
- DSCR
- —
- Eligible?
- —
Short-term bridge; refi at stabilization.
Listing history 27 events
-
2026-06-19days on market $39,900 Active 38 DOM
-
2026-06-18pricedays on market $39,900 Active 37 DOM
-
2026-06-17days on market $44,900 Active 36 DOM
-
2026-06-16days on market $44,900 Active 35 DOM
-
2026-06-15days on market $44,900 Active 34 DOM
-
2026-06-14days on market $44,900 Active 32 DOM
-
2026-06-12days on market $44,900 Active 31 DOM
-
2026-06-09days on market $44,900 Active 28 DOM
-
2026-06-08days on market $44,900 Active 27 DOM
-
2026-06-07days on market $44,900 Active 26 DOM
-
2026-06-05days on market $44,900 Active 23 DOM
-
2026-06-03days on market $44,900 Active 22 DOM
-
2026-06-02days on market $44,900 Active 21 DOM
-
2026-06-01days on market $44,900 Active 20 DOM
-
2026-05-31days on market $44,900 Active 19 DOM
-
2026-05-30days on market $44,900 Active 18 DOM
-
2026-05-12$44,900 Active 289-char remark
Show marketing remark (289 chars)
Move-in ready and full of updates! This 3 bedroom, 1 bath home features updated windows, flooring, paint, bathroom, and siding, giving the home a fresh modern feel throughout. Spacious layout with plenty of potential for a homeowner or investor alike. Call today for your personal showing.
-
2026-05-12$44,900 Active
Show marketing remark (289 chars)
Move-in ready and full of updates! This 3 bedroom, 1 bath home features updated windows, flooring, paint, bathroom, and siding, giving the home a fresh modern feel throughout. Spacious layout with plenty of potential for a homeowner or investor alike. Call today for your personal showing.
-
2024-04-10historical $850
-
2024-01-18$850
-
2024-01-01historical $850
-
2023-10-21$850
-
2012-01-13historical 188-char remark
Show marketing remark (188 chars)
This is a Homepath Property and Available for Homepath Renovation Mortgage Financing. Three Bedroom Bungalow, Close To Downtown Services and Transportation. Large Living Room, Vinyl Siding
-
2011-11-21$3,500 188-char remark
Show marketing remark (188 chars)
This is a Homepath Property and Available for Homepath Renovation Mortgage Financing. Three Bedroom Bungalow, Close To Downtown Services and Transportation. Large Living Room, Vinyl Siding
-
2011-11-21$3,500
Show marketing remark (188 chars)
This is a Homepath Property and Available for Homepath Renovation Mortgage Financing. Three Bedroom Bungalow, Close To Downtown Services and Transportation. Large Living Room, Vinyl Siding
-
2011-01-12soldstatus $3,000 188-char remark
Show marketing remark (188 chars)
This is a Homepath Property and Available for Homepath Renovation Mortgage Financing. Three Bedroom Bungalow, Close To Downtown Services and Transportation. Large Living Room, Vinyl Siding
-
2011-01-12soldstatus $3,000
Show marketing remark (188 chars)
This is a Homepath Property and Available for Homepath Renovation Mortgage Financing. Three Bedroom Bungalow, Close To Downtown Services and Transportation. Large Living Room, Vinyl Siding
ⓘ Source: listings_history table (triggers on properties + properties_extension) + one-shot
backfill from property_details.listing_events for pre-trigger history.
Tax reassessment forecast MI · Partial reset (capped growth)
- Current annual tax
- $318 · $26/mo
- Projected year-2 tax
- $466 · $39/mo
- Expected delta
- +$148/yr (+$12/mo · 46.7%)
ⓘ Screening estimate from a state-policy table — verify with the county assessor before closing.
Climate risk First Street
- Flood 6/10 Major FEMA zone X (shaded) · 67% chance over 30 yrs
- Wildfire 1/10 Low
- Heat 2/10 Low 7 d/yr ≥100°F today · 14 d/yr by 30 yrs out
- Wind 1/10 Low
- Air quality 2/10 Low 1 unhealthy d/yr today · 2 by 30 yrs out
Nearby sold comps map
Loading sold comps map…
Walkable amenities ~0.75 mi
Loading nearby amenities…
Taxation est. · year 1
- Rental income
- $14,173
- − Mortgage interest
- −$2,235
- − Property taxes
- −$318
- − Insurance
- −$200
- − Repairs & maintenance
- −$1,134
- − Management
- −$1,134
- − Depreciation
- −$1,161
- Taxable income
- $7,992
- Est. tax owed @ 24.0%
- −$1,918
- After-tax cash flow
- $6,250/yr
For passive investors: Depreciation is non-cash, so a rental often shows a tax loss while cash-flowing — sheltering income. Rental losses are passive: they offset passive income freely, and up to $25,000/yr can offset ordinary (W-2) income if you actively participate and your MAGI is under $100k (phasing out to $0 by $150k); unused losses carry forward. On sale, claimed depreciation is recaptured at up to 25%, and gains may owe capital-gains tax (a 1031 exchange can defer both). Figures are a year-1 estimate at your 24.0% rate — not tax advice; consult a CPA.
Schools (NCES district)
- District
- Saginaw School District
- NCES district ID
- 2630390
- Math proficiency
- 20% ▼ -5.00%
- Reading proficiency
- 29% ▼ -3.00%
- Median HH income
- $28,940
- Composite
- 19.6/100
- National rank
- #8755
- State rank
- #444 of 540 in MI
Livability — Saginaw
- Score
- 63/100
- State rank
- #521
- US rank
- #15424
Category grades
Schools grade is shown separately in the Schools card above.
Census & demographics
- Census place
- Saginaw, MI
- City population
- 54,884
- Population (ZIP)
- 32,069
Population outlook (Saginaw County) Hauer SSP2
- Today (2025)
- 180,568 people
- By 2030
- 172,302 · -4.6%
- By 2040
- 153,919 · -14.8%
- By 2050
- 135,519 · -24.9%
- By 2075
- 97,199 · -46.2%
- By 2100
- 65,037 · -64.0%
Race, ethnicity, and origin ACS 2023
- Neighborhood character
- Diverse neighborhood (Simpson 0.56)
- Race & ethnicity
- Black 59% White 27% Hispanic / Latino 12% Two or more races 5%
- Hispanic origin (detail)
- Mexican 10%
- Common ancestry
- Romanian 2% Lithuanian 2%
- Foreign-born
- 1% · Canada
- Languages at home
- 96% English-only · Spanish 4%
Political lean MEDSL · Saginaw
- 2024 margin
- Toss-up / Even · D 47.7% · R 51.0% · Other 1.4%
- 2008→2024 swing
- -20.6pp toward R · 2008: 17.3pp · 2024: -3.3pp
- All cycles
- 2024: R+3.3 2020: D+0.3 2016: R+1.1 2012: D+11.9 2008: D+17.3
Not yet ingested
- Civics
- —
Market trends
- HPI YoY
- ▼ -93.46%
- Current HPI
- 197.3359
- Rent YoY
- —
- Metro
- —
- State GDP YoY
- ▲ 1.37%
- F500 in state
- 28
Industry mix (Fortune 500 HQ in MI)
| Industry | F500 HQs | Revenue |
|---|---|---|
| Automotive Parts | 3 | $48B |
|
||
| Automotive | 2 | $372B |
|
||
| Chemicals | 1 | $45B |
|
||
| Automotive Retail | 1 | $29B |
|
||
| Healthcare / Medical Devices | 1 | $23B |
|
||
| Automotive Technology | 1 | $20B |
|
||
Price history
+1396.7% since first listed11 events — show timeline
- 2026-05-12 Listed $44,900 REALCOMP
- 2026-05-12 Listed $44,900 MiRealSource-MiMLS
- 2024-04-10 Rental Removed $850 APPFOLIO
- 2024-01-18 Listed for Rent $850 APPFOLIO
- 2024-01-01 Rental Removed $850 APPFOLIO
- 2023-10-21 Listed for Rent $850 APPFOLIO
- 2012-01-13 Listing Removed — MiRealSource-MiMLS
- 2011-11-21 Listed $3,500 REALCOMP
- 2011-11-21 Listed $3,500 MiRealSource-MiMLS
- 2011-01-12 Sold (MLS) $3,000 REALCOMP
- 2011-01-12 Sold (MLS) $3,000 MiRealSource-MiMLS
Property tax history
-1.5%/yrLatest (2025): $318 · -56.2% YoY. Source: county tax records.
Cash-flow waterfall
monthlySold comps — $/sqft
last 12 mo · ≤1 miLoading sold comps…