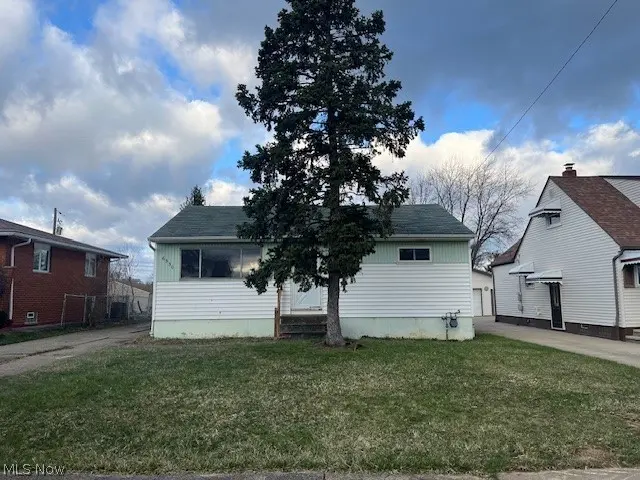
6330 Stonecrest Dr · Brook Park, OH
Flood risk 1/10 · Minimal
- FEMA flood zone
- X (unshaded)
- Chance of flooding over 30 yrs
- 0.0%
- Est. flood insurance / yr
- $473 – $860
Fire risk 1/10 · Minimal
- Est. fire insurance / yr
- $713 – $1,323
Heat risk 3/10 · Minor
- Hot days now (above 96°F)
- 7 days/yr
- Hot days in 30 yrs
- 16 days/yr
Wind risk 1/10 · Minimal
- Chance of severe wind over 30 yrs
- —
Air-quality risk 2/10 · Minimal
- Unhealthy air days now
- 1 days/yr
- Unhealthy air days in 30 yrs
- 3 days/yr
Risk factors via First Street. Map © Google.
Why this score? — see what drove the B- grade
The composite is a weighted blend of 9 inputs, each scored 0–100. Each bar is that input's sub-score; the figure is the points it added to the 100-point composite (weight × sub-score).
- Cash flow +25.4/30.0
- ARV discount +15.0/15.0
- DSCR +8.4/10.0
- 1% rule +7.2/10.0
- Schools +4.4/10.0
- Livability +3.7/5.0
- Rent growth +2.5/5.0
- Condition / age +2.5/5.0
- Appreciation +0.0/10.0
$149,900
🖨 Deal sheet (PDF) 📄 Offer letter ✓ Due diligence
Listing remarks
Opportunity awaits for this 3 bedrooms 2 bath ranch in Brook Park. Bring your decorating skills. Home has much potential with some elbow grease. One bedroom wall was partially removed to make a dining room- can easily be reinstalled. Home offer large living room with hard wood floors. All 3 bedrooms have hard wood flooring. Kitchen is a good size with vinyl flooring. Outside there is plenty of room with the 2 car garage and an additional 1 car port. Come see it while it lasts.
Key facts
- 6,599 sq ft lot
- 2 garage spots
- Built 1961
Neighborhood map
What this means for you Summary
Snapshot
- This is a 3-bed/1.5-bath single-family listed at $150k.
Deal economics
- At list price, monthly cash flow is $345 ($4k/yr) — positive.
- The deal already cash-flows at list — no discount required.
- Meets the 1% rule at list price ($2k rent vs $150k).
- Cap rate 9.1% vs local median 5.2% in Brook Park — top-decile yield for the area; either an underpriced asset or a hidden risk that comps aren't pricing in. Stress-test before assuming the spread holds.
Location & tenants
- Location reads 74/100 on livability (#273 in OH, #4,475 nationally) — a middle-class / working-renter tenant base. Strengths: crime A+, cost of living A+, housing A+; Watch: employment D+, health & safety D, amenities F.
- Berea City (suburban): math 47% / reading 56% proficiency, ranked #414 of 656 in OH (top 63%) — acceptable for families but not a draw, mixed tenant base, ~2y average lease.
- Zoned schools: Brook Park Elementary School (math 69% / reading 59%, grade B, #564 of 1,584 statewide, top 36%, 947 students, 36% FRL); Berea-Midpark Middle School (math 43% / reading 52%, grade C-, #444 of 654 statewide, top 69%, 1,556 students, 0% FRL); Berea-Midpark High School (math 28% / reading 60%, grade F, #489 of 781 statewide, top 63%, 1,850 students, 29% FRL) — zoned schools at 22% FRL track the district average.
- Market conditions: 44 active listings in the ZIP; 2 comparable units currently listed for rent nearby; 1,441 units permitted in Cuyahoga County in 2024 (700 in 5+ unit buildings).
- This rent runs 31% of the median local income ($71k/yr) — at the standard rent-burdened threshold; future hikes will face affordability resistance.
Forward outlook
- Local home prices are declining (-3.0%/yr); year-one equity from $1k of loan paydown is wiped out by about $4k of value loss. Plan a longer hold.
- Cuyahoga County population projected to shrink 8% by 2050 — rents likely to lag national; underwrite the cash flow, not the appreciation.
Negotiation context
- Only 9 days on market — expect competitive offers; lowballing is unlikely to land.
Questions for the listing agent
- Built in 1961 — when were the roof, HVAC, electrical panel, plumbing, and water heater last replaced?
- Is there a deadline driving the sale (1031 exchange, divorce, estate, relocation)? That informs how much negotiation room exists.
- Schools are B-rated — typically a magnet for longer-tenancy family renters. What's the average tenant stay here, and is there a school-zone premium baked into asking?
- What's the average days-on-market for RENTAL listings here right now (not sales)? A rising rental-DOM trend means longer vacancies and softer asking-rent achievability than the comps imply.
- What's the recent tenant-quality profile in this submarket — average credit score on applications, eviction rate, late-payment / NSF rate, and stable-employment percentage? A property-management company in the area should have these aggregated.
- How much new for-sale + rental construction is in the pipeline within 1–3 miles? Heavy new supply typically softens prices + rents 12–24 months out; constrained supply supports both.
Investment metrics
- 1% rule
- 1.22% ✓
- Cap rate
- 9.05%
- Cash-on-cash
- 9.85%
- DSCR
- 1.44
- GRM
- 6.8
CMA / ARV
- ARV (on-the-fly)
- $222,768
- Comps found
- 12
Show comp detail 12 sales within ~0.75 mi
| Address | Dist | Beds/Ba | Sqft | Sold | Price | $/sf | Match |
|---|---|---|---|---|---|---|---|
| 6330 Stonecrest Dr | 0.00mi | 3/2.0 | 884 (0%) | 1mo | $149,900 | $170 | 97 |
| 6330 Ledgebrook Dr | 0.06mi | 3/1.0 | 884 (0%) | 2mo | $225,000 | $255 | 93 |
| 6330 Sandfield Dr | 0.12mi | 3/1.5 | 891 (+1%) | 1mo | $235,000 | $264 | 92 |
| 6448 Delores Blvd | 0.17mi | 3/1.0 | 884 (0%) | 2mo | $175,000 | $198 | 88 |
| 15995 Paulding Blvd | 0.46mi | 3/2.0 | 912 (+3%) | 2mo | $237,500 | $260 | 70 |
| 15425 Richard Dr | 0.25mi | 3/2.0 | 972 (+10%) | 1mo | $245,000 | $252 | 69 |
| 15532 Rademaker Dr | 0.69mi | 3/2.0 | 936 (+6%) | 3mo | $255,000 | $272 | 54 |
| 6131 Hardin Dr | 0.56mi | 3/2.0 | 972 (+10%) | 4mo | $230,000 | $237 | 52 |
| 6065 Mercer Dr | 0.67mi | 2/2.0 (-1) | 936 (+6%) | 2mo | $232,900 | $249 | 50 |
| 6095 Stark Dr | 0.74mi | 4/2.0 (+1) | 936 (+6%) | 2mo | $241,500 | $258 | 47 |
| 6040 Slater Dr | 0.70mi | 3/1.0 | 999 (+13%) | 4mo | $245,000 | $245 | 40 |
| 6162 Engle Rd | 0.72mi | 2/1.0 (-1) | 1,016 (+15%) | 1mo | $205,000 | $202 | 34 |
Match score weights: distance 35% · size 25% · config 20% · recency 20%. Top-matched comps best support the ARV.
Projected returns pro-forma
-3.0% appreciation · 3.0% rent growth · sell at horizon
- IRR
- -1.4%
- Equity multiple
- 0.95×
- Total profit
- $-2,273
- Equity at exit
- $22,351
- IRR
- 8.3%
- Equity multiple
- 1.63×
- Total profit
- $26,549
- Equity at exit
- $12,961
Cash invested: $41,972 (down + closing). Projections, not guarantees.
Landlord ↔ Tenant lean methodology
- Overall (STATE)
- 73 Landlord-Friendly
- State Ohio
- 73 Landlord-Friendly · R+6
- County
- — inherits STATE
- City
- — inherits STATE
ZIP-level market 44142
- Active inventory
- 44
- Price-to-rent
- 6.8×
Monthly cashflow live
- Estimated rent
- $1,824 medium interval (Pro) →
- Mortgage (P&I)
- −$786
- Tax from tax record
- −$248 /mo · $2,971/yr
- Insurance
- −$62
- HOA
- −$0
- Vacancy / Maint / Mgmt
- −$383
- Net cashflow
- $345
Break-even live
Sensitivity live
| Price | -10% $430 | -5% $387 | +0% $345 | +5% $302 | +10% $260 |
|---|---|---|---|---|---|
| Rent | -10% $201 | -5% $273 | +0% $345 | +5% $417 | +10% $489 |
| Rate | -1.0pp $420 | -0.5pp $383 | base $345 | +0.5pp $306 | +1.0pp $266 |
UW: 25.0% down · 7.5% · 30yr · 1.5% tax · 5.0% vac · 8.0% maint · 8.0% mgmt
Financing live
Cash to close
- Down payment
- $37,475
- Closing costs
- $4,497
- Reserves months
- —
- Total cash needed
- —
Loan-product check · same deal, 3 products live
Conventional
25% down · 7.5% · 30yr
- Down + closing
- —
- Monthly P&I
- —
- Monthly cashflow
- —
- DSCR
- —
- Eligible?
- —
Personal DTI + credit; lowest rate.
DSCR
20% down · 8.5% · 30yr
- Down + closing
- —
- Monthly P&I
- —
- Monthly cashflow
- —
- DSCR
- —
- Eligible?
- —
No personal income docs; deal must DSCR.
Hard money
10% down · 12.0% · 12mo
- Down + closing
- —
- Monthly P&I
- —
- Monthly cashflow
- —
- DSCR
- —
- Eligible?
- —
Short-term bridge; refi at stabilization.
Rent comps 2 comps
| Address | Beds | Baths | Sqft | Rent | $/sqft | DOM | Units | Dist |
|---|---|---|---|---|---|---|---|---|
| 16261 Remora Blvd Brook Park, OH | 3.0 | 1.0 | 936 | $1,750 | $1.87 | 46d | 1 | 0.79mi |
| 6333 W 130th St Cleveland, OH | 3.0 | 2.0 | 1020 | $2,000 | $1.96 | 45d | 1 | 1.41mi |
Listing history 2 events
-
2026-04-09status Pending
-
2026-03-31$149,900 Active
ⓘ Source: listings_history table (triggers on properties + properties_extension) + one-shot
backfill from property_details.listing_events for pre-trigger history.
Tax reassessment forecast OH · Partial reset (capped growth)
- Current annual tax
- $2,971 · $248/mo
- Projected year-2 tax
- $2,971 · $248/mo
- Expected delta
- $0/yr ($0/mo · 0.0%)
ⓘ Screening estimate from a state-policy table — verify with the county assessor before closing.
Climate risk First Street
- Flood 1/10 Low FEMA zone X (unshaded) · 0% chance over 30 yrs
- Wildfire 1/10 Low
- Heat 3/10 Moderate 7 d/yr ≥96°F today · 16 d/yr by 30 yrs out
- Wind 1/10 Low
- Air quality 2/10 Low 1 unhealthy d/yr today · 3 by 30 yrs out
Nearby sold comps map
Loading sold comps map…
Walkable amenities ~0.75 mi
Loading nearby amenities…
Taxation est. · year 1
- Rental income
- $21,885
- − Mortgage interest
- −$8,397
- − Property taxes
- −$2,971
- − Insurance
- −$750
- − Repairs & maintenance
- −$1,751
- − Management
- −$1,751
- − Depreciation
- −$4,361
- Taxable income
- $1,906
- Est. tax owed @ 24.0%
- −$457
- After-tax cash flow
- $3,679/yr
For passive investors: Depreciation is non-cash, so a rental often shows a tax loss while cash-flowing — sheltering income. Rental losses are passive: they offset passive income freely, and up to $25,000/yr can offset ordinary (W-2) income if you actively participate and your MAGI is under $100k (phasing out to $0 by $150k); unused losses carry forward. On sale, claimed depreciation is recaptured at up to 25%, and gains may owe capital-gains tax (a 1031 exchange can defer both). Figures are a year-1 estimate at your 24.0% rate — not tax advice; consult a CPA.
Schools (NCES district)
- District
- Berea City
- NCES district ID
- 3904360
- Math proficiency
- 47% ▼ -17.00%
- Reading proficiency
- 56% ▼ -7.00%
- Median HH income
- $51,921
- Composite
- 44.18/100
- National rank
- #2856
- State rank
- #414 of 656 in OH
Livability — Brook Park
- Score
- 74/100
- State rank
- #273
- US rank
- #4475
Category grades
Schools grade is shown separately in the Schools card above.
Census & demographics
- Census place
- Brook Park, OH
- County
- Cuyahoga County · 1,090,369 people
- City population
- 18,359
- Metro
- Cleveland-Elyria, OH
- Population (ZIP)
- 18,284
- Household income
- $71,332
- Rent vs Own
- Severe rent burden
- 275.0
Population outlook (Cuyahoga County) Hauer SSP2
- Today (2025)
- 1,244,621 people
- By 2030
- 1,230,093 · -1.2%
- By 2040
- 1,189,108 · -4.5%
- By 2050
- 1,145,706 · -7.9%
- By 2075
- 1,076,557 · -13.5%
- By 2100
- 978,987 · -21.3%
Race, ethnicity, and origin ACS 2023
- Neighborhood character
- Predominantly White (83%)
- Race & ethnicity
- White 83% Hispanic / Latino 6% Black 6% Two or more races 5% Asian 2%
- Hispanic origin (detail)
- Mexican 2% Puerto Rican 2%
- Common ancestry
- Romanian 11% Subsaharan African 2% Scotch-Irish 1%
- Foreign-born
- 5% · Canada, India, China
- Languages at home
- 93% English-only · Spanish 2% Other Indo-European 2% Russian/Polish/Slavic 1%
Political lean MEDSL · Cuyahoga
- 2024 margin
- Solid D (+31.5) · D 65.4% · R 33.9%
- 2008→2024 swing
- -7.4pp toward R · 2008: 38.9pp · 2024: 31.5pp
- All cycles
- 2024: D+31.5 2020: D+34.1 2016: D+35.0 2012: D+38.7 2008: D+38.9
Not yet ingested
- Civics
- —
Market trends
- HPI YoY
- ▼ -177.54%
- Current HPI
- 193.7004
- Rent YoY
- —
- Metro
- Cleveland-Elyria, OH
- State GDP YoY
- ▲ 1.98%
- F500 in state
- 48
Industry mix (Fortune 500 HQ in OH)
| Industry | F500 HQs | Revenue |
|---|---|---|
| Insurance | 3 | $145B |
|
||
| Industrial Machinery | 3 | $49B |
|
||
| Financial Services | 3 | $24B |
|
||
| Consumer Goods | 2 | $93B |
|
||
| Aerospace / Defense | 2 | $47B |
|
||
| Utilities | 2 | $33B |
|
||
Price history
2 events — show timeline
- 2026-04-09 Pending — MLSNOW
- 2026-03-31 Listed $149,900 MLSNOW
Property tax history
+5.4%/yrLatest (2025): $2,971 · -32.9% YoY. Source: county tax records.
Cash-flow waterfall
monthlySold comps — $/sqft
last 12 mo · ≤1 miLoading sold comps…