704 N Sherman Ave · Okmulgee, OK
Flood risk 1/10 · Minimal
- FEMA flood zone
- X (unshaded)
- Chance of flooding over 30 yrs
- 0.0%
- Est. flood insurance / yr
- $507 – $1,088
Fire risk 8/10 · Major
- Est. fire insurance / yr
- $2,463 – $4,575
Heat risk 6/10 · Moderate
- Hot days now (above 111°F)
- 7 days/yr
- Hot days in 30 yrs
- 19 days/yr
Wind risk 3/10 · Minor
- Chance of severe wind over 30 yrs
- 6.0%
Air-quality risk 2/10 · Minimal
- Unhealthy air days now
- 1 days/yr
- Unhealthy air days in 30 yrs
- 2 days/yr
Risk factors via First Street. Map © Google.
Why this score? — see what drove the C+ grade
The composite is a weighted blend of 9 inputs, each scored 0–100. Each bar is that input's sub-score; the figure is the points it added to the 100-point composite (weight × sub-score).
- Cash flow +30.0/30.0
- DSCR +10.0/10.0
- 1% rule +8.7/10.0
- ARV discount +7.5/15.0
- Livability +3.1/5.0
- Rent growth +2.5/5.0
- Condition / age +2.5/5.0
- Schools +0.4/10.0
- Appreciation +0.2/10.0
$74,918
🖨 Deal sheet 📄 Offer letter ✓ Due diligence
Listing remarks
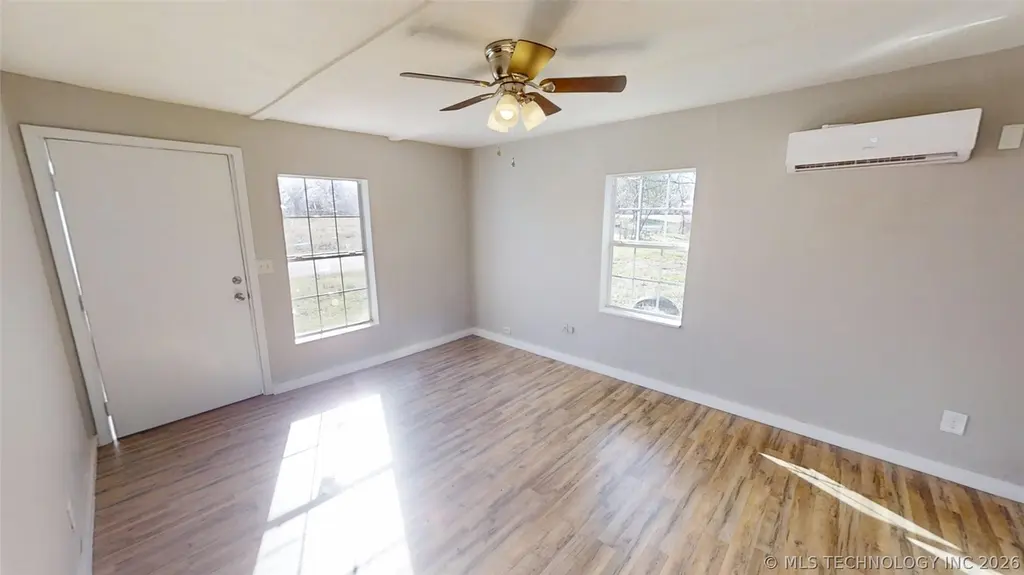
Welcome home! This beautifully remodeled 3-bedroom home is move-in ready and located in an inviting neighborhood. The functional floor plan includes a generously sized utility room and a large backyard perfect for entertaining. Recent improvements include a replaced roof and new heating and air conditioning systems. Qualified buyers may be eligible for 100% financing with no money down. A great opportunity for an owner-occupant or investor. Owner is a Licensed Real Estate Agent
Key facts
- Large backyard
- Freshly remodeled
- 5,200 sq ft lot
Tags
Property features AI
Exterior
- Security: No safety shelter
- Utilities: Electricity available; Natural gas available; Public water; Public sewer
- Home design: Single-story; Faces north; Entry over crawlspace
- Construction: Built with HardiPlank siding and wood frame; Asphalt/fiberglass roof; Crawlspace foundation; Has home warranty
- Exterior features: Porch; Additional land available
Interior
- Kitchen: Gas range; Gas oven; Oven; Range; Stove
- Flooring: Laminate flooring
- Bathrooms: 1 full bathroom
- Heating & cooling: Ductless cooling; Ductless electric heating; Gas water heater
- Interior features: Ceiling fan(s); Laminate counters; Other interior features
- Laundry & utility: Washer hookup; Electric dryer hookup
Neighborhood map
What this means for you Summary
Snapshot
- This is a 2-bed/1.0-bath single-family listed at $75k.
Deal economics
- At list price, monthly cash flow is $371 ($4k/yr) — positive.
- The deal already cash-flows at list — no discount required.
- Meets the 1% rule at list price ($1k rent vs $75k).
- Recommended offer: $74k (1.5% below list) — sets the bar for market timing.
- Cap rate 12.2% vs local median 7.6% in Okmulgee — top-decile yield for the area; either an underpriced asset or a hidden risk that comps aren't pricing in. Stress-test before assuming the spread holds.
Location & tenants
- Location reads 61/100 on livability (#300 in OK) — a middle-class / working-renter tenant base. Strengths: cost of living A+, housing A+, health & safety A+; Watch: schools F, crime F, amenities F.
- Okmulgee (town): math 3% / reading 7% proficiency, ranked #264 of 270 in OK (top 98%) — low school quality limits family demand, transient renter base, plan for 1-2y turnover; 73% free/reduced lunch — lower-income household profile, screen leases tightly.
- Market conditions: 146 active listings in the ZIP; 5 comparable units currently listed for rent nearby; rentals at typical pace (median 24d on market — plan ~3-4 weeks tenant-placement turnaround); 12 units permitted in Okmulgee County in 2024 (0 in 5+ unit buildings).
Forward outlook
- Local home prices are declining (-3.0%/yr); year-one equity from $518 of loan paydown is wiped out by about $2k of value loss. Plan a longer hold.
- Okmulgee County population projected at -13% by 2050 — secular population decline; favor cash flow + early exit over multi-decade hold.
- At projected returns (-3.0% appreciation + 3.0% rent growth), your $21k cash investment doubles in ~6 years — after that, you're playing with house money.
Negotiation context
- It's been on market 29 days — a 2% lower offer ($74k) is reasonable based on typical stale-listing flexibility.
- 2 sale attempts; this cycle's ask has dropped $5k (6%) from the opening price — seller is motivated, your offer sets the floor, not the list.
- Current owner paid $14k; list at $75k implies a 435% gain — meaningful room to come down on a strong offer.
Risks & watch-outs
- Watch-outs: built in 1930 — expect roof / HVAC / electrical / plumbing capex.
- Climate carrying-cost: severe wildfire risk; extreme-heat days projected 7→19/yr by 2055 (HVAC capex compounding) — expect insurance premiums to compound above CPI over the hold.
Questions for the listing agent
- Built in 1930 — when were the roof, HVAC, electrical panel, plumbing, and water heater last replaced?
- Is there a deadline driving the sale (1031 exchange, divorce, estate, relocation)? That informs how much negotiation room exists.
- Schools are F-rated, which usually means shorter tenancies and higher turnover. Who's the typical renter profile here, and what's been the actual vacancy rate?
- Crime grade is F in this area — have there been break-ins, vandalism, or insurance claims at this property in the last 3 years? What carrier currently insures it and at what premium?
- What's the average days-on-market for RENTAL listings here right now (not sales)? A rising rental-DOM trend means longer vacancies and softer asking-rent achievability than the comps imply.
- What's the recent tenant-quality profile in this submarket — average credit score on applications, eviction rate, late-payment / NSF rate, and stable-employment percentage? A property-management company in the area should have these aggregated.
- How much new for-sale + rental construction is in the pipeline within 1–3 miles? Heavy new supply typically softens prices + rents 12–24 months out; constrained supply supports both.
Investment metrics
- 1% rule
- 1.37% ✓
- Cap rate
- 12.23%
- Cash-on-cash
- 21.20%
- DSCR
- 1.94
- GRM
- 6.1
CMA / ARV
- ARV (on-the-fly)
- $39,360
- Comps found
- 10
Show comp detail 10 sales within ~0.75 mi
| Address | Dist | Beds/Ba | Sqft | Sold | Price | $/sf | Match |
|---|---|---|---|---|---|---|---|
| 804 N Griffin Ave | 0.26mi | 2/1.0 | 1,008 (+5%) | 3mo | $33,000 | $33 | 77 |
| 606 N Sherman Ave | 0.07mi | 2/1.0 | 939 (-2%) | 19mo | $27,000 | $29 | 77 |
| 1017 N Oklahoma Ave | 0.36mi | 2/1.0 | 936 (-2%) | 10mo | $90,000 | $96 | 70 |
| 133 N Bryan Ave | 0.36mi | 2/1.0 | 912 (-5%) | 12mo | $55,000 | $60 | 65 |
| 805 N Sherman Ave | 0.08mi | 3/1.0 (+1) | 1,064 (+11%) | 11mo | $123,000 | $116 | 64 |
| 1014 W Cherokee St | 0.11mi | 2/1.0 | 840 (-12%) | 14mo | $10,000 | $12 | 62 |
| 1201 W 5th St | 0.39mi | 2/1.0 | 1,008 (+5%) | 15mo | $37,500 | $37 | 61 |
| 309 N Sherman Ave | 0.29mi | 2/1.0 | 866 (-10%) | 15mo | $37,500 | $43 | 58 |
| 906 N Central Ave | 0.73mi | 2/1.0 | 863 (-10%) | 9mo | $35,000 | $41 | 41 |
| 701 W 9th St | 0.66mi | 3/1.0 (+1) | 860 (-10%) | 17mo | $20,000 | $23 | 32 |
Match score weights: distance 35% · size 25% · config 20% · recency 20%. Top-matched comps best support the ARV.
Projected returns pro-forma
-3.0% appreciation · 3.0% rent growth · sell at horizon
- IRR
- 13.7%
- Equity multiple
- 1.54×
- Total profit
- $11,429
- Equity at exit
- $11,171
- IRR
- 22.4%
- Equity multiple
- 2.92×
- Total profit
- $40,208
- Equity at exit
- $6,478
Cash invested: $20,977 (down + closing). Projections, not guarantees.
Landlord ↔ Tenant lean methodology
- Overall (STATE)
- 83 Strongly Landlord-Friendly
- State Oklahoma
- 83 Strongly Landlord-Friendly · R+20
- County
- — inherits STATE
- City
- — inherits STATE
ZIP-level market 74447
- Home prices YoY
- -3.6%
- Active inventory
- 146
- Price-to-rent
- 6.1×
Monthly cashflow live
- Estimated rent
- $1,024 high interval (Pro) →
- Mortgage (P&I)
- −$393
- Tax from tax record
- −$14 /mo · $170/yr
- Insurance
- −$31
- HOA
- −$0
- Vacancy / Maint / Mgmt
- −$215
- Net cashflow
- $371
Break-even live
UW: 25.0% down · 7.5% · 30yr · 1.5% tax · 5.0% vac · 8.0% maint · 8.0% mgmt
Financing live
Cash to close
- Down payment
- $18,730
- Closing costs
- $2,248
- Reserves months
- —
- Total cash needed
- —
Loan-product check · same deal, 3 products live
Conventional
25% down · 7.5% · 30yr
- Down + closing
- —
- Monthly P&I
- —
- Monthly cashflow
- —
- DSCR
- —
- Eligible?
- —
Personal DTI + credit; lowest rate.
DSCR
20% down · 8.5% · 30yr
- Down + closing
- —
- Monthly P&I
- —
- Monthly cashflow
- —
- DSCR
- —
- Eligible?
- —
No personal income docs; deal must DSCR.
Hard money
10% down · 12.0% · 12mo
- Down + closing
- —
- Monthly P&I
- —
- Monthly cashflow
- —
- DSCR
- —
- Eligible?
- —
Short-term bridge; refi at stabilization.
Rent comps 5 comps
| Address | Beds | Baths | Sqft | Rent | $/sqft | DOM | Units | Dist |
|---|---|---|---|---|---|---|---|---|
| 1104 W 8th St Okmulgee, OK | 2.0 | 1.0 | 1084 | $850 | $0.78 | 3d | 1 | 0.53mi |
| 324 E 6th St Unit 214 Okmulgee, OK | 2.0 | 1.0 | 891 | $1,200 | $1.35 | 23d | 1 | 0.92mi |
| 324 E 6th St Unit 204 Okmulgee, OK | 2.0 | 1.0 | 770 | $1,150 | $1.49 | 23d | 1 | 0.92mi |
| 324 E 6th St Unit 116 Okmulgee, OK | 2.0 | 1.0 | 776 | $1,060 | $1.37 | 23d | 1 | 0.92mi |
| 324 E 6th St Unit 109 Okmulgee, OK | 2.0 | 1.0 | 676 | $985 | $1.46 | 23d | 1 | 0.92mi |
Listing history 20 events
-
2026-06-18days on market $74,918 Active 29 DOM
-
2026-06-17days on market $74,918 Active 28 DOM
-
2026-06-17remarks 482-char remark
-
2026-06-16days on market $74,918 Active 27 DOM
-
2026-06-15days on market $74,918 Active 26 DOM
-
2026-06-14price $74,918 Active 24 DOM
-
2026-06-13days on market $79,918 Active 24 DOM
-
2026-06-12days on market $79,918 Active 23 DOM
-
2026-06-09days on market $79,918 Active 20 DOM
-
2026-06-08days on market $79,918 Active 19 DOM
-
2026-06-08days on market $79,918 Active 18 DOM
-
2026-06-07days on market $79,918 Active 17 DOM
-
2026-06-04days on market $79,918 Active 14 DOM
-
2026-06-02days on market $79,918 Active 13 DOM
-
2026-06-01days on market $79,918 Active 12 DOM
-
2026-05-31days on market $79,918 Active 11 DOM
-
2026-05-20$79,918 Active
-
2026-01-31historical
-
2025-08-14$87,500 Active
-
2002-09-24soldstatus $14,000
ⓘ Source: listings_history table (triggers on properties + properties_extension) + one-shot
backfill from property_details.listing_events for pre-trigger history.
Tax reassessment forecast OK · Resets to sale price
- Current annual tax
- $170 · $14/mo
- Projected year-2 tax
- $674 · $56/mo
- Expected delta
- +$504/yr (+$42/mo · 296.6%)
ⓘ Screening estimate from a state-policy table — verify with the county assessor before closing.
Climate risk First Street
- Flood 1/10 Low FEMA zone X (unshaded) · 0% chance over 30 yrs
- Wildfire 8/10 Severe
- Heat 6/10 Major 7 d/yr ≥111°F today · 19 d/yr by 30 yrs out
- Wind 3/10 Moderate 6% chance of damaging wind over 30 yrs
- Air quality 2/10 Low 1 unhealthy d/yr today · 2 by 30 yrs out
Nearby sold comps map
Loading sold comps map…
Walkable amenities ~0.75 mi
Loading nearby amenities…
Taxation est. · year 1
- Rental income
- $12,286
- − Mortgage interest
- −$4,197
- − Property taxes
- −$170
- − Insurance
- −$375
- − Repairs & maintenance
- −$983
- − Management
- −$983
- − Depreciation
- −$2,179
- Taxable income
- $3,400
- Est. tax owed @ 24.0%
- −$816
- After-tax cash flow
- $3,631/yr
For passive investors: Depreciation is non-cash, so a rental often shows a tax loss while cash-flowing — sheltering income. Rental losses are passive: they offset passive income freely, and up to $25,000/yr can offset ordinary (W-2) income if you actively participate and your MAGI is under $100k (phasing out to $0 by $150k); unused losses carry forward. On sale, claimed depreciation is recaptured at up to 25%, and gains may owe capital-gains tax (a 1031 exchange can defer both). Figures are a year-1 estimate at your 24.0% rate — not tax advice; consult a CPA.
Schools (NCES district)
- District
- Okmulgee
- NCES district ID
- 4022800
- Math proficiency
- 3% ▼ -5.00%
- Reading proficiency
- 7% ▼ -8.00%
- Median HH income
- $31,078
- Composite
- 3.66/100
- National rank
- #10069
- State rank
- #264 of 270 in OK
Livability — Okmulgee
- Score
- 61/100
- State rank
- #300
- US rank
- #17773
Category grades
Schools grade is shown separately in the Schools card above.
Census & demographics
- Census place
- Okmulgee, OK
- Population (ZIP)
- 15,500
Population outlook (Okmulgee County) Hauer SSP2
- Today (2025)
- 37,543 people
- By 2030
- 36,528 · -2.7%
- By 2040
- 34,430 · -8.3%
- By 2050
- 32,498 · -13.4%
- By 2075
- 28,814 · -23.3%
- By 2100
- 25,193 · -32.9%
Race, ethnicity, and origin ACS 2023
- Neighborhood character
- Diverse neighborhood (Simpson 0.69)
- Race & ethnicity
- White 54% Native American 15% Two or more races 15% Black 13% Hispanic / Latino 4%
- Common ancestry
- Slovak 2% Italian 1% Romanian 1%
- Foreign-born
- 1%
- Languages at home
- 97% English-only · Spanish 1%
Political lean MEDSL · Okmulgee
- 2024 margin
- Solid R (+42.7) · D 27.7% · R 70.4% · Other 1.9%
- 2008→2024 swing
- -25.7pp toward R · 2008: -17.0pp · 2024: -42.7pp
- All cycles
- 2024: R+42.7 2020: R+37.1 2016: R+32.7 2012: R+17.5 2008: R+17.0
Not yet ingested
- Civics
- —
Market trends
- HPI YoY
- ▼ -9.69%
- Current HPI
- 257.2856
- Rent YoY
- —
- Metro
- —
- State GDP YoY
- ▲ 1.55%
- F500 in state
- 6
Industry mix (Fortune 500 HQ in OK)
| Industry | F500 HQs | Revenue |
|---|---|---|
| Energy | 3 | $48B |
|
||
Price history
+470.8% since first listed4 events — show timeline
- 2026-05-20 Listed $79,918 MLS Technology, Inc.
- 2026-01-31 Listing Removed — MLS Technology, Inc.
- 2025-08-14 Listed $87,500 MLS Technology, Inc.
- 2002-09-24 Sold (Public Records) $14,000 Public Records
Property tax history
+4.8%/yrLatest (2025): $170 · +6.2% YoY. Source: county tax records.
Cash-flow waterfall
monthlySold comps — $/sqft
last 12 mo · ≤1 miLoading sold comps…