 🏗️ New Construction
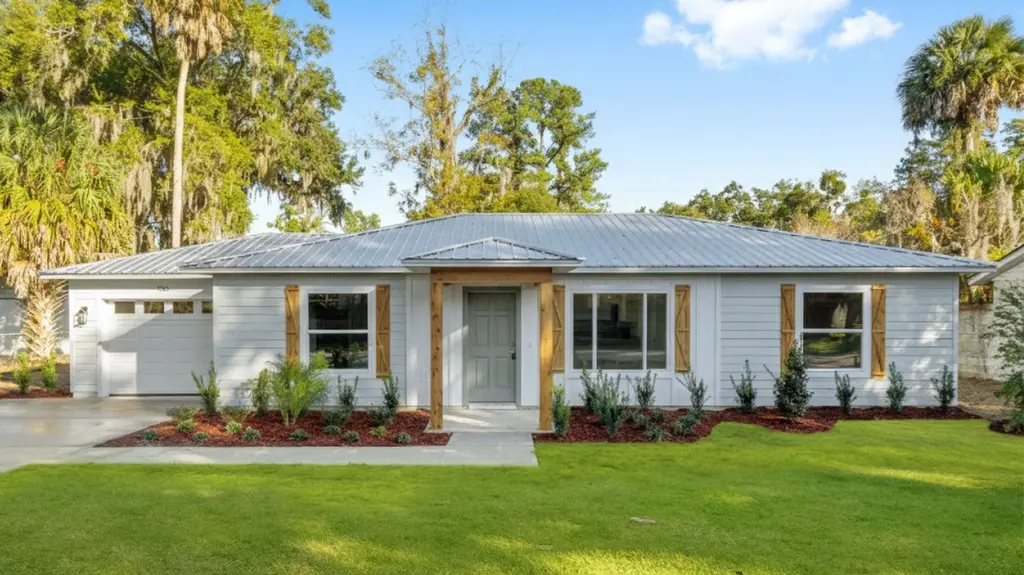
Dovetail: Build On Your Lot Plan · Ocala, FL
Flood risk No data
- FEMA flood zone
- —
- Chance of flooding over 30 yrs
- —
- Est. flood insurance / yr
- —
Fire risk No data
- Est. fire insurance / yr
- —
Heat risk No data
- Hot days now (above threshold)
- —
- Hot days in 30 yrs
- —
Wind risk No data
- Chance of severe wind over 30 yrs
- —
Air-quality risk No data
- Unhealthy air days now
- —
- Unhealthy air days in 30 yrs
- —
Risk factors via First Street. Map © Google.
Why this score? — see what drove the D+ grade
The composite is a weighted blend of 9 inputs, each scored 0–100. Each bar is that input's sub-score; the figure is the points it added to the 100-point composite (weight × sub-score).
- Cash flow +17.1/30.0
- ARV discount +7.5/15.0
- DSCR +5.3/10.0
- Condition / age +5.0/5.0
- 1% rule +4.6/10.0
- Schools +3.6/10.0
- Livability +3.5/5.0
- Rent growth +2.3/5.0
- Appreciation +0.0/10.0
$204,900
🖨 Deal sheet 📄 Offer letter ✓ Due diligence
Listing remarks MLS
Build On Your Lot: The Dovetail model offers 1,450 sqft of expertly optimized living space, specifically designed to make the most of your Florida homesite. Its layout prioritizes a seamless flow and open feel, proving that smart design can maximize both connection and privacy. With an inviting front porch made for enjoying the sunshine, the Dovetail is a high-quality, efficient choice for those looking to build a stylish and functional retreat on their own lot. Note: The price reflects the price of the home itself and does not include the property. You are responsible for providing the property on which these plans will be built. If you don't own a Lot, our team will guide you in finding the ideal location and match it with a home design that reflects your style and preferences.
Key facts
- Parking
- Listed 119 days
Neighborhood map
What this means for you Summary
Snapshot
- This is a 3-bed/2.0-bath single-family listed at $205k. Condition is rated excellent.
Deal economics
- At list price, monthly cash flow is $136 ($2k/yr) — positive.
- The deal already cash-flows at list — no discount required.
- To meet the 1% rule (rent ≥ 1% of price), the offer needs to be $188k (8.1% below list).
- Recommended offer: $186k (9.0% below list) — sets the bar for market timing.
- Cap rate 7.1% vs local median 4.2% in Ocala — top-decile yield for the area; either an underpriced asset or a hidden risk that comps aren't pricing in. Stress-test before assuming the spread holds.
Location & tenants
- Location reads 69/100 on livability (#476 in FL) — a middle-class / working-renter tenant base. Strengths: cost of living A+, housing A+, health & safety A+; Watch: crime F, amenities F, commute F.
- Marion (rural): math 42% / reading 43% proficiency, ranked #61 of 73 in FL (top 84%) — families likely to look elsewhere, expect single-tenant / working-renter base with shorter leases; 61% free/reduced lunch — lower-income household profile, screen leases tightly.
- Market conditions: Rents soft (-0.6%/yr); 311 active listings in the ZIP; 20 comparable units currently listed for rent nearby; rentals at typical pace (median 21d on market — plan ~3-4 weeks tenant-placement turnaround); 7,071 units permitted in Marion County in 2024 (534 in 5+ unit buildings).
- This rent runs 34% of the median local income ($66k/yr) — at the standard rent-burdened threshold; future hikes will face affordability resistance.
Forward outlook
- Local home prices are declining (-3.0%/yr); year-one equity from $1k of loan paydown is wiped out by about $6k of value loss. Plan a longer hold.
- Marion County population projected at +13% by 2050 — modest demand growth; plan on rents tracking national, not racing it.
Negotiation context
- It's been on market 119 days — a 9% lower offer ($186k) is reasonable based on typical stale-listing flexibility.
Questions for the listing agent
- It's been on market 119 days. Have you received any prior offers? Is the seller open to a 9% concession, seller financing, or rate buy-down credit?
- Why hasn't it sold? Are there any deal-killer items the seller is aware of (foundation, flood, title, zoning, code violations)?
- Is there a deadline driving the sale (1031 exchange, divorce, estate, relocation)? That informs how much negotiation room exists.
- Crime grade is F in this area — have there been break-ins, vandalism, or insurance claims at this property in the last 3 years? What carrier currently insures it and at what premium?
- The area grade is low — what's the realistic commute time and amenity access for the typical tenant pool here? Any planned neighborhood developments (good or bad) we should know about?
- What's the average days-on-market for RENTAL listings here right now (not sales)? A rising rental-DOM trend means longer vacancies and softer asking-rent achievability than the comps imply.
- What's the recent tenant-quality profile in this submarket — average credit score on applications, eviction rate, late-payment / NSF rate, and stable-employment percentage? A property-management company in the area should have these aggregated.
- How much new for-sale + rental construction is in the pipeline within 1–3 miles? Heavy new supply typically softens prices + rents 12–24 months out; constrained supply supports both.
Investment metrics
- 1% rule
- 0.96% ✗
- Cap rate
- 7.13%
- Cash-on-cash
- 2.98%
- DSCR
- 1.13
- GRM
- 8.7
CMA / ARV
- ARV (median comp)
- $195,591
- List price
- $204,900
- Delta
- 4.76%
- Verdict
- FAIR
- Comps
- 20 within 1.0 mi
Show comp detail 1 sale within ~0.75 mi
| Address | Dist | Beds/Ba | Sqft | Sold | Price | $/sf | Match |
|---|---|---|---|---|---|---|---|
| 218 NW 9th Ave | 0.42mi | 4/2.0 (+1) | 1,352 (-7%) | 16mo | $227,500 | $168 | 50 |
Match score weights: distance 35% · size 25% · config 20% · recency 20%. Top-matched comps best support the ARV.
Projected returns pro-forma
-3.0% appreciation · 0.0% rent growth · sell at horizon
- IRR
- -15.0%
- Equity multiple
- 0.48×
- Total profit
- $-28,525
- Equity at exit
- $29,163
- IRR
- -12.5%
- Equity multiple
- 0.36×
- Total profit
- $-34,901
- Equity at exit
- $16,911
Cash invested: $54,765 (down + closing). Projections, not guarantees.
Landlord ↔ Tenant lean methodology
- Overall (STATE)
- 87 Strongly Landlord-Friendly
- State Florida
- 87 Strongly Landlord-Friendly · R+3
- County
- — inherits STATE
- City
- — inherits STATE
ZIP-level market 34471
- Rents YoY
- -0.6%
- Active inventory
- 311
- Price-to-rent
- 9.1×
Monthly cashflow live
- Estimated rent
- $1,883 high interval (Pro) →
- Mortgage (P&I)
- −$1,026
- Tax est. 1.5%
- −$244 /mo · $2,934/yr
- Insurance
- −$81
- HOA
- −$0
- Vacancy / Maint / Mgmt
- −$395
- Net cashflow
- $136
Break-even live
UW: 25.0% down · 7.5% · 30yr · 1.5% tax · 5.0% vac · 8.0% maint · 8.0% mgmt
Financing live
Cash to close
- Down payment
- $48,898
- Closing costs
- $5,868
- Reserves months
- —
- Total cash needed
- —
Loan-product check · same deal, 3 products live
Conventional
25% down · 7.5% · 30yr
- Down + closing
- —
- Monthly P&I
- —
- Monthly cashflow
- —
- DSCR
- —
- Eligible?
- —
Personal DTI + credit; lowest rate.
DSCR
20% down · 8.5% · 30yr
- Down + closing
- —
- Monthly P&I
- —
- Monthly cashflow
- —
- DSCR
- —
- Eligible?
- —
No personal income docs; deal must DSCR.
Hard money
10% down · 12.0% · 12mo
- Down + closing
- —
- Monthly P&I
- —
- Monthly cashflow
- —
- DSCR
- —
- Eligible?
- —
Short-term bridge; refi at stabilization.
Rent comps 20 comps
| Address | Beds | Baths | Sqft | Rent | $/sqft | DOM | Units | Dist |
|---|---|---|---|---|---|---|---|---|
| 714 NW 1st St Ocala, FL | 3.0 | 2.0 | 1444 | $2,200 | $1.52 | 13d | 1 | 0.32mi |
| 717 W Silver Springs Pl Ocala, FL | 3.0 | 2.0 | 1000 | $1,445 | $1.45 | 13d | 1 | 0.33mi |
| 302 SE Broadway St #460 Ocala, FL | 2.0 | 2.0 | 1500 | $3,000 | $2.00 | 21d | 1 | 0.36mi |
| 241 NE Tuscawilla Ave Ocala, FL | 2.0 | 1.0 | 1644 | $1,400 | $0.85 | 21d | 1 | 0.51mi |
| 900 SE 3rd Ave Ocala, FL | 2.0–3.0 | 2.0 | 1160 | $2,325 | $2.00 | 13d | 4 | 0.61mi |
| 339 NE Sanchez Ave Unit 111 Ocala, FL | 3.0 | 3.0 | 1422 | $1,649 | $1.16 | 21d | 1 | 0.61mi |
| 710 NE 4th St Unit 101 Ocala, FL | 3.0 | 3.0 | 1422 | $1,575 | $1.11 | 21d | 1 | 0.61mi |
| 510 SE 11th St Unit 510-D Ocala, FL | 2.0 | 1.0 | 925 | $995 | $1.08 | 13d | 1 | 0.79mi |
| 305 SE 10th Ave Ocala, FL | 2.0 | 1.0 | 1449 | $1,800 | $1.24 | 21d | 1 | 0.87mi |
| 1683 SW 3rd St Ocala, FL | 4.0 | 2.0 | 1636 | $2,200 | $1.34 | 21d | 1 | 0.89mi |
| 730 SE 13th St Ocala, FL | 2.0 | 1.0 | 1000 | $1,499 | $1.50 | 21d | 1 | 0.98mi |
| 408 NE 12th Ave Ocala, FL | 4.0 | 2.0 | 1808 | $2,100 | $1.16 | 21d | 1 | 1.00mi |
| 1911 NW 6th St Ocala, FL | 3.0 | 1.0 | 877 | $1,400 | $1.60 | 13d | 1 | 1.09mi |
| 131 SE 13th Ave Ocala, FL | 2.0 | 1.0 | 956 | $1,225 | $1.28 | 13d | 1 | 1.14mi |
| 127 SE 13th Ave Unit R 3107 Ocala, FL | 2.0 | 1.0 | 956 | $1,225 | $1.28 | 13d | 1 | 1.15mi |
| 1316 E Fort King St Unit 1316-1 Ocala, FL | 2.0 | 1.0 | 892 | $1,499 | $1.68 | 21d | 1 | 1.16mi |
| 1908 NW 13th Pl Ocala, FL | 3.0 | 1.0 | 1000 | $1,325 | $1.32 | 21d | 1 | 1.33mi |
| 1140 NW 20th Ave Ocala, FL | 4.0 | 1.0 | 1144 | $1,550 | $1.35 | 21d | 1 | 1.36mi |
| 1549 NE 2nd St Unit B Ocala, FL | 2.0 | 2.0 | 1036 | $1,249 | $1.21 | 21d | 1 | 1.41mi |
| 691 SE 19th St Ocala, FL | 3.0 | 2.0 | 1424 | $1,800 | $1.26 | 21d | 1 | 1.41mi |
Listing history 15 events
-
2026-06-18days on market $204,900 Active 119 DOM
-
2026-06-17days on market $204,900 Active 118 DOM
-
2026-06-16days on market $204,900 Active 117 DOM
-
2026-06-15days on market $204,900 Active 116 DOM
-
2026-06-14days on market $204,900 Active 114 DOM
-
2026-06-13days on market $204,900 Active 113 DOM
-
2026-06-10days on market $204,900 Active 111 DOM
-
2026-06-09days on market $204,900 Active 110 DOM
-
2026-06-08days on market $204,900 Active 109 DOM
-
2026-06-07days on market $204,900 Active 108 DOM
-
2026-06-03days on market $204,900 Active 104 DOM
-
2026-06-02days on market $204,900 Active 103 DOM
-
2026-05-31days on market $204,900 Active 101 DOM
-
2026-05-30days on market $204,900 Active 100 DOM
-
2026-02-19$204,900 Active 790-char remark
Show marketing remark (790 chars)
Build On Your Lot: The Dovetail model offers 1,450 sqft of expertly optimized living space, specifically designed to make the most of your Florida homesite. Its layout prioritizes a seamless flow and open feel, proving that smart design can maximize both connection and privacy. With an inviting front porch made for enjoying the sunshine, the Dovetail is a high-quality, efficient choice for those looking to build a stylish and functional retreat on their own lot. Note: The price reflects the price of the home itself and does not include the property. You are responsible for providing the property on which these plans will be built. If you don't own a Lot, our team will guide you in finding the ideal location and match it with a home design that reflects your style and preferences.
ⓘ Source: listings_history table (triggers on properties + properties_extension) + one-shot
backfill from property_details.listing_events for pre-trigger history.
Nearby sold comps map
Loading sold comps map…
Walkable amenities ~0.75 mi
Loading nearby amenities…
Taxation est. · year 1
- Rental income
- $22,597
- − Mortgage interest
- −$10,956
- − Property taxes
- −$2,934
- − Insurance
- −$978
- − Repairs & maintenance
- −$1,808
- − Management
- −$1,808
- − Depreciation
- −$5,690
- Taxable loss
- −$1,576
- Est. tax savings @ 24.0%
- +$378
- After-tax cash flow
- $2,010/yr
For passive investors: Depreciation is non-cash, so a rental often shows a tax loss while cash-flowing — sheltering income. Rental losses are passive: they offset passive income freely, and up to $25,000/yr can offset ordinary (W-2) income if you actively participate and your MAGI is under $100k (phasing out to $0 by $150k); unused losses carry forward. On sale, claimed depreciation is recaptured at up to 25%, and gains may owe capital-gains tax (a 1031 exchange can defer both). Figures are a year-1 estimate at your 24.0% rate — not tax advice; consult a CPA.
Condition & rehab AI · 12 photos
This home is in excellent condition with no visible repairs or maintenance needed. It is move-in ready and offers a high ROI for both resale and rental markets.
Value-add opportunities
- Both Painting exterior and interior walls — Fresh paint enhances curb appeal and interior aesthetics.
- Both Landscaping improvements — Enhances curb appeal and adds value to the property.
Renovation cost estimate screening
Value-add ROI direction
- Both Painting exterior and interior walls — Fresh paint enhances curb appeal and interior aesthetics. ↑
- Both Landscaping improvements — Enhances curb appeal and adds value to the property. ↑
ⓘ Cost ranges are severity-bucket heuristics (US national rule-of-thumb). Get contractor quotes + a written scope before underwriting a rehab budget.
Schools (NCES district)
- District
- Marion
- NCES district ID
- 1201260
- Math proficiency
- 42% ▼ -7.00%
- Reading proficiency
- 43% ▼ -4.00%
- Median HH income
- $40,015
- Composite
- 35.61/100
- National rank
- #4890
- State rank
- #61 of 73 in FL
Livability — Ocala
- Score
- 69/100
- State rank
- #476
- US rank
- #8461
Category grades
Schools grade is shown separately in the Schools card above.
Census & demographics
- Census place
- Ocala, FL
- County
- Marion County · 315,796 people
- City population
- 263,375
- Metro
- Ocala, FL
- Population (ZIP)
- 28,342
- Household income
- $65,789
- Rent vs Own
- Severe rent burden
- 1494.0
Population outlook (Marion County) Hauer SSP2
- Today (2025)
- 365,905 people
- By 2030
- 376,768 · +3.0%
- By 2040
- 396,555 · +8.4%
- By 2050
- 412,723 · +12.8%
- By 2075
- 446,090 · +21.9%
- By 2100
- 436,193 · +19.2%
Race, ethnicity, and origin ACS 2023
- Neighborhood character
- Predominantly White (67%)
- Race & ethnicity
- White 67% Hispanic / Latino 16% Two or more races 11% Black 10% Asian 3%
- Hispanic origin (detail)
- Mexican 2% Puerto Rican 6% Cuban 3% Dominican 1%
- Common ancestry
- Slovak 3% Italian 2% Lithuanian 2%
- Foreign-born
- 9% · Canada, Jamaica, Dominican Republic
- Languages at home
- 86% English-only · Spanish 11% Other Asian/Pacific 1%
Political lean MEDSL · Marion
- 2024 margin
- Solid R (+31.6) · D 33.8% · R 65.5%
- 2008→2024 swing
- -20.0pp toward R · 2008: -11.6pp · 2024: -31.6pp
- All cycles
- 2024: R+31.6 2020: R+25.9 2016: R+26.2 2012: R+16.2 2008: R+11.6
Not yet ingested
- Civics
- —
Market trends
- HPI YoY
- ▼ -176.55%
- Current HPI
- 224.1709
- Rent YoY
- ▼ -0.64%
- Metro
- Ocala, FL
- State GDP YoY
- ▲ 3.28%
- F500 in state
- 36
Industry mix (Fortune 500 HQ in FL)
| Industry | F500 HQs | Revenue |
|---|---|---|
| Industrial Technology | 2 | $29B |
|
||
| Insurance | 2 | $17B |
|
||
| Retail | 1 | $60B |
|
||
| Technology Distribution | 1 | $58B |
|
||
| Homebuilding | 1 | $35B |
|
||
| Technology Manufacturing | 1 | $35B |
|
||
Price history
1 event — show timeline
- 2026-02-19 Listed $204,900 Zillow
Cash-flow waterfall
monthlySold comps — $/sqft
last 12 mo · ≤1 miLoading sold comps…