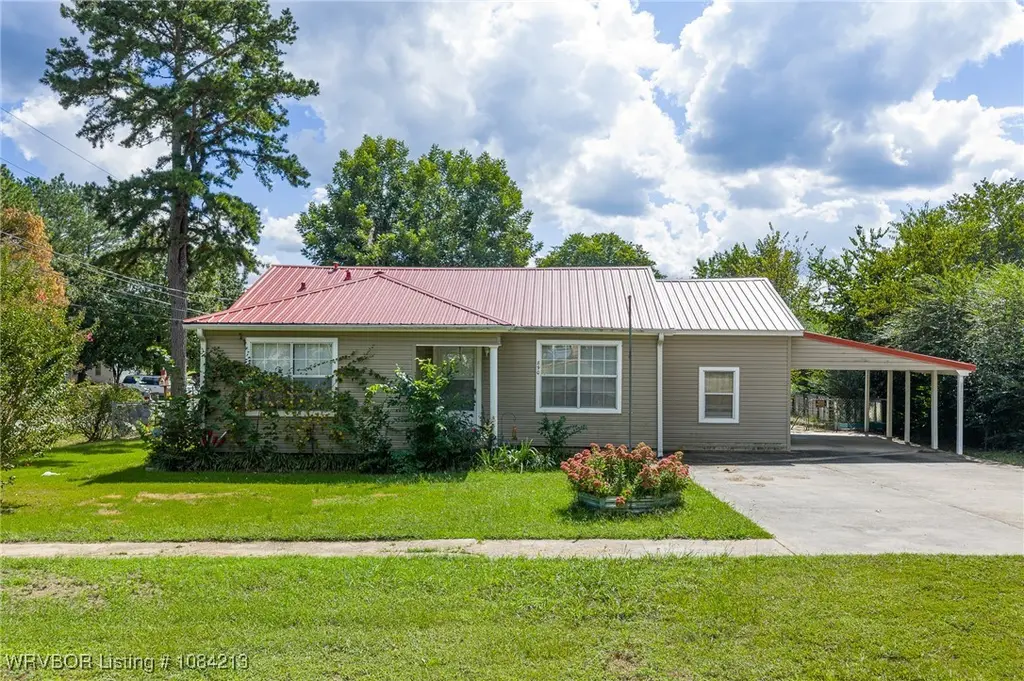
890 E 5th St · Booneville, AR
Flood risk 1/10 · Minimal
- FEMA flood zone
- X (unshaded)
- Chance of flooding over 30 yrs
- 0.0%
- Est. flood insurance / yr
- $507 – $1,088
Fire risk 7/10 · Major
- Est. fire insurance / yr
- $1,499 – $2,785
Heat risk 7/10 · Major
- Hot days now (above 114°F)
- 7 days/yr
- Hot days in 30 yrs
- 22 days/yr
Wind risk 2/10 · Minimal
- Chance of severe wind over 30 yrs
- 3.0%
Air-quality risk 2/10 · Minimal
- Unhealthy air days now
- 0 days/yr
- Unhealthy air days in 30 yrs
- 1 days/yr
Risk factors via First Street. Map © Google.
Why this score? — see what drove the D grade
The composite is a weighted blend of 9 inputs, each scored 0–100. Each bar is that input's sub-score; the figure is the points it added to the 100-point composite (weight × sub-score).
- ARV discount +11.3/15.0
- Cash flow +10.1/30.0
- Livability +3.6/5.0
- DSCR +2.9/10.0
- Schools +2.7/10.0
- Appreciation +2.6/10.0
- Rent growth +2.5/5.0
- Condition / age +2.5/5.0
- 1% rule +1.9/10.0
$148,000
🖨 Deal sheet 📄 Offer letter ✓ Due diligence
Listing remarks MLS
2 bed 1 1/2 bath home in great shape on corner lot, close to schools, with attached carport. Covered deck in chain link fenced backyard, covered gazebo, nice concrete patio, greenhouse, & storage building. Bonus room off of laundry could serve as office or 3rd bedroom. Several recent updates including new metal roof, new HVAC, & new vinyl plank flooring all in 2019.
Key facts
- Covered deck
- Covered gazebo
- Attached carport
Tags
Neighborhood map
What this means for you Summary
Snapshot
- This is a 2-bed/1.0-bath single-family listed at $148k.
Deal economics
- At list price, monthly cash flow is $-88 ($-1k/yr) — negative.
- To cash-flow at today's rent, offer at most $132k (10.5% below list).
- To meet the 1% rule (rent ≥ 1% of price), the offer needs to be $102k (30.9% below list).
- Recommended offer: $102k (30.9% below list) — sets the bar for 1% rule.
- Cap rate 5.6% vs local median 3.7% in Booneville — top-decile yield for the area; either an underpriced asset or a hidden risk that comps aren't pricing in. Stress-test before assuming the spread holds.
Location & tenants
- Location reads 72/100 on livability (#34 in AR) — a middle-class / working-renter tenant base. Strengths: cost of living A+, health & safety A+, housing A; Watch: schools D-, crime D-, amenities F.
- Booneville School District (town): math 33% / reading 33% proficiency, ranked #133 of 238 in AR (top 56%) — families likely to look elsewhere, expect single-tenant / working-renter base with shorter leases; 62% free/reduced lunch — lower-income household profile, screen leases tightly.
- Market conditions: 79 active listings in the ZIP; 11 units permitted in Logan County in 2024 (0 in 5+ unit buildings).
Forward outlook
- Local home prices are declining (-3.0%/yr); year-one equity from $1k of loan paydown is wiped out by about $4k of value loss. Plan a longer hold.
- Logan County population projected at -13% by 2050 — secular population decline; favor cash flow + early exit over multi-decade hold.
Negotiation context
- Only 10 days on market — expect competitive offers; lowballing is unlikely to land.
- Current owner paid $60k; list at $148k implies a 147% gain — meaningful room to come down on a strong offer.
Risks & watch-outs
- Climate carrying-cost: major wildfire risk; extreme-heat days projected 7→22/yr by 2055 (HVAC capex compounding) — expect insurance premiums to compound above CPI over the hold.
Questions for the listing agent
- What do current leases actually rent for vs. the listed asking? Can we see a recent rent roll and the last 12 months of T-12 income?
- Is there a deadline driving the sale (1031 exchange, divorce, estate, relocation)? That informs how much negotiation room exists.
- Schools are D-rated, which usually means shorter tenancies and higher turnover. Who's the typical renter profile here, and what's been the actual vacancy rate?
- Crime grade is D in this area — have there been break-ins, vandalism, or insurance claims at this property in the last 3 years? What carrier currently insures it and at what premium?
- The area grade is low — what's the realistic commute time and amenity access for the typical tenant pool here? Any planned neighborhood developments (good or bad) we should know about?
- What's the average days-on-market for RENTAL listings here right now (not sales)? A rising rental-DOM trend means longer vacancies and softer asking-rent achievability than the comps imply.
- What's the recent tenant-quality profile in this submarket — average credit score on applications, eviction rate, late-payment / NSF rate, and stable-employment percentage? A property-management company in the area should have these aggregated.
- How much new for-sale + rental construction is in the pipeline within 1–3 miles? Heavy new supply typically softens prices + rents 12–24 months out; constrained supply supports both.
Investment metrics
- 1% rule
- 0.69% ✗
- Cap rate
- 5.58%
- Cash-on-cash
- -2.55%
- DSCR
- 0.89
- GRM
- 12.1
CMA / ARV
- ARV (median comp)
- $161,601
- List price
- $148,000
- Delta
- -7.18%
- Verdict
- FAIR
- Comps
- 20 within 1.0 mi
Show comp detail 8 sales within ~0.75 mi
| Address | Dist | Beds/Ba | Sqft | Sold | Price | $/sf | Match |
|---|---|---|---|---|---|---|---|
| 929 E Main St | 0.06mi | 3/2.0 (+1) | 1,258 (+4%) | 10mo | $165,900 | $132 | 74 |
| 681 N Pine Ave | 0.15mi | 3/1.0 (+1) | 1,124 (-7%) | 9mo | $110,000 | $98 | 69 |
| 1110 Eastwood Dr | 0.21mi | 3/1.5 (+1) | 1,134 (-6%) | 15mo | $146,500 | $129 | 60 |
| 1176 Eastwood Dr | 0.36mi | 3/2.0 (+1) | 1,321 (+9%) | 0mo | $184,000 | $139 | 59 |
| 811 E 5th St | 0.06mi | 3/2.0 (+1) | 1,376 (+14%) | 20mo | $172,000 | $125 | 48 |
| 664 Broadway Ave | 0.65mi | 3/2.0 (+1) | 1,260 (+4%) | 10mo | $171,000 | $136 | 45 |
| 1004 Cedar St | 0.40mi | 3/1.0 (+1) | 1,032 (-15%) | 11mo | $75,000 | $73 | 43 |
| 143 E 2nd St | 0.60mi | 2/1.0 | 1,092 (-10%) | 22mo | $75,000 | $69 | 37 |
Match score weights: distance 35% · size 25% · config 20% · recency 20%. Top-matched comps best support the ARV.
Projected returns pro-forma
-3.0% appreciation · 3.0% rent growth · sell at horizon
- IRR
- -20.6%
- Equity multiple
- 0.28×
- Total profit
- $-29,649
- Equity at exit
- $22,067
- IRR
- -13.9%
- Equity multiple
- 0.20×
- Total profit
- $-33,288
- Equity at exit
- $12,796
Cash invested: $41,440 (down + closing). Projections, not guarantees.
Landlord ↔ Tenant lean methodology
- Overall (STATE)
- 92 Strongly Landlord-Friendly
- State Arkansas
- 92 Strongly Landlord-Friendly · R+14
- County
- — inherits STATE
- City
- — inherits STATE
ZIP-level market 72927
- Home prices YoY
- -2.1%
- Active inventory
- 79
- Price-to-rent
- 12.1×
Monthly cashflow live
- Estimated rent
- $1,023 medium interval (Pro) →
- Mortgage (P&I)
- −$776
- Tax from tax record
- −$59 /mo · $705/yr
- Insurance
- −$62
- HOA
- −$0
- Vacancy / Maint / Mgmt
- −$215
- Net cashflow
- $-88
Break-even live
UW: 25.0% down · 7.5% · 30yr · 1.5% tax · 5.0% vac · 8.0% maint · 8.0% mgmt
Financing live
Cash to close
- Down payment
- $37,000
- Closing costs
- $4,440
- Reserves months
- —
- Total cash needed
- —
Loan-product check · same deal, 3 products live
Conventional
25% down · 7.5% · 30yr
- Down + closing
- —
- Monthly P&I
- —
- Monthly cashflow
- —
- DSCR
- —
- Eligible?
- —
Personal DTI + credit; lowest rate.
DSCR
20% down · 8.5% · 30yr
- Down + closing
- —
- Monthly P&I
- —
- Monthly cashflow
- —
- DSCR
- —
- Eligible?
- —
No personal income docs; deal must DSCR.
Hard money
10% down · 12.0% · 12mo
- Down + closing
- —
- Monthly P&I
- —
- Monthly cashflow
- —
- DSCR
- —
- Eligible?
- —
Short-term bridge; refi at stabilization.
Listing history 12 events
-
2026-06-19days on market $148,000 Active 10 DOM
-
2026-06-18days on market $148,000 Active 9 DOM
-
2026-06-17days on market $148,000 Active 8 DOM
-
2026-06-16days on market $148,000 Active 7 DOM
-
2026-06-15days on market $148,000 Active 6 DOM
-
2026-06-14days on market $148,000 Active 4 DOM
-
2026-06-12days on market $148,000 Active 3 DOM
-
2026-06-09pricedays on market $148,000 Active 1 DOM
-
2026-01-16price $150,000 378-char remark
Show marketing remark (378 chars)
2 bed 1 1/2 bath home in great shape on corner lot, close to schools, with attached carport. Covered deck in chain link fenced backyard, covered gazebo, nice concrete patio, greenhouse, & storage building. Bonus room off of laundry could serve as office or 3rd bedroom. Several recent updates including new metal roof, new HVAC, & new vinyl plank flooring all in 2019.
-
2025-09-28$160,000 Active 378-char remark
Show marketing remark (378 chars)
2 bed 1 1/2 bath home in great shape on corner lot, close to schools, with attached carport. Covered deck in chain link fenced backyard, covered gazebo, nice concrete patio, greenhouse, & storage building. Bonus room off of laundry could serve as office or 3rd bedroom. Several recent updates including new metal roof, new HVAC, & new vinyl plank flooring all in 2019.
-
2021-11-19soldstatus $60,000
-
2003-08-19soldstatus $49,000
ⓘ Source: listings_history table (triggers on properties + properties_extension) + one-shot
backfill from property_details.listing_events for pre-trigger history.
Tax reassessment forecast AR · Resets to sale price
- Current annual tax
- $705 · $59/mo
- Projected year-2 tax
- $947 · $79/mo
- Expected delta
- +$243/yr (+$20/mo · 34.4%)
ⓘ Screening estimate from a state-policy table — verify with the county assessor before closing.
Climate risk First Street
- Flood 1/10 Low FEMA zone X (unshaded) · 0% chance over 30 yrs
- Wildfire 7/10 Severe
- Heat 7/10 Severe 7 d/yr ≥114°F today · 22 d/yr by 30 yrs out
- Wind 2/10 Low 3% chance of damaging wind over 30 yrs
- Air quality 2/10 Low 0 unhealthy d/yr today · 1 by 30 yrs out
Nearby sold comps map
Loading sold comps map…
Walkable amenities ~0.75 mi
Loading nearby amenities…
Taxation est. · year 1
- Rental income
- $12,281
- − Mortgage interest
- −$8,290
- − Property taxes
- −$705
- − Insurance
- −$740
- − Repairs & maintenance
- −$982
- − Management
- −$982
- − Depreciation
- −$4,305
- Taxable loss
- −$3,724
- Est. tax savings @ 24.0%
- +$894
- After-tax cash flow
- $-162/yr
For passive investors: Depreciation is non-cash, so a rental often shows a tax loss while cash-flowing — sheltering income. Rental losses are passive: they offset passive income freely, and up to $25,000/yr can offset ordinary (W-2) income if you actively participate and your MAGI is under $100k (phasing out to $0 by $150k); unused losses carry forward. On sale, claimed depreciation is recaptured at up to 25%, and gains may owe capital-gains tax (a 1031 exchange can defer both). Figures are a year-1 estimate at your 24.0% rate — not tax advice; consult a CPA.
Schools (NCES district)
- District
- Booneville School District
- NCES district ID
- 0503450
- Math proficiency
- 33% ▼ -9.00%
- Reading proficiency
- 33% ▼ -7.00%
- Median HH income
- $36,171
- Composite
- 27.37/100
- National rank
- #6977
- State rank
- #133 of 238 in AR
Livability — Booneville
- Score
- 72/100
- State rank
- #34
- US rank
- #6310
Category grades
Schools grade is shown separately in the Schools card above.
Census & demographics
- Census place
- Booneville, AR
- Population (ZIP)
- 8,314
Population outlook (Logan County) Hauer SSP2
- Today (2025)
- 21,046 people
- By 2030
- 20,537 · -2.4%
- By 2040
- 19,443 · -7.6%
- By 2050
- 18,220 · -13.4%
- By 2075
- 16,164 · -23.2%
- By 2100
- 14,858 · -29.4%
Race, ethnicity, and origin ACS 2023
- Neighborhood character
- Predominantly White (87%)
- Race & ethnicity
- White 87% Two or more races 9% Hispanic / Latino 5% Black 3%
- Common ancestry
- Italian 2% Romanian 1% Iranian 1%
- Foreign-born
- 2% · Canada
- Languages at home
- 96% English-only · Spanish 2% German/W. Germanic 1%
Political lean MEDSL · Logan
- 2024 margin
- Solid R (+62.2) · D 17.8% · R 80.0% · Other 2.1%
- 2008→2024 swing
- -23.5pp toward R · 2008: -38.8pp · 2024: -62.2pp
- All cycles
- 2024: R+62.2 2020: R+59.5 2016: R+51.4 2012: R+41.9 2008: R+38.8
Not yet ingested
- Civics
- —
Market trends
- HPI YoY
- ▼ -4.71%
- Current HPI
- 221.23
- Rent YoY
- —
- Metro
- —
- State GDP YoY
- ▲ 3.80%
- F500 in state
- 10
Industry mix (Fortune 500 HQ in AR)
| Industry | F500 HQs | Revenue |
|---|---|---|
| Retail | 1 | $681B |
|
||
| Food / Agriculture | 1 | $53B |
|
||
| Retail / Energy | 1 | $22B |
|
||
| Transportation / Logistics | 1 | $12B |
|
||
| Energy | 1 | $4B |
|
||
Price history
+206.1% since first listed4 events — show timeline
- 2026-01-16 Price Changed $150,000 WRVBOR
- 2025-09-28 Listed $160,000 WRVBOR
- 2021-11-19 Sold (Public Records) $60,000 Public Records
- 2003-08-19 Sold (Public Records) $49,000 Public Records
Property tax history
+2.3%/yrLatest (2025): $705 · +400.9% YoY. Source: county tax records.
Cash-flow waterfall
monthlySold comps — $/sqft
last 12 mo · ≤1 miLoading sold comps…