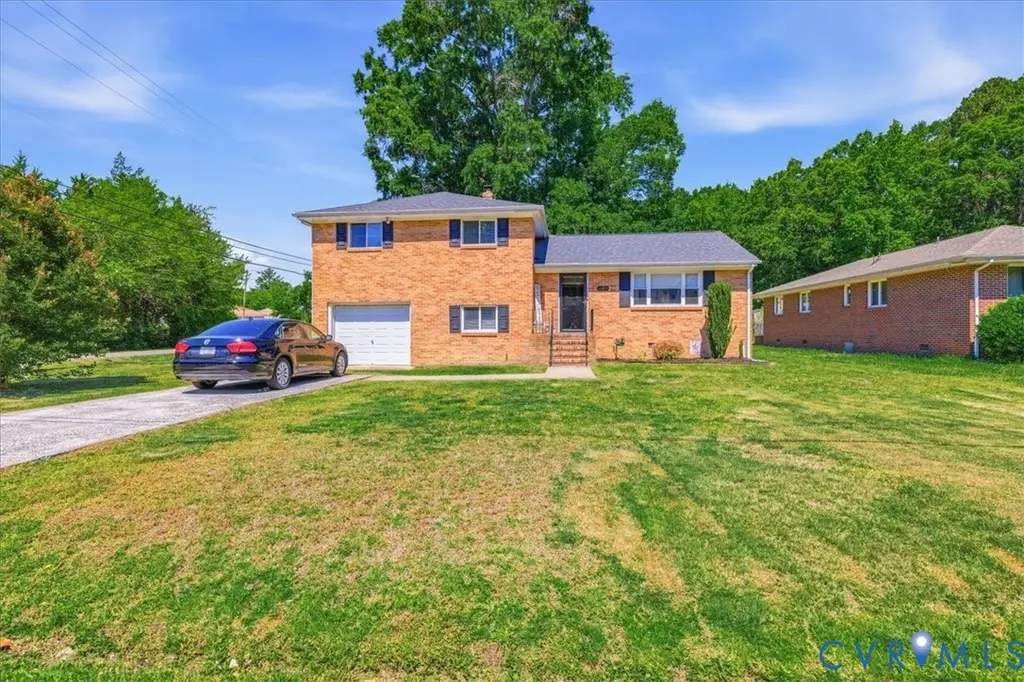
20018 Roosevelt Ave · Ettrick, VA
Flood risk 1/10 · Minimal
- FEMA flood zone
- X (unshaded)
- Chance of flooding over 30 yrs
- 0.0%
- Est. flood insurance / yr
- $507 – $1,088
Fire risk 2/10 · Minimal
- Est. fire insurance / yr
- $666 – $1,236
Heat risk 8/10 · Major
- Hot days now (above 108°F)
- 7 days/yr
- Hot days in 30 yrs
- 16 days/yr
Wind risk 6/10 · Moderate
- Chance of severe wind over 30 yrs
- 42.0%
Air-quality risk 2/10 · Minimal
- Unhealthy air days now
- 0 days/yr
- Unhealthy air days in 30 yrs
- 1 days/yr
Risk factors via First Street. Map © Google.
Why this score? — see what drove the D grade
The composite is a weighted blend of 9 inputs, each scored 0–100. Each bar is that input's sub-score; the figure is the points it added to the 100-point composite (weight × sub-score).
- ARV discount +13.1/15.0
- Cash flow +8.1/30.0
- Schools +5.2/10.0
- Rent growth +4.4/5.0
- Livability +4.0/5.0
- Condition / age +2.5/5.0
- DSCR +2.1/10.0
- 1% rule +1.8/10.0
- Appreciation +0.0/10.0
$280,000
🖨 Deal sheet (PDF) 📄 Offer letter ✓ Due diligence
Listing remarks MLS
STUNNING, JUST STUNNING RENOVATION!! Beautiful 3 Bedroom 2.5 Bath Tri-Level on South Chesterfield! ALL NEW KITCHEN with GRANITE, Tile and Stainless Steel Appliances! ALL NEW BATHS with Granite and Tile EVERYWHERE!! New Flooring, Fresh Paint!! WOW!! Attached Garage!! Close to all local restaurants and shopping!! MOVE-IN READY!
Key facts
- 9,583 sq ft lot
- Garage
- Built 1962
Property features AI
Finance
- HOA & community: Street lights in the community
Exterior
- Parking: Attached garage with direct access; Oversized garage; Driveway parking; On-street parking; Paved parking areas
- Utilities: Public water; Public sewer; Electric water heater
- Home design: 3 stories; Resale condition; Shingle roof; Brick, drywall, and frame construction; Zoned R7
- Construction: Built with brick, frame and drywall; Shingle roof
- Exterior features: Rear porch and deck; Porch; Exterior lighting; Storage and shed(s); Paved driveway; Landscaped, level yard
Interior
- Kitchen: Granite countertops; Ceramic tile counters; Deck access from kitchen; Microwave; Smooth cooktop; Stove; Dishwasher; Refrigerator
- Bedrooms: Bedroom 2 on second level with carpet, ceiling fan, and double closet; Bedroom 3 on second level with carpet, ceiling fan, and double closet; Additional bedroom on second level with full bath, carpet, and double closet
- Flooring: Ceramic tile; Partial carpet; Wood (hardwood) flooring; Hardwood in dining room and living room
- Bathrooms: Two full bathrooms; One half bathroom; Second-level full bath with tub and shower
- Heating & cooling: Central air conditioning (electric); Electric heating with heat pump
- Interior features: Ceiling fans; Separate/formal dining room; Granite counters; Primary bedroom with private bath; Recessed lighting; Finished basement with partial finish and garage access
- Laundry & utility: Washer hookup; Dryer hookup; Washer and dryer included; Utility sink; Basement laundry with garage access
Neighborhood map
What this means for you Summary
Snapshot
- This is a 3-bed/1.5-bath single-family listed at $280k.
Deal economics
- At list price, monthly cash flow is $-272 ($-3k/yr) — negative.
- To cash-flow at today's rent, offer at most $232k (17.2% below list).
- To meet the 1% rule (rent ≥ 1% of price), the offer needs to be $192k (31.6% below list).
- Recommended offer: $192k (31.6% below list) — sets the bar for 1% rule.
Location & tenants
- Location reads 79/100 on livability (#65 in VA, #2,105 nationally) — a middle-class / working-renter tenant base. Strengths: cost of living A+, health & safety A+, housing A; Watch: commute C-, amenities F, employment D-.
- Chesterfield County Public School District (suburban): math 52% / reading 64% proficiency, ranked #57 of 131 in VA (top 44%) — acceptable for families but not a draw, mixed tenant base, ~2y average lease.
- Zoned schools: Ettrick Elementary (math 32% / reading 47%, grade F, #900 of 1,108 statewide, top 83%, 500 students, 81% FRL); Matoaca Middle (math 46% / reading 48%, grade D+, #257 of 342 statewide, top 77%, 865 students, 45% FRL); Matoaca High (math 49% / reading 82%, grade B, #204 of 319 statewide, top 65%, 1,630 students, 39% FRL) — zoned schools average 55% FRL vs 26% district-wide (29 pts higher); higher-poverty schools than district average — tighter screening recommended.
- Market conditions: Rents rising fast (+7.5%/yr); 126 active listings in the ZIP; 14 comparable units currently listed for rent nearby; rentals at typical pace (median 17d on market — plan ~3-4 weeks tenant-placement turnaround); solid renter incomes; 2,307 units permitted in Chesterfield County in 2024 (462 in 5+ unit buildings).
Forward outlook
- Local home prices are declining (-3.0%/yr); year-one equity from $2k of loan paydown is wiped out by about $8k of value loss. Plan a longer hold.
- Chesterfield County population projected at +20% by 2050 — long-run rental-demand tailwind backs the buy-and-hold thesis.
Negotiation context
- It's been on market 17 days — a 2% lower offer ($276k) is reasonable based on typical stale-listing flexibility.
- 2 sale attempts since 10y ago with the ask held roughly flat each time — persistent listings suggest the price (not the market) is what's stuck; bring a comps-based counter.
- Current owner paid $155k; list at $280k implies a 81% gain — meaningful room to come down on a strong offer.
Risks & watch-outs
- Climate carrying-cost: major wind risk, 42% chance of damaging wind over 30y; extreme-heat days projected 7→16/yr by 2055 (HVAC capex compounding) — expect insurance premiums to compound above CPI over the hold.
Questions for the listing agent
- What do current leases actually rent for vs. the listed asking? Can we see a recent rent roll and the last 12 months of T-12 income?
- Built in 1962 — when were the roof, HVAC, electrical panel, plumbing, and water heater last replaced?
- Is there a deadline driving the sale (1031 exchange, divorce, estate, relocation)? That informs how much negotiation room exists.
- Schools are A-rated — typically a magnet for longer-tenancy family renters. What's the average tenant stay here, and is there a school-zone premium baked into asking?
- The area grade is low — what's the realistic commute time and amenity access for the typical tenant pool here? Any planned neighborhood developments (good or bad) we should know about?
- What's the average days-on-market for RENTAL listings here right now (not sales)? A rising rental-DOM trend means longer vacancies and softer asking-rent achievability than the comps imply.
- What's the recent tenant-quality profile in this submarket — average credit score on applications, eviction rate, late-payment / NSF rate, and stable-employment percentage? A property-management company in the area should have these aggregated.
- How much new for-sale + rental construction is in the pipeline within 1–3 miles? Heavy new supply typically softens prices + rents 12–24 months out; constrained supply supports both.
Investment metrics
- 1% rule
- 0.68% ✗
- Cap rate
- 5.13%
- Cash-on-cash
- -4.16%
- DSCR
- 0.81
- GRM
- 12.2
CMA / ARV
- ARV (median comp)
- $319,506
- List price
- $280,000
- Delta
- -12.36%
- Verdict
- UNDERPRICED
- Comps
- 20 within 1.0 mi
Show comp detail 12 sales within ~0.75 mi
| Address | Dist | Beds/Ba | Sqft | Sold | Price | $/sf | Match |
|---|---|---|---|---|---|---|---|
| 20109 College Park Ave | 0.04mi | 3/2.0 | 1,640 (-3%) | 4mo | $319,900 | $195 | 88 |
| 3020 Plumtree St | 0.23mi | 4/2.5 (+1) | 1,640 (-3%) | 3mo | $352,000 | $215 | 73 |
| 3306 E River Rd | 0.35mi | 3/3.0 | 1,741 (+3%) | 5mo | $303,000 | $174 | 69 |
| 20237 Sheffield Pl | 0.18mi | 4/2.0 (+1) | 1,874 (+11%) | 4mo | $282,000 | $150 | 63 |
| 415 Crescent Ave | 0.63mi | 3/2.0 | 1,674 (-1%) | 10mo | $286,000 | $171 | 59 |
| 19707 Walker Ave | 0.50mi | 3/2.5 | 1,554 (-8%) | 1mo | $315,000 | $203 | 59 |
| 156 W Westover Ave | 0.50mi | 3/3.5 | 1,684 (-0%) | 12mo | $329,900 | $196 | 58 |
| 186 Piedmont Ave | 0.49mi | 3/2.0 | 1,791 (+6%) | 10mo | $325,000 | $181 | 56 |
| 115 Suffolk Ave | 0.68mi | 3/1.5 | 1,504 (-11%) | 2mo | $275,000 | $183 | 49 |
| 116 Fairfax Ave | 0.64mi | 4/2.0 (+1) | 1,860 (+10%) | 2mo | $200,000 | $108 | 45 |
| 19700 Thelma Ave | 0.46mi | 4/3.0 (+1) | 1,880 (+11%) | 7mo | $375,000 | $199 | 43 |
| 407 Marvin Ave | 0.71mi | 3/2.0 | 1,912 (+13%) | 4mo | $289,950 | $152 | 39 |
Match score weights: distance 35% · size 25% · config 20% · recency 20%. Top-matched comps best support the ARV.
Projected returns pro-forma
-3.0% appreciation · 7.5% rent growth · sell at horizon
- IRR
- -18.9%
- Equity multiple
- 0.32×
- Total profit
- $-53,684
- Equity at exit
- $41,749
- IRR
- -4.7%
- Equity multiple
- 0.64×
- Total profit
- $-28,471
- Equity at exit
- $24,209
Cash invested: $78,400 (down + closing). Projections, not guarantees.
Landlord ↔ Tenant lean methodology
- Overall (STATE)
- 55 Moderately Landlord-Leaning
- State Virginia
- 55 Moderately Landlord-Leaning · D+2
- County
- — inherits STATE
- City
- — inherits STATE
ZIP-level market 23834
- Rents YoY
- 7.5%
- Active inventory
- 126
- Price-to-rent
- 12.2×
Monthly cashflow live
- Estimated rent
- $1,915 high interval (Pro) →
- Mortgage (P&I)
- −$1,468
- Tax from tax record
- −$200 /mo · $2,400/yr
- Insurance
- −$117
- HOA
- −$0
- Lot rent
- −$0
- Vacancy / Maint / Mgmt
- −$402
- Net cashflow
- $-272
Break-even live
Sensitivity live
| Price | -10% $-113 | -5% $-193 | +0% $-272 | +5% $-351 | +10% $-430 |
|---|---|---|---|---|---|
| Rent | -10% $-423 | -5% $-348 | +0% $-272 | +5% $-196 | +10% $-121 |
| Rate | -1.0pp $-131 | -0.5pp $-201 | base $-272 | +0.5pp $-344 | +1.0pp $-418 |
UW: 25.0% down · 7.5% · 30yr · 1.5% tax · 5.0% vac · 8.0% maint · 8.0% mgmt
Financing live
Cash to close
- Down payment
- $70,000
- Closing costs
- $8,400
- Reserves months
- —
- Total cash needed
- —
Loan-product check · same deal, 3 products live
Conventional
25% down · 7.5% · 30yr
- Down + closing
- —
- Monthly P&I
- —
- Monthly cashflow
- —
- DSCR
- —
- Eligible?
- —
Personal DTI + credit; lowest rate.
DSCR
20% down · 8.5% · 30yr
- Down + closing
- —
- Monthly P&I
- —
- Monthly cashflow
- —
- DSCR
- —
- Eligible?
- —
No personal income docs; deal must DSCR.
Hard money
10% down · 12.0% · 12mo
- Down + closing
- —
- Monthly P&I
- —
- Monthly cashflow
- —
- DSCR
- —
- Eligible?
- —
Short-term bridge; refi at stabilization.
Rent comps 14 comps
| Address | Beds | Baths | Sqft | Rent | $/sqft | DOM | Units | Dist |
|---|---|---|---|---|---|---|---|---|
| 114 Lee Ave Colonial Heights, VA | 2.0 | 1.5 | 1088 | $1,750 | $1.61 | 26d | 1 | 0.75mi |
| 1014 Hamilton Ave Colonial Heights, VA | 4.0 | 1.0 | 1615 | $1,891 | $1.17 | 46d | 1 | 0.95mi |
| 3716 Totty St South Chesterfield, VA | 3.0 | 1.0 | 1092 | $1,700 | $1.56 | 46d | 1 | 0.96mi |
| 500 Floral Ave Colonial Heights, VA | 3.0 | 2.0 | 1196 | $1,895 | $1.58 | 26d | 1 | 1.08mi |
| 525 James Ave Colonial Heights, VA | 3.0 | 2.0 | 1556 | $2,141 | $1.38 | 16d | 1 | 1.12mi |
| 211 Jefferson Ave Colonial Heights, VA | 4.0 | 2.0 | 1507 | $1,900 | $1.26 | 0d | 1 | 1.12mi |
| 20308 Hickory Branch Dr South Chesterfield, VA | 3.0 | 2.0 | 1484 | $1,850 | $1.25 | 5d | 1 | 1.14mi |
| 4019 Frye Ter South Chesterfield, VA | 3.0 | 2.5 | 1816 | $2,300 | $1.27 | 16d | 1 | 1.26mi |
| 147 Witten St Petersburg, VA | 3.0 | 1.0 | 1170 | $1,495 | $1.28 | 12d | 1 | 1.37mi |
| 4307 Twisted Oak Dr South Chesterfield, VA | 3.0 | 2.5 | 1530 | $2,500 | $1.63 | 0d | 1 | 1.38mi |
| 103 Sadler Ave Colonial Heights, VA | 3.0 | 1.0 | 1230 | $1,800 | $1.46 | 14d | 1 | 1.46mi |
| 919 Lakeview Ave Apt Q Colonial Heights, VA | 2.0 | 1.5 | 1250 | $1,895 | $1.52 | 12d | 1 | 1.46mi |
| 104 Brijidan Ln Colonial Heights, VA | 3.0 | 2.0 | 1355 | $2,241 | $1.65 | 12d | 1 | 1.48mi |
| 925 Lakeview Ave Unit C Colonial Heights, VA | 2.0 | 1.5 | 1080 | $1,495 | $1.38 | 46d | 1 | 1.49mi |
Listing history 12 events
-
2026-06-07pricestatusdays on market $280,000 Pending 17 DOM
-
2026-06-05days on market $290,000 Active 15 DOM
-
2026-06-03days on market $290,000 Active 14 DOM
-
2026-06-02days on market $290,000 Active 13 DOM
-
2026-06-01days on market $290,000 Active 12 DOM
-
2026-05-31days on market $290,000 Active 11 DOM
-
2026-04-28historical $290,000 1365-char remark
-
2016-10-12soldstatus $155,000
-
2016-10-11soldstatus $155,000 Closed 335-char remark
Show marketing remark (335 chars)
STUNNING, JUST STUNNING RENOVATION!! Beautiful 3 Bedroom 2.5 Bath Tri-Level on South Chesterfield! ALL NEW KITCHEN with GRANITE, Tile and Stainless Steel Appliances! ALL NEW BATHS with Granite and Tile EVERYWHERE!! New Flooring, Fresh Paint!! WOW!! Attached Garage!! Close to all local restaurants and shopping!! MOVE-IN READY!
-
2016-08-05status Pending 335-char remark
Show marketing remark (335 chars)
STUNNING, JUST STUNNING RENOVATION!! Beautiful 3 Bedroom 2.5 Bath Tri-Level on South Chesterfield! ALL NEW KITCHEN with GRANITE, Tile and Stainless Steel Appliances! ALL NEW BATHS with Granite and Tile EVERYWHERE!! New Flooring, Fresh Paint!! WOW!! Attached Garage!! Close to all local restaurants and shopping!! MOVE-IN READY!
-
2016-08-03$159,900 Active 335-char remark
Show marketing remark (335 chars)
STUNNING, JUST STUNNING RENOVATION!! Beautiful 3 Bedroom 2.5 Bath Tri-Level on South Chesterfield! ALL NEW KITCHEN with GRANITE, Tile and Stainless Steel Appliances! ALL NEW BATHS with Granite and Tile EVERYWHERE!! New Flooring, Fresh Paint!! WOW!! Attached Garage!! Close to all local restaurants and shopping!! MOVE-IN READY!
-
1998-08-19soldstatus $81,000
ⓘ Source: listings_history table (triggers on properties + properties_extension) + one-shot
backfill from property_details.listing_events for pre-trigger history.
Tax reassessment forecast VA · Resets to sale price
- Current annual tax
- $2,400 · $200/mo
- Projected year-2 tax
- $2,400 · $200/mo
- Expected delta
- $0/yr ($0/mo · 0.0%)
ⓘ Screening estimate from a state-policy table — verify with the county assessor before closing.
Climate risk First Street
- Flood 1/10 Low FEMA zone X (unshaded) · 0% chance over 30 yrs
- Wildfire 2/10 Low
- Heat 8/10 Severe 7 d/yr ≥108°F today · 16 d/yr by 30 yrs out
- Wind 6/10 Major 42% chance of damaging wind over 30 yrs
- Air quality 2/10 Low 0 unhealthy d/yr today · 1 by 30 yrs out
Nearby sold comps map
Loading sold comps map…
Walkable amenities ~0.75 mi
Loading nearby amenities…
Taxation est. · year 1
- Rental income
- $22,985
- − Mortgage interest
- −$15,684
- − Property taxes
- −$2,400
- − Insurance
- −$1,400
- − Repairs & maintenance
- −$1,839
- − Management
- −$1,839
- − Depreciation
- −$8,145
- Taxable loss
- −$8,323
- Est. tax savings @ 24.0%
- +$1,997
- After-tax cash flow
- $-1,265/yr
For passive investors: Depreciation is non-cash, so a rental often shows a tax loss while cash-flowing — sheltering income. Rental losses are passive: they offset passive income freely, and up to $25,000/yr can offset ordinary (W-2) income if you actively participate and your MAGI is under $100k (phasing out to $0 by $150k); unused losses carry forward. On sale, claimed depreciation is recaptured at up to 25%, and gains may owe capital-gains tax (a 1031 exchange can defer both). Figures are a year-1 estimate at your 24.0% rate — not tax advice; consult a CPA.
Schools (NCES district)
- District
- Chesterfield County Public School District
- NCES district ID
- 5100840
- Math proficiency
- 52% ▼ -30.00%
- Reading proficiency
- 64% ▼ -15.00%
- Median HH income
- $72,821
- Composite
- 51.56/100
- National rank
- #1712
- State rank
- #57 of 131 in VA
Livability — Ettrick
- Score
- 79/100
- State rank
- #65
- US rank
- #2105
Category grades
Schools grade is shown separately in the Schools card above.
Census & demographics
- Census place
- Ettrick, VA
- County
- Chesterfield County · 406,988 people
- City population
- 26,628
- Metro
- Richmond, VA
- Population (ZIP)
- 26,628
- Household income
- $84,338
- Rent vs Own
- Severe rent burden
- 814.0
Population outlook (Chesterfield County) Hauer SSP2
- Today (2025)
- 377,190 people
- By 2030
- 395,710 · +4.9%
- By 2040
- 427,694 · +13.4%
- By 2050
- 452,706 · +20.0%
- By 2075
- 505,533 · +34.0%
- By 2100
- 521,282 · +38.2%
Race, ethnicity, and origin ACS 2023
- Neighborhood character
- Majority White (63%)
- Race & ethnicity
- White 63% Black 22% Hispanic / Latino 8% Two or more races 5% Asian 3%
- Hispanic origin (detail)
- Mexican 3% Puerto Rican 3%
- Common ancestry
- Serbian 2% Slovak 2% Lithuanian 2%
- Foreign-born
- 7% · Canada, China, South Korea
- Languages at home
- 91% English-only · Spanish 5% Other Indo-European 2% Korean 1%
Political lean MEDSL · Chesterfield
- 2024 margin
- Lean D (+9.0) · D 53.8% · R 44.8% · Other 1.4%
- 2008→2024 swing
- +16.4pp toward D · 2008: -7.5pp · 2024: 9.0pp
- All cycles
- 2024: D+9.0 2020: D+6.7 2016: R+2.2 2012: R+7.1 2008: R+7.5
Not yet ingested
- Civics
- —
Market trends
- HPI YoY
- ▼ -212.28%
- Current HPI
- 294.4478
- Rent YoY
- ▲ 7.50%
- Metro
- Richmond, VA
- State GDP YoY
- ▲ 2.40%
- F500 in state
- 50
Industry mix (Fortune 500 HQ in VA)
| Industry | F500 HQs | Revenue |
|---|---|---|
| Aerospace / Defense | 4 | $236B |
|
||
| Technology / Defense | 3 | $32B |
|
||
| Financial Services | 2 | $176B |
|
||
| Utilities | 2 | $27B |
|
||
| Insurance | 2 | $25B |
|
||
| Technology | 2 | $15B |
|
||
Price history
+245.7% since first listed9 events — show timeline
- 2026-06-07 Pending — CVRMLS
- 2026-06-05 Price Changed $280,000 CVRMLS
- 2026-05-20 Listed $290,000 CVRMLS
- 2026-04-28 Coming Soon $290,000 CVRMLS
- 2016-10-12 Sold (Public Records) $155,000 Public Records
- 2016-10-11 Sold (MLS) $155,000 CVRMLS
- 2016-08-05 Pending — CVRMLS
- 2016-08-03 Listed $159,900 CVRMLS
- 1998-08-19 Sold (Public Records) $81,000 Public Records
Property tax history
+5.0%/yrLatest (2025): $2,400 · -0.4% YoY. Source: county tax records.
Cash-flow waterfall
monthlySold comps — $/sqft
last 12 mo · ≤1 miLoading sold comps…