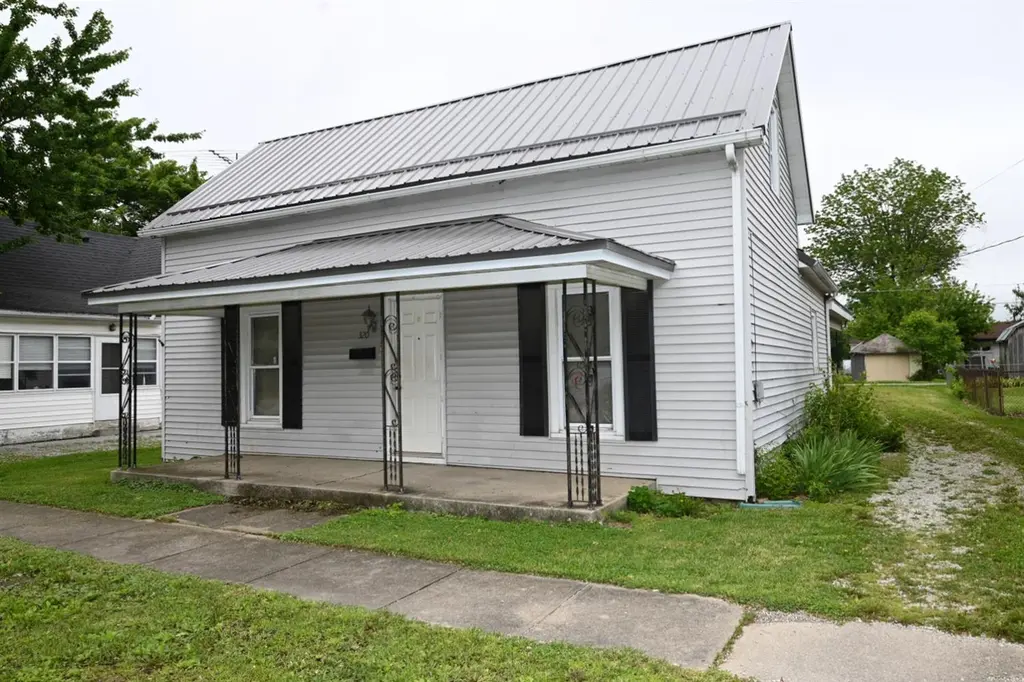
320 N Sycamore St · Osgood, IN
Flood risk 1/10 · Minimal
- FEMA flood zone
- X (unshaded)
- Chance of flooding over 30 yrs
- 0.0%
- Est. flood insurance / yr
- $507 – $1,088
Fire risk 1/10 · Minimal
- Est. fire insurance / yr
- $717 – $1,331
Heat risk 4/10 · Minor
- Hot days now (above 102°F)
- 7 days/yr
- Hot days in 30 yrs
- 20 days/yr
Wind risk 2/10 · Minimal
- Chance of severe wind over 30 yrs
- 1.0%
Air-quality risk 2/10 · Minimal
- Unhealthy air days now
- 1 days/yr
- Unhealthy air days in 30 yrs
- 1 days/yr
Risk factors via First Street. Map © Google.
Why this score? — see what drove the B grade
The composite is a weighted blend of 9 inputs, each scored 0–100. Each bar is that input's sub-score; the figure is the points it added to the 100-point composite (weight × sub-score).
- Cash flow +26.0/30.0
- Appreciation +10.0/10.0
- DSCR +8.7/10.0
- ARV discount +7.5/15.0
- 1% rule +6.3/10.0
- Livability +3.6/5.0
- Schools +3.1/10.0
- Rent growth +2.5/5.0
- Condition / age +2.5/5.0
$115,000
🖨 Deal sheet (PDF) 📄 Offer letter ✓ Due diligence
Listing remarks MLS
This home offers large family room, bonus room and unfinished attic, lots of storage, vinyl siding and windows, oversized 2 car detached garage.Property is sold "AS-IS" including any existing appliances, plumbing, heating and air conditioning and electrical systems.
Key facts
- Metal roof
- 6,098 sq ft lot
- Built 1865
Tags
Property features AI
Exterior
- Parking: Gravel off-street parking
- Utilities: Public water; Public sewer; Natural gas available
- Home design: Single-family residence; Two-story
- Construction: Vinyl siding
- Exterior features: Metal roof; Lot dimensions 50 x 125
Interior
- Bathrooms: 1 full bathroom
- Heating & cooling: No heating system
- Interior features: Electric water heater
Neighborhood map
What this means for you Summary
Snapshot
- This is a 4-bed/1.0-bath single-family listed at $115k.
Deal economics
- At list price, monthly cash flow is $285 ($3k/yr) — positive.
- The deal already cash-flows at list — no discount required.
- Meets the 1% rule at list price ($1k rent vs $115k).
- Recommended offer: $113k (1.5% below list) — sets the bar for market timing.
Location & tenants
- Location reads 71/100 on livability (#134 in IN) — a middle-class / working-renter tenant base. Strengths: crime A+, cost of living A+, housing A+; Watch: employment D+, amenities F, commute F.
- Jac-Cen-Del Community School Corporation (rural): math 32% / reading 40% proficiency, ranked #185 of 301 in IN (top 62%) — families likely to look elsewhere, expect single-tenant / working-renter base with shorter leases.
- Zoned schools: Jac-Cen-Del Elementary School (math 36% / reading 36%, grade F, #577 of 994 statewide, top 59%, 390 students, 55% FRL); Jac-Cen-Del Ms/Hs (math 27% / reading 42%, grade F, #270 of 369 statewide, top 77%, 383 students, 49% FRL) — zoned schools average 52% FRL vs 33% district-wide (19 pts higher); higher-poverty schools than district average — tighter screening recommended.
- Market conditions: 19 active listings in the ZIP; 110 units permitted in Ripley County in 2024 (0 in 5+ unit buildings).
Forward outlook
- In year one you build about $12k of equity ($795 loan paydown + $12k appreciation (10.0% local appreciation)).
- Ripley County population projected at -10% by 2050 — secular population decline; favor cash flow + early exit over multi-decade hold.
- At projected returns (10.0% appreciation + 3.0% rent growth), your $32k cash investment doubles in ~2 years — after that, you're playing with house money.
- By year 3, paydown + projected appreciation supports a ~$31k cash-out refi (75% LTV) — recoverable capital for the next deal without selling this one.
Negotiation context
- It's been on market 28 days — a 2% lower offer ($113k) is reasonable based on typical stale-listing flexibility.
- 2 sale attempts since 14y ago with the ask held roughly flat each time — persistent listings suggest the price (not the market) is what's stuck; bring a comps-based counter.
- Current owner paid $25k; list at $115k implies a 360% gain — meaningful room to come down on a strong offer.
Risks & watch-outs
- Watch-outs: built in 1865 — expect roof / HVAC / electrical / plumbing capex.
Questions for the listing agent
- Built in 1865 — when were the roof, HVAC, electrical panel, plumbing, and water heater last replaced?
- Is there a deadline driving the sale (1031 exchange, divorce, estate, relocation)? That informs how much negotiation room exists.
- Schools are D-rated, which usually means shorter tenancies and higher turnover. Who's the typical renter profile here, and what's been the actual vacancy rate?
- What's the average days-on-market for RENTAL listings here right now (not sales)? A rising rental-DOM trend means longer vacancies and softer asking-rent achievability than the comps imply.
- What's the recent tenant-quality profile in this submarket — average credit score on applications, eviction rate, late-payment / NSF rate, and stable-employment percentage? A property-management company in the area should have these aggregated.
- How much new for-sale + rental construction is in the pipeline within 1–3 miles? Heavy new supply typically softens prices + rents 12–24 months out; constrained supply supports both.
Investment metrics
- 1% rule
- 1.13% ✓
- Cap rate
- 9.27%
- Cash-on-cash
- 10.63%
- DSCR
- 1.47
- GRM
- 7.4
CMA / ARV
- ARV (on-the-fly)
- $271,432
- Comps found
- 4
Show comp detail 4 sales within ~0.75 mi
| Address | Dist | Beds/Ba | Sqft | Sold | Price | $/sf | Match |
|---|---|---|---|---|---|---|---|
| 246 N Sycamore St | 0.04mi | 3/2.0 (-1) | 2,230 (+8%) | 6mo | $292,500 | $131 | 71 |
| 405 N Walnut St | 0.11mi | 3/1.5 (-1) | 2,136 (+3%) | 14mo | $215,000 | $101 | 71 |
| 227 S Walnut St | 0.29mi | 3/2.0 (-1) | 1,936 (-7%) | 9mo | $200,000 | $103 | 59 |
| 1010 N Buckeye St | 0.52mi | 3/2.0 (-1) | 1,885 (-9%) | 14mo | $329,900 | $175 | 40 |
Match score weights: distance 35% · size 25% · config 20% · recency 20%. Top-matched comps best support the ARV.
Projected returns pro-forma
10.0% appreciation · 3.0% rent growth · sell at horizon
- IRR
- 32.1%
- Equity multiple
- 3.51×
- Total profit
- $80,781
- Equity at exit
- $103,601
- IRR
- 27.7%
- Equity multiple
- 7.94×
- Total profit
- $223,578
- Equity at exit
- $223,420
Cash invested: $32,200 (down + closing). Projections, not guarantees.
Landlord ↔ Tenant lean methodology
- Overall (STATE)
- 90 Strongly Landlord-Friendly
- State Indiana
- 90 Strongly Landlord-Friendly · R+11
- County
- — inherits STATE
- City
- — inherits STATE
ZIP-level market 47037
- Home prices YoY
- 5.4%
- Active inventory
- 19
- Price-to-rent
- 7.4×
Monthly cashflow live
- Estimated rent
- $1,299 medium interval (Pro) →
- Mortgage (P&I)
- −$603
- Tax from tax record
- −$90 /mo · $1,084/yr
- Insurance
- −$48
- HOA
- −$0
- Vacancy / Maint / Mgmt
- −$273
- Net cashflow
- $285
Break-even live
Sensitivity live
| Price | -10% $350 | -5% $318 | +0% $285 | +5% $253 | +10% $220 |
|---|---|---|---|---|---|
| Rent | -10% $183 | -5% $234 | +0% $285 | +5% $336 | +10% $388 |
| Rate | -1.0pp $343 | -0.5pp $314 | base $285 | +0.5pp $255 | +1.0pp $225 |
UW: 25.0% down · 7.5% · 30yr · 1.5% tax · 5.0% vac · 8.0% maint · 8.0% mgmt
Financing live
Cash to close
- Down payment
- $28,750
- Closing costs
- $3,450
- Reserves months
- —
- Total cash needed
- —
Loan-product check · same deal, 3 products live
Conventional
25% down · 7.5% · 30yr
- Down + closing
- —
- Monthly P&I
- —
- Monthly cashflow
- —
- DSCR
- —
- Eligible?
- —
Personal DTI + credit; lowest rate.
DSCR
20% down · 8.5% · 30yr
- Down + closing
- —
- Monthly P&I
- —
- Monthly cashflow
- —
- DSCR
- —
- Eligible?
- —
No personal income docs; deal must DSCR.
Hard money
10% down · 12.0% · 12mo
- Down + closing
- —
- Monthly P&I
- —
- Monthly cashflow
- —
- DSCR
- —
- Eligible?
- —
Short-term bridge; refi at stabilization.
Listing history 20 events
-
2026-06-21days on market $115,000 Active 28 DOM
-
2026-06-18days on market $115,000 Active 26 DOM
-
2026-06-17days on market $115,000 Active 25 DOM
-
2026-06-16days on market $115,000 Active 24 DOM
-
2026-06-15days on market $115,000 Active 23 DOM
-
2026-06-13days on market $115,000 Active 21 DOM
-
2026-06-12days on market $115,000 Active 20 DOM
-
2026-06-09days on market $115,000 Active 17 DOM
-
2026-06-08days on market $115,000 Active 16 DOM
-
2026-06-07days on market $115,000 Active 15 DOM
-
2026-06-05days on market $115,000 Active 13 DOM
-
2026-06-04days on market $115,000 Active 11 DOM
-
2026-06-02days on market $115,000 Active 10 DOM
-
2026-06-01days on market $115,000 Active 9 DOM
-
2026-05-31days on market $115,000 Active 8 DOM
-
2026-05-31days on market $115,000 Active 7 DOM
-
2026-05-22$115,000 Active
-
2013-04-12historical 277-char remark
Show marketing remark (277 chars)
This home offers large family room, bonus room and unfinished attic, lots of storage, vinyl siding and windows, oversized 2 car detached garage.Property is sold "AS-IS" including any existing appliances, plumbing, heating and air conditioning and electrical systems.
-
2013-04-12soldstatus $25,000 277-char remark
Show marketing remark (277 chars)
This home offers large family room, bonus room and unfinished attic, lots of storage, vinyl siding and windows, oversized 2 car detached garage.Property is sold "AS-IS" including any existing appliances, plumbing, heating and air conditioning and electrical systems.
-
2012-09-14$30,000 277-char remark
Show marketing remark (277 chars)
This home offers large family room, bonus room and unfinished attic, lots of storage, vinyl siding and windows, oversized 2 car detached garage.Property is sold "AS-IS" including any existing appliances, plumbing, heating and air conditioning and electrical systems.
ⓘ Source: listings_history table (triggers on properties + properties_extension) + one-shot
backfill from property_details.listing_events for pre-trigger history.
Tax reassessment forecast IN · Partial reset (capped growth)
- Current annual tax
- $1,084 · $90/mo
- Projected year-2 tax
- $1,084 · $90/mo
- Expected delta
- $0/yr ($0/mo · 0.0%)
ⓘ Screening estimate from a state-policy table — verify with the county assessor before closing.
Climate risk First Street
- Flood 1/10 Low FEMA zone X (unshaded) · 0% chance over 30 yrs
- Wildfire 1/10 Low
- Heat 4/10 Moderate 7 d/yr ≥102°F today · 20 d/yr by 30 yrs out
- Wind 2/10 Low 100% chance of damaging wind over 30 yrs
- Air quality 2/10 Low 1 unhealthy d/yr today · 1 by 30 yrs out
Nearby sold comps map
Loading sold comps map…
Walkable amenities ~0.75 mi
Loading nearby amenities…
Taxation est. · year 1
- Rental income
- $15,592
- − Mortgage interest
- −$6,442
- − Property taxes
- −$1,084
- − Insurance
- −$575
- − Repairs & maintenance
- −$1,247
- − Management
- −$1,247
- − Depreciation
- −$3,345
- Taxable income
- $1,651
- Est. tax owed @ 24.0%
- −$396
- After-tax cash flow
- $3,026/yr
For passive investors: Depreciation is non-cash, so a rental often shows a tax loss while cash-flowing — sheltering income. Rental losses are passive: they offset passive income freely, and up to $25,000/yr can offset ordinary (W-2) income if you actively participate and your MAGI is under $100k (phasing out to $0 by $150k); unused losses carry forward. On sale, claimed depreciation is recaptured at up to 25%, and gains may owe capital-gains tax (a 1031 exchange can defer both). Figures are a year-1 estimate at your 24.0% rate — not tax advice; consult a CPA.
Schools (NCES district)
- District
- Jac-Cen-Del Community School Corporation
- NCES district ID
- 1804800
- Math proficiency
- 32% ▼ -14.00%
- Reading proficiency
- 40% ▼ -8.00%
- Median HH income
- $46,674
- Composite
- 30.83/100
- National rank
- #6133
- State rank
- #185 of 301 in IN
Livability — Osgood
- Score
- 71/100
- State rank
- #134
- US rank
- #6966
Category grades
Schools grade is shown separately in the Schools card above.
Census & demographics
- Census place
- Osgood, IN
- Population (ZIP)
- 4,289
Population outlook (Ripley County) Hauer SSP2
- Today (2025)
- 28,713 people
- By 2030
- 28,400 · -1.1%
- By 2040
- 27,288 · -5.0%
- By 2050
- 25,691 · -10.5%
- By 2075
- 22,222 · -22.6%
- By 2100
- 17,965 · -37.4%
Race, ethnicity, and origin ACS 2023
- Neighborhood character
- Predominantly White (94%)
- Race & ethnicity
- White 94% Hispanic / Latino 2% Asian 2% Two or more races 1%
- Common ancestry
- Slovak 2% Lithuanian 2%
- Foreign-born
- 2% · Canada
- Languages at home
- 98% English-only · Other Indo-European 2%
Political lean MEDSL · Ripley
- 2024 margin
- Solid R (+61.5) · D 18.6% · R 80.1% · Other 1.2%
- 2008→2024 swing
- -31.9pp toward R · 2008: -29.6pp · 2024: -61.5pp
- All cycles
- 2024: R+61.5 2020: R+59.5 2016: R+57.4 2012: R+38.6 2008: R+29.6
Not yet ingested
- Civics
- —
Market trends
- HPI YoY
- ▲ 13.68%
- Current HPI
- 267.94
- Rent YoY
- —
- Metro
- —
- State GDP YoY
- ▲ 2.90%
- F500 in state
- 18
Industry mix (Fortune 500 HQ in IN)
| Industry | F500 HQs | Revenue |
|---|---|---|
| Industrial Machinery | 2 | $37B |
|
||
| Healthcare | 1 | $177B |
|
||
| Pharmaceuticals | 1 | $45B |
|
||
| Metals / Steel | 1 | $18B |
|
||
| Agriculture | 1 | $17B |
|
||
| Packaging | 1 | $12B |
|
||
Price history
+283.3% since first listed4 events — show timeline
- 2026-05-22 Listed $115,000 SEIBR
- 2013-04-12 Listing Removed — MIBOR as Distributed by MLS Grid
- 2013-04-12 Sold (MLS) $25,000 MIBOR as Distributed by MLS Grid
- 2012-09-14 Listed $30,000 MIBOR as Distributed by MLS Grid
Property tax history
+0.4%/yrLatest (2024): $1,084 · +4.4% YoY. Source: county tax records.
Cash-flow waterfall
monthlySold comps — $/sqft
last 12 mo · ≤1 miLoading sold comps…