6598 State Highway 12 · Norwich, NY
Flood risk 4/10 · Minor
- FEMA flood zone
- X (unshaded)
- Chance of flooding over 30 yrs
- 0.24%
- Est. flood insurance / yr
- $473 – $860
Fire risk 1/10 · Minimal
- Est. fire insurance / yr
- $691 – $1,283
Heat risk 2/10 · Minimal
- Hot days now (above 94°F)
- 7 days/yr
- Hot days in 30 yrs
- 16 days/yr
Wind risk 2/10 · Minimal
- Chance of severe wind over 30 yrs
- 1.0%
Air-quality risk 1/10 · Minimal
- Unhealthy air days now
- 0 days/yr
- Unhealthy air days in 30 yrs
- 0 days/yr
Risk factors via First Street. Map © Google.
Why this score? — see what drove the B grade
The composite is a weighted blend of 9 inputs, each scored 0–100. Each bar is that input's sub-score; the figure is the points it added to the 100-point composite (weight × sub-score).
- Cash flow +25.2/30.0
- Appreciation +10.0/10.0
- DSCR +8.3/10.0
- 1% rule +7.6/10.0
- ARV discount +7.5/15.0
- Schools +3.6/10.0
- Livability +3.5/5.0
- Rent growth +2.5/5.0
- Condition / age +2.5/5.0
$125,000
🖨 Deal sheet 📄 Offer letter ✓ Due diligence
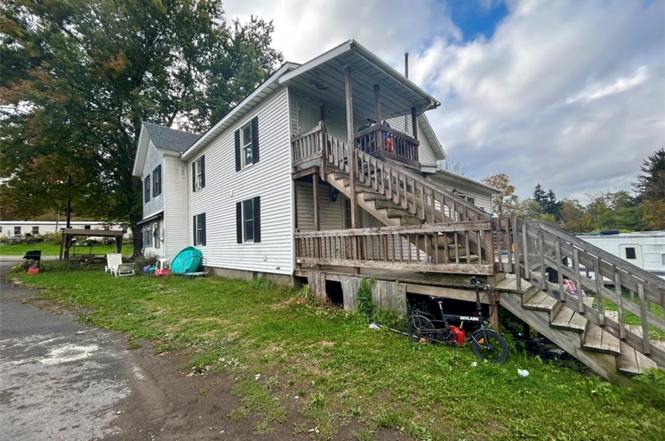
Listing remarks
Investment opportunity, commence! 3 two bedroom apartments & a Commercial Garage measuring 11x71. Endless possibilities for this property that comes with over 13 ACRES! Located on the main road with heavy traffic to send your business soaring. Lower unit has sliding glass doors that lead to a back deck, fully enclosed, Washer; Dryer Hook ups in 2 of the 3 units. Plenty of parking for tenants & the Commercial Garage. Property leads back to the river, great for fishing, atv's, hunting. 1 hour 28 mins (64 miles) to Syracuse International Airport, 6 mins(3 miles) to Hospital/ER/Helicopter Pad & 1 hour (47 miles) to Vestal Parkway in Binghamton. We're so excited for you to see
Key facts
- Plenty of parking
- Over 13 acres
- Back deck
Tags
Neighborhood map
What this means for you Summary
Snapshot
- This is a 4-bed/3.0-bath single-family listed at $125k.
Deal economics
- At list price, monthly cash flow is $279 ($3k/yr) — positive.
- The deal already cash-flows at list — no discount required.
- Meets the 1% rule at list price ($2k rent vs $125k).
- Recommended offer: $121k (3.0% below list) — sets the bar for market timing.
- Cap rate 9.0% vs local median 4.1% in Norwich — top-decile yield for the area; either an underpriced asset or a hidden risk that comps aren't pricing in. Stress-test before assuming the spread holds.
Location & tenants
- Location reads 70/100 on livability (#447 in NY) — a middle-class / working-renter tenant base. Strengths: cost of living A+, housing A+, health & safety A+; Watch: crime D, amenities F, commute F.
- Sherburne-Earlville Central School District (rural): math 34% / reading 51% proficiency, ranked #492 of 590 in NY (top 83%) — families likely to look elsewhere, expect single-tenant / working-renter base with shorter leases.
- Market conditions: 84 active listings in the ZIP; 151 units permitted in Chenango County in 2024 (96 in 5+ unit buildings).
Forward outlook
- In year one you build about $13k of equity ($864 loan paydown + $12k appreciation (10.0% local appreciation)).
- Chenango County population projected at -26% by 2050 — secular population decline; favor cash flow + early exit over multi-decade hold.
- At projected returns (10.0% appreciation + 3.0% rent growth), your $35k cash investment doubles in ~2 years — after that, you're playing with house money.
- By year 3, paydown + projected appreciation supports a ~$34k cash-out refi (75% LTV) — recoverable capital for the next deal without selling this one.
Negotiation context
- It's been on market 41 days — a 3% lower offer ($121k) is reasonable based on typical stale-listing flexibility.
Risks & watch-outs
- Watch-outs: built in 1900 — expect roof / HVAC / electrical / plumbing capex.
Questions for the listing agent
- It's been on market 41 days. Have you received any prior offers? Is the seller open to a 3% concession, seller financing, or rate buy-down credit?
- Built in 1900 — when were the roof, HVAC, electrical panel, plumbing, and water heater last replaced?
- Is there a deadline driving the sale (1031 exchange, divorce, estate, relocation)? That informs how much negotiation room exists.
- Crime grade is D in this area — have there been break-ins, vandalism, or insurance claims at this property in the last 3 years? What carrier currently insures it and at what premium?
- What's the average days-on-market for RENTAL listings here right now (not sales)? A rising rental-DOM trend means longer vacancies and softer asking-rent achievability than the comps imply.
- What's the recent tenant-quality profile in this submarket — average credit score on applications, eviction rate, late-payment / NSF rate, and stable-employment percentage? A property-management company in the area should have these aggregated.
- How much new for-sale + rental construction is in the pipeline within 1–3 miles? Heavy new supply typically softens prices + rents 12–24 months out; constrained supply supports both.
Investment metrics
- 1% rule
- 1.26% ✓
- Cap rate
- 8.97%
- Cash-on-cash
- 9.55%
- DSCR
- 1.43
- GRM
- 6.6
CMA / ARV
No comps found within radius.
Projected returns pro-forma
10.0% appreciation · 3.0% rent growth · sell at horizon
- IRR
- 31.3%
- Equity multiple
- 3.45×
- Total profit
- $85,913
- Equity at exit
- $112,610
- IRR
- 27.1%
- Equity multiple
- 7.83×
- Total profit
- $239,217
- Equity at exit
- $242,848
Cash invested: $35,000 (down + closing). Projections, not guarantees.
Landlord ↔ Tenant lean methodology
- Overall (STATE)
- 15 Strongly Tenant-Friendly
- State New York
- 15 Strongly Tenant-Friendly · D+10
- County
- — inherits STATE
- City
- — inherits STATE
ZIP-level market 13815
- Home prices YoY
- 8.2%
- Active inventory
- 84
- Price-to-rent
- 6.6×
Monthly cashflow live
- Estimated rent
- $1,577 medium interval (Pro) →
- Mortgage (P&I)
- −$656
- Tax from tax record
- −$259 /mo · $3,113/yr
- Insurance
- −$52
- HOA
- −$0
- Vacancy / Maint / Mgmt
- −$331
- Net cashflow
- $279
Break-even live
UW: 25.0% down · 7.5% · 30yr · 1.5% tax · 5.0% vac · 8.0% maint · 8.0% mgmt
Financing live
Cash to close
- Down payment
- $31,250
- Closing costs
- $3,750
- Reserves months
- —
- Total cash needed
- —
Loan-product check · same deal, 3 products live
Conventional
25% down · 7.5% · 30yr
- Down + closing
- —
- Monthly P&I
- —
- Monthly cashflow
- —
- DSCR
- —
- Eligible?
- —
Personal DTI + credit; lowest rate.
DSCR
20% down · 8.5% · 30yr
- Down + closing
- —
- Monthly P&I
- —
- Monthly cashflow
- —
- DSCR
- —
- Eligible?
- —
No personal income docs; deal must DSCR.
Hard money
10% down · 12.0% · 12mo
- Down + closing
- —
- Monthly P&I
- —
- Monthly cashflow
- —
- DSCR
- —
- Eligible?
- —
Short-term bridge; refi at stabilization.
Listing history 3 events
-
2025-11-11status Pending
-
2025-10-16price $125,000
-
2025-10-01$135,000 Active
ⓘ Source: listings_history table (triggers on properties + properties_extension) + one-shot
backfill from property_details.listing_events for pre-trigger history.
Tax reassessment forecast NY · Partial reset (capped growth)
- Current annual tax
- $3,113 · $259/mo
- Projected year-2 tax
- $3,113 · $259/mo
- Expected delta
- $0/yr ($0/mo · 0.0%)
ⓘ Screening estimate from a state-policy table — verify with the county assessor before closing.
Climate risk First Street
- Flood 4/10 Moderate FEMA zone X (unshaded) · 24% chance over 30 yrs
- Wildfire 1/10 Low
- Heat 2/10 Low 7 d/yr ≥94°F today · 16 d/yr by 30 yrs out
- Wind 2/10 Low 100% chance of damaging wind over 30 yrs
- Air quality 1/10 Low 0 unhealthy d/yr today · 0 by 30 yrs out
Nearby sold comps map
Loading sold comps map…
Walkable amenities ~0.75 mi
Loading nearby amenities…
Taxation est. · year 1
- Rental income
- $18,922
- − Mortgage interest
- −$7,002
- − Property taxes
- −$3,113
- − Insurance
- −$625
- − Repairs & maintenance
- −$1,514
- − Management
- −$1,514
- − Depreciation
- −$3,636
- Taxable income
- $1,518
- Est. tax owed @ 24.0%
- −$364
- After-tax cash flow
- $2,980/yr
For passive investors: Depreciation is non-cash, so a rental often shows a tax loss while cash-flowing — sheltering income. Rental losses are passive: they offset passive income freely, and up to $25,000/yr can offset ordinary (W-2) income if you actively participate and your MAGI is under $100k (phasing out to $0 by $150k); unused losses carry forward. On sale, claimed depreciation is recaptured at up to 25%, and gains may owe capital-gains tax (a 1031 exchange can defer both). Figures are a year-1 estimate at your 24.0% rate — not tax advice; consult a CPA.
Schools (NCES district)
- District
- Sherburne-Earlville Central School District
- NCES district ID
- 3626700
- Math proficiency
- 34% ▼ -8.00%
- Reading proficiency
- 51% ▲ 12.00%
- Median HH income
- $47,060
- Composite
- 36.22/100
- National rank
- #4725
- State rank
- #492 of 590 in NY
Livability — Norwich
- Score
- 70/100
- State rank
- #447
- US rank
- #7857
Category grades
Schools grade is shown separately in the Schools card above.
Census & demographics
- City population
- 12,855
- Population (ZIP)
- 12,855
Population outlook (Chenango County) Hauer SSP2
- Today (2025)
- 45,669 people
- By 2030
- 43,484 · -4.8%
- By 2040
- 38,774 · -15.1%
- By 2050
- 34,000 · -25.6%
- By 2075
- 24,637 · -46.1%
- By 2100
- 16,452 · -64.0%
Race, ethnicity, and origin ACS 2023
- Neighborhood character
- Predominantly White (90%)
- Race & ethnicity
- White 90% Hispanic / Latino 5% Two or more races 4%
- Common ancestry
- Lithuanian 3% Slovak 2% Iranian 2%
- Foreign-born
- 4% · Canada
- Languages at home
- 95% English-only · Spanish 3% German/W. Germanic 0%
Political lean MEDSL · Chenango
- 2024 margin
- Strong R (+27.2) · D 36.4% · R 63.6%
- 2008→2024 swing
- -26.1pp toward R · 2008: -1.1pp · 2024: -27.2pp
- All cycles
- 2024: R+27.2 2020: R+23.3 2016: R+28.1 2012: R+3.4 2008: R+1.1
Not yet ingested
- Civics
- —
Market trends
- HPI YoY
- ▲ 21.23%
- Current HPI
- 280.463
- Rent YoY
- —
- Metro
- —
- State GDP YoY
- ▲ 2.60%
- F500 in state
- 92
Industry mix (Fortune 500 HQ in NY)
| Industry | F500 HQs | Revenue |
|---|---|---|
| Financial Services | 10 | $950B |
|
||
| Consumer Goods | 9 | $162B |
|
||
| Insurance | 4 | $225B |
|
||
| Telecommunications | 2 | $144B |
|
||
| Pharmaceuticals | 2 | $112B |
|
||
| Media / Entertainment | 2 | $69B |
|
||
Price history
-7.4% since first listed3 events — show timeline
- 2025-11-11 Pending — UNYREIS
- 2025-10-16 Price Changed $125,000 UNYREIS
- 2025-10-01 Listed $135,000 UNYREIS
Property tax history
+0.7%/yrLatest (2025): $3,113 · +0.6% YoY. Source: county tax records.
Cash-flow waterfall
monthlySold comps — $/sqft
last 12 mo · ≤1 miLoading sold comps…