3613 Bonstead Rd · Radisson, NY
Flood risk 9/10 · Severe
- FEMA flood zone
- X (shaded)
- Chance of flooding over 30 yrs
- 0.99%
- Est. flood insurance / yr
- $507 – $1,088
Fire risk 1/10 · Minimal
- Est. fire insurance / yr
- $691 – $1,283
Heat risk 2/10 · Minimal
- Hot days now (above 96°F)
- 6 days/yr
- Hot days in 30 yrs
- 14 days/yr
Wind risk 1/10 · Minimal
- Chance of severe wind over 30 yrs
- 1.0%
Air-quality risk 2/10 · Minimal
- Unhealthy air days now
- 1 days/yr
- Unhealthy air days in 30 yrs
- 1 days/yr
Risk factors via First Street. Map © Google.
Why this score? — see what drove the B- grade
The composite is a weighted blend of 9 inputs, each scored 0–100. Each bar is that input's sub-score; the figure is the points it added to the 100-point composite (weight × sub-score).
- Cash flow +30.0/30.0
- 1% rule +10.0/10.0
- DSCR +10.0/10.0
- ARV discount +7.5/15.0
- Schools +4.1/10.0
- Rent growth +2.5/5.0
- Livability +2.5/5.0
- Condition / age +2.5/5.0
- Appreciation +0.0/10.0
$114,950
🖨 Deal sheet (PDF) 📄 Offer letter ✓ Due diligence
Listing remarks MLS
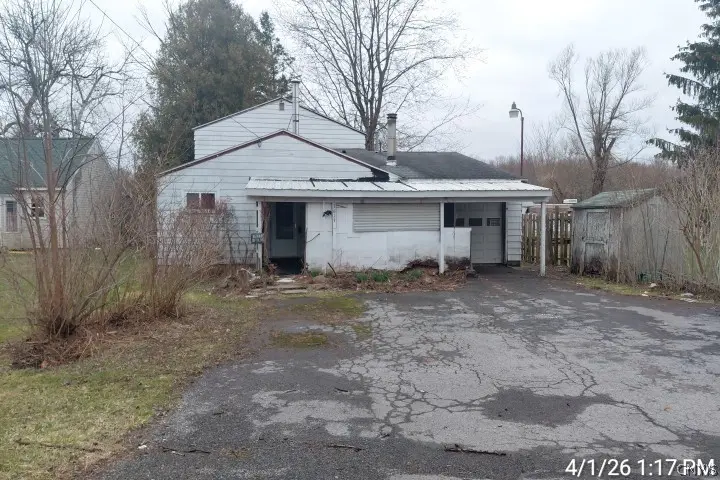
Have you been waiting for a waterfront property? This three-bedroom, one-bathroom riverfront property might be exactly what you have been waiting for. Mature shade trees throughout the grounds create a naturally attractive environment and establish privacy for outdoor activities. The direct river access delivers unique recreational opportunities and adds considerable market value. Easy access to Route 31 shopping ensures convenient access to retail and services. Schedule your showing today.
Key facts
- Riverfront property
- Direct river access
- Mature shade trees
Tags
Neighborhood map
What this means for you Summary
Snapshot
- This is a 3-bed/1.0-bath single-family listed at $115k.
Deal economics
- At list price, monthly cash flow is $773 ($9k/yr) — positive.
- The deal already cash-flows at list — no discount required.
- Meets the 1% rule at list price ($2k rent vs $115k).
- Recommended offer: $105k (9.0% below list) — sets the bar for market timing.
- Cap rate 15.1% vs local median 3.5% in Radisson — top-decile yield for the area; either an underpriced asset or a hidden risk that comps aren't pricing in. Stress-test before assuming the spread holds.
Location & tenants
- Location reads: area grade B — affects rentability + tenant quality, not the cash-flow math above.
- Phoenix Central School District (suburban): math 45% / reading 51% proficiency, ranked #416 of 590 in NY (top 70%) — families likely to look elsewhere, expect single-tenant / working-renter base with shorter leases.
- Market conditions: 63 active listings in the ZIP; 616 units permitted in Onondaga County in 2024 (256 in 5+ unit buildings).
Forward outlook
- Local home prices are declining (-3.0%/yr); year-one equity from $794 of loan paydown is wiped out by about $3k of value loss. Plan a longer hold.
- Onondaga County population projected to shrink 9% by 2050 — rents likely to lag national; underwrite the cash flow, not the appreciation.
- At projected returns (-3.0% appreciation + 3.0% rent growth), your $32k cash investment doubles in ~5 years — after that, you're playing with house money.
Negotiation context
- It's been on market 107 days — a 9% lower offer ($105k) is reasonable based on typical stale-listing flexibility.
Risks & watch-outs
- Watch-outs: property tax is 2.8% of price; flood insurance adds $66/mo; built in 1945 — expect roof / HVAC / electrical / plumbing capex.
- Climate carrying-cost: severe flood risk — expect insurance premiums to compound above CPI over the hold.
Questions for the listing agent
- It's been on market 107 days. Have you received any prior offers? Is the seller open to a 9% concession, seller financing, or rate buy-down credit?
- Built in 1945 — when were the roof, HVAC, electrical panel, plumbing, and water heater last replaced?
- Property tax is high relative to price — has the assessment been appealed recently, and will the sale trigger a re-assessment?
- What's the actual annual flood-insurance premium (NFIP or private), and is the property in a SFHA with mandatory coverage?
- Why hasn't it sold? Are there any deal-killer items the seller is aware of (foundation, flood, title, zoning, code violations)?
- Is there a deadline driving the sale (1031 exchange, divorce, estate, relocation)? That informs how much negotiation room exists.
- What's the average days-on-market for RENTAL listings here right now (not sales)? A rising rental-DOM trend means longer vacancies and softer asking-rent achievability than the comps imply.
- What's the recent tenant-quality profile in this submarket — average credit score on applications, eviction rate, late-payment / NSF rate, and stable-employment percentage? A property-management company in the area should have these aggregated.
- How much new for-sale + rental construction is in the pipeline within 1–3 miles? Heavy new supply typically softens prices + rents 12–24 months out; constrained supply supports both.
Investment metrics
- 1% rule
- 1.94% ✓
- Cap rate
- 15.06%
- Cash-on-cash
- 31.30%
- DSCR
- 2.39
- GRM
- 4.3
CMA / ARV
- ARV (median comp)
- $403,939
- List price
- $114,950
- Delta
- -71.54%
- Verdict
- UNDERPRICED
- Comps
- 5 within 1.0 mi
Projected returns pro-forma
-3.0% appreciation · 3.0% rent growth · sell at horizon
- IRR
- 23.2%
- Equity multiple
- 1.96×
- Total profit
- $30,763
- Equity at exit
- $17,139
- IRR
- 31.2%
- Equity multiple
- 3.82×
- Total profit
- $90,807
- Equity at exit
- $9,939
Cash invested: $32,186 (down + closing). Projections, not guarantees.
Landlord ↔ Tenant lean methodology
- Overall (STATE)
- 15 Strongly Tenant-Friendly
- State New York
- 15 Strongly Tenant-Friendly · D+10
- County
- — inherits STATE
- City
- — inherits STATE
ZIP-level market 13041
- Active inventory
- 63
- Price-to-rent
- 4.3×
Monthly cashflow live
- Estimated rent
- $2,229 medium interval (Pro) →
- Mortgage (P&I)
- −$603
- Tax from tax record
- −$271 /mo · $3,248/yr
- Insurance
- −$48
- Flood insurance flood zone
- −$66 /mo · $798/yr
- HOA
- −$0
- Vacancy / Maint / Mgmt
- −$468
- Net cashflow
- $773
Break-even live
Sensitivity live
| Price | -10% $838 | -5% $806 | +0% $773 | +5% $741 | +10% $708 |
|---|---|---|---|---|---|
| Rent | -10% $597 | -5% $685 | +0% $773 | +5% $861 | +10% $949 |
| Rate | -1.0pp $831 | -0.5pp $802 | base $773 | +0.5pp $743 | +1.0pp $713 |
UW: 25.0% down · 7.5% · 30yr · 1.5% tax · 5.0% vac · 8.0% maint · 8.0% mgmt
Financing live
Cash to close
- Down payment
- $28,738
- Closing costs
- $3,448
- Reserves months
- —
- Total cash needed
- —
Loan-product check · same deal, 3 products live
Conventional
25% down · 7.5% · 30yr
- Down + closing
- —
- Monthly P&I
- —
- Monthly cashflow
- —
- DSCR
- —
- Eligible?
- —
Personal DTI + credit; lowest rate.
DSCR
20% down · 8.5% · 30yr
- Down + closing
- —
- Monthly P&I
- —
- Monthly cashflow
- —
- DSCR
- —
- Eligible?
- —
No personal income docs; deal must DSCR.
Hard money
10% down · 12.0% · 12mo
- Down + closing
- —
- Monthly P&I
- —
- Monthly cashflow
- —
- DSCR
- —
- Eligible?
- —
Short-term bridge; refi at stabilization.
Listing history 18 events
-
2026-06-17status $114,950 Pending 107 DOM
-
2026-06-17days on market $114,950 Active Under Contract 107 DOM
-
2026-06-16days on market $114,950 Active Under Contract 106 DOM
-
2026-06-15days on market $114,950 Active Under Contract 105 DOM
-
2026-06-14days on market $114,950 Active Under Contract 103 DOM
-
2026-06-13statusdays on market $114,950 Active Under Contract 102 DOM
-
2026-06-10days on market $114,950 Active 100 DOM
-
2026-06-09days on market $114,950 Active 99 DOM
-
2026-06-08days on market $114,950 Active 98 DOM
-
2026-06-07days on market $114,950 Active 97 DOM
-
2026-06-03days on market $114,950 Active 93 DOM
-
2026-06-02days on market $114,950 Active 92 DOM
-
2026-06-01days on market $114,950 Active 91 DOM
-
2026-05-31days on market $114,950 Active 90 DOM
-
2026-05-30days on market $114,950 Active 89 DOM
-
2026-05-11price $114,950 495-char remark
Show marketing remark (495 chars)
Have you been waiting for a waterfront property? This three-bedroom, one-bathroom riverfront property might be exactly what you have been waiting for. Mature shade trees throughout the grounds create a naturally attractive environment and establish privacy for outdoor activities. The direct river access delivers unique recreational opportunities and adds considerable market value. Easy access to Route 31 shopping ensures convenient access to retail and services. Schedule your showing today.
-
2026-04-11price $124,950 495-char remark
Show marketing remark (495 chars)
Have you been waiting for a waterfront property? This three-bedroom, one-bathroom riverfront property might be exactly what you have been waiting for. Mature shade trees throughout the grounds create a naturally attractive environment and establish privacy for outdoor activities. The direct river access delivers unique recreational opportunities and adds considerable market value. Easy access to Route 31 shopping ensures convenient access to retail and services. Schedule your showing today.
-
2026-03-02$149,950 Active 495-char remark
Show marketing remark (495 chars)
Have you been waiting for a waterfront property? This three-bedroom, one-bathroom riverfront property might be exactly what you have been waiting for. Mature shade trees throughout the grounds create a naturally attractive environment and establish privacy for outdoor activities. The direct river access delivers unique recreational opportunities and adds considerable market value. Easy access to Route 31 shopping ensures convenient access to retail and services. Schedule your showing today.
ⓘ Source: listings_history table (triggers on properties + properties_extension) + one-shot
backfill from property_details.listing_events for pre-trigger history.
Tax reassessment forecast NY · Partial reset (capped growth)
- Current annual tax
- $3,248 · $271/mo
- Projected year-2 tax
- $3,248 · $271/mo
- Expected delta
- $0/yr ($0/mo · 0.0%)
ⓘ Screening estimate from a state-policy table — verify with the county assessor before closing.
Climate risk First Street
- Flood 9/10 Extreme FEMA zone X (shaded) · 99% chance over 30 yrs
- Wildfire 1/10 Low
- Heat 2/10 Low 6 d/yr ≥96°F today · 14 d/yr by 30 yrs out
- Wind 1/10 Low 100% chance of damaging wind over 30 yrs
- Air quality 2/10 Low 1 unhealthy d/yr today · 1 by 30 yrs out
Nearby sold comps map
Loading sold comps map…
Walkable amenities ~0.75 mi
Loading nearby amenities…
Taxation est. · year 1
- Rental income
- $26,748
- − Mortgage interest
- −$6,439
- − Property taxes
- −$3,248
- − Insurance
- −$1,372
- − Repairs & maintenance
- −$2,140
- − Management
- −$2,140
- − Depreciation
- −$3,344
- Taxable income
- $8,065
- Est. tax owed @ 24.0%
- −$1,936
- After-tax cash flow
- $7,341/yr
For passive investors: Depreciation is non-cash, so a rental often shows a tax loss while cash-flowing — sheltering income. Rental losses are passive: they offset passive income freely, and up to $25,000/yr can offset ordinary (W-2) income if you actively participate and your MAGI is under $100k (phasing out to $0 by $150k); unused losses carry forward. On sale, claimed depreciation is recaptured at up to 25%, and gains may owe capital-gains tax (a 1031 exchange can defer both). Figures are a year-1 estimate at your 24.0% rate — not tax advice; consult a CPA.
Schools (NCES district)
- District
- Phoenix Central School District
- NCES district ID
- 3622920
- Math proficiency
- 45% ▼ -14.00%
- Reading proficiency
- 51% ▲ 5.00%
- Median HH income
- $52,419
- Composite
- 41.34/100
- National rank
- #3500
- State rank
- #416 of 590 in NY
Livability — Radisson
No livability data for this city. (Only ~50 U.S. cities are tracked.)
Census & demographics
- Population (ZIP)
- 12,094
Population outlook (Onondaga County) Hauer SSP2
- Today (2025)
- 467,894 people
- By 2030
- 463,381 · -1.0%
- By 2040
- 447,697 · -4.3%
- By 2050
- 426,399 · -8.9%
- By 2075
- 373,661 · -20.1%
- By 2100
- 307,967 · -34.2%
Race, ethnicity, and origin ACS 2023
- Neighborhood character
- Predominantly White (83%)
- Race & ethnicity
- White 83% Two or more races 10% Black 3% Asian 3% Hispanic / Latino 2%
- Common ancestry
- Romanian 7% Lithuanian 3% Slovak 2%
- Foreign-born
- 8% · Canada, China, Vietnam
- Languages at home
- 89% English-only · Other Indo-European 4% Tagalog/Filipino 3% French/Haitian/Cajun 1%
Political lean MEDSL · Onondaga
- 2024 margin
- D (+17.3) · D 58.6% · R 41.4%
- 2008→2024 swing
- -3.0pp toward R · 2008: 20.3pp · 2024: 17.3pp
- All cycles
- 2024: D+17.3 2020: D+20.6 2016: D+12.8 2012: D+21.1 2008: D+20.3
Not yet ingested
- Civics
- —
Market trends
- HPI YoY
- ▼ -235.12%
- Current HPI
- 326.7838
- Rent YoY
- —
- Metro
- —
- State GDP YoY
- ▲ 2.60%
- F500 in state
- 92
Industry mix (Fortune 500 HQ in NY)
| Industry | F500 HQs | Revenue |
|---|---|---|
| Financial Services | 10 | $950B |
|
||
| Consumer Goods | 9 | $162B |
|
||
| Insurance | 4 | $225B |
|
||
| Telecommunications | 2 | $144B |
|
||
| Pharmaceuticals | 2 | $112B |
|
||
| Media / Entertainment | 2 | $69B |
|
||
Price history
-23.3% since first listed3 events — show timeline
- 2026-05-11 Price Changed $114,950 CNYIS
- 2026-04-11 Price Changed $124,950 CNYIS
- 2026-03-02 Listed $149,950 CNYIS
Property tax history
+9.7%/yrLatest (2025): $3,248 · +1.5% YoY. Source: county tax records.
Cash-flow waterfall
monthlySold comps — $/sqft
last 12 mo · ≤1 miLoading sold comps…