 Multi-family
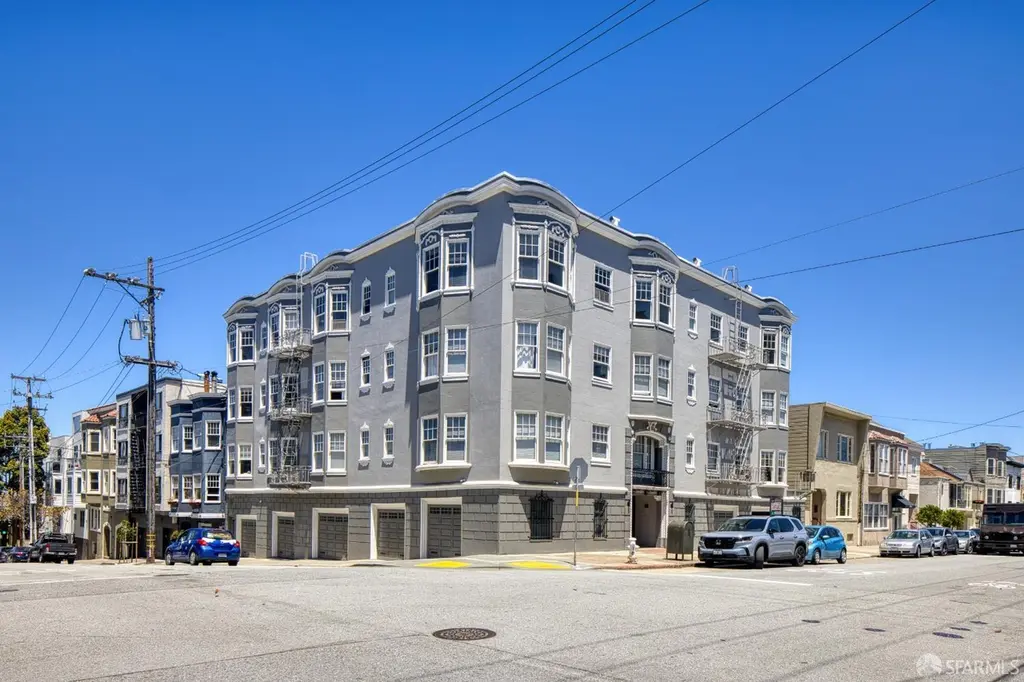
2490 Greenwich St · San Francisco, CA
Flood risk 1/10 · Minimal
- FEMA flood zone
- X (unshaded)
- Chance of flooding over 30 yrs
- 0.0%
- Est. flood insurance / yr
- $507 – $1,088
Fire risk 1/10 · Minimal
- Est. fire insurance / yr
- $659 – $1,223
Heat risk 3/10 · Minor
- Hot days now (above 78°F)
- 8 days/yr
- Hot days in 30 yrs
- 17 days/yr
Wind risk 1/10 · Minimal
- Chance of severe wind over 30 yrs
- —
Air-quality risk 8/10 · Major
- Unhealthy air days now
- 15 days/yr
- Unhealthy air days in 30 yrs
- 15 days/yr
Risk factors via First Street. Map © Google.
Why this score? — see what drove the C+ grade
The composite is a weighted blend of 9 inputs, each scored 0–100. Each bar is that input's sub-score; the figure is the points it added to the 100-point composite (weight × sub-score).
- Cash flow +22.0/30.0
- Appreciation +9.1/10.0
- DSCR +7.0/10.0
- 1% rule +5.8/10.0
- Rent growth +5.0/5.0
- Schools +5.0/10.0
- Condition / age +4.0/5.0
- Livability +3.8/5.0
- ARV discount +0.0/15.0
$10,250,000
🖨 Deal sheet 📄 Offer letter ✓ Due diligence
Multi-family units
County records classify this as Multi-Family (5+ Unit). Listing-text estimate: 1 unit. estimate disagrees with records
5+ unit building — per-unit beds/baths from public records are typically unavailable; the breakdown below (if shown) is an estimate from the listing text.
Listing remarks
2490 Greenwich Street presents a rare opportunity to acquire an eighteen (18) unit trophy apartment building in the heart of San Francisco's highly desirable Cow Hollow neighborhood. Situated on a prominent corner lot, the property features a balanced unit mix of nine (9) studios and nine (9) one-bedroom apartments, along with twelve (12) on-site parking spacesan increasingly valuable amenity in one of the city's most sought-after residential districts. Originally constructed in 1928, the building showcases classic San Francisco architecture and has tremendous curb appeal. Residents enjoy abundant natural light, attractive period details, and a highly functional layout that continues to app
Key facts
- Concrete foundation
- Functional layout
- Corner lot
Tags
Property features AI
Finance
- Other: Total building area approximately 15,954 (assessor); Lot features include sidewalk; lot area about 5,998 sq ft (0.1377 acres)
- Financial info: 18 total units, 16 leased and 2 vacant; Includes 8 occupied studios and 8 occupied one-bedroom units
- HOA & community: No association fee
Exterior
- Utilities: Separate gas meters; Separate electric meters
- Home design: Residential income property (multi-family, 5 or more units); Three or more levels; Built in 1928
- Construction: Originally built in 1928
- Exterior features: Sidewalk along the lot
Interior
- Bedrooms: 9 bedrooms total
- Flooring: Wood flooring
- Heating & cooling: Electric heating
- Interior features: Electric heating; Wood flooring
Neighborhood map
What this means for you Summary
Snapshot
- This is a 9-bed/?-bath multifamily listed at $10.25M. Condition is rated good.
Deal economics
- At list price, monthly cash flow is $16k ($196k/yr) — positive.
- The deal already cash-flows at list — no discount required.
- Meets the 1% rule at list price ($110k rent vs $10.25M).
- Cap rate 8.2% vs local median 2.1% in San Francisco — top-decile yield for the area; either an underpriced asset or a hidden risk that comps aren't pricing in. Stress-test before assuming the spread holds.
Location & tenants
- Location reads 76/100 on livability (#90 in CA, #3,143 nationally) — a middle-class / working-renter tenant base. Strengths: amenities A+, commute A+, employment A+; Watch: crime F, cost of living F.
- San Francisco Unified (urban): math 50% / reading 56% proficiency, ranked #322 of 1,400 in CA (top 23%) — acceptable for families but not a draw, mixed tenant base, ~2y average lease.
- Market conditions: Rents rising fast (+19.2%/yr); 59 active listings in the ZIP; high-income renter base; 750 units permitted in San Francisco County in 2024 (688 in 5+ unit buildings).
- At $110,353/mo this rent would consume 606% of the median local household income ($219k/yr) (locally 883% of renters already pay >50% of income on rent) — very limited rent-growth headroom before tenants either downsize or default.
Forward outlook
- In year one you build about $909k of equity ($71k loan paydown + $838k appreciation (8.2% local appreciation)).
- San Francisco County population projected at +39% by 2050 — long-run rental-demand tailwind backs the buy-and-hold thesis.
- At projected returns (8.2% appreciation + 8.0% rent growth), your $2.87M cash investment doubles in ~3 years — after that, you're playing with house money.
- By year 2, paydown + projected appreciation supports a ~$1.46M cash-out refi (75% LTV) — recoverable capital for the next deal without selling this one.
Negotiation context
- Only 10 days on market — expect competitive offers; lowballing is unlikely to land.
Risks & watch-outs
- Watch-outs: built in 1928 — expect roof / HVAC / electrical / plumbing capex.
Questions for the listing agent
- Built in 1928 — when were the roof, HVAC, electrical panel, plumbing, and water heater last replaced?
- Is there a deadline driving the sale (1031 exchange, divorce, estate, relocation)? That informs how much negotiation room exists.
- Schools are B-rated — typically a magnet for longer-tenancy family renters. What's the average tenant stay here, and is there a school-zone premium baked into asking?
- Crime grade is F in this area — have there been break-ins, vandalism, or insurance claims at this property in the last 3 years? What carrier currently insures it and at what premium?
- What's the average days-on-market for RENTAL listings here right now (not sales)? A rising rental-DOM trend means longer vacancies and softer asking-rent achievability than the comps imply.
- What's the recent tenant-quality profile in this submarket — average credit score on applications, eviction rate, late-payment / NSF rate, and stable-employment percentage? A property-management company in the area should have these aggregated.
- How much new apartment / multifamily construction is in the pipeline within 1–3 miles? Heavy new supply (>2% of stock underway) typically softens rents 12–24 months out; light construction supports rent growth.
Investment metrics
- 1% rule
- 1.08% ✓
- Cap rate
- 8.21%
- Cash-on-cash
- 6.83%
- DSCR
- 1.30
- GRM
- 7.7
CMA / ARV
- ARV (on-the-fly)
- $8,072,724
- Comps found
- 1
Show comp detail 1 sale within ~0.75 mi
| Address | Dist | Beds/Ba | Sqft | Sold | Price | $/sf | Match |
|---|---|---|---|---|---|---|---|
| 2341 Chestnut St | 0.11mi | 9/— | 15,510 (-3%) | 17mo | $7,850,000 | $506 | 76 |
Match score weights: distance 35% · size 25% · config 20% · recency 20%. Top-matched comps best support the ARV.
Projected returns pro-forma
8.18% appreciation · 8.0% rent growth · sell at horizon
- IRR
- 27.9%
- Equity multiple
- 3.08×
- Total profit
- $5,964,299
- Equity at exit
- $7,910,716
- IRR
- 26.8%
- Equity multiple
- 7.28×
- Total profit
- $18,010,431
- Equity at exit
- $15,821,972
Cash invested: $2,870,000 (down + closing). Projections, not guarantees.
Landlord ↔ Tenant lean methodology
- Overall (CITY)
- 0 Strongly Tenant-Friendly
- State California
- 18 Strongly Tenant-Friendly · D+13
- County
- — inherits STATE
- City San Francisco
- 0 Strongly Tenant-Friendly · D+57
ZIP-level market 94123
- Home prices YoY
- 4.0%
- Rents YoY
- 19.2%
- Active inventory
- 59
- Price-to-rent
- 137.2×
Monthly cashflow live
- Estimated rent
- $110,353 high interval (Pro) →
- Mortgage (P&I)
- −$53,752
- Tax est. 1.5%
- −$12,812 /mo · $153,750/yr
- Insurance
- −$4,271
- HOA
- −$0
- Vacancy / Maint / Mgmt
- −$23,174
- Net cashflow
- $16,343
Break-even live
18-unit breakdown (identical units grouped — click to expand)
| Units | Beds | Baths | Est. rent |
|---|---|---|---|
| 9× units | 0 | 1 | $56,034 |
| #1 | 0 | 1 | $6,226 |
| #2 | 0 | 1 | $6,226 |
| #3 | 0 | 1 | $6,226 |
| #4 | 0 | 1 | $6,226 |
| #5 | 0 | 1 | $6,226 |
| #6 | 0 | 1 | $6,226 |
| #7 | 0 | 1 | $6,226 |
| #8 | 0 | 1 | $6,226 |
| #9 | 0 | 1 | $6,226 |
| 9× units | 1 | 1 | $54,324 |
| #10 | 1 | 1 | $6,036 |
| #11 | 1 | 1 | $6,036 |
| #12 | 1 | 1 | $6,036 |
| #13 | 1 | 1 | $6,036 |
| #14 | 1 | 1 | $6,036 |
| #15 | 1 | 1 | $6,036 |
| #16 | 1 | 1 | $6,036 |
| #17 | 1 | 1 | $6,036 |
| #18 | 1 | 1 | $6,036 |
| Total (18 units) | $110,353 | ||
UW: 25.0% down · 7.5% · 30yr · 1.5% tax · 5.0% vac · 8.0% maint · 8.0% mgmt
Financing live
Cash to close
- Down payment
- $2,562,500
- Closing costs
- $307,500
- Reserves months
- —
- Total cash needed
- —
Loan-product check · same deal, 3 products live
Conventional
25% down · 7.5% · 30yr
- Down + closing
- —
- Monthly P&I
- —
- Monthly cashflow
- —
- DSCR
- —
- Eligible?
- —
Personal DTI + credit; lowest rate.
DSCR
20% down · 8.5% · 30yr
- Down + closing
- —
- Monthly P&I
- —
- Monthly cashflow
- —
- DSCR
- —
- Eligible?
- —
No personal income docs; deal must DSCR.
Hard money
10% down · 12.0% · 12mo
- Down + closing
- —
- Monthly P&I
- —
- Monthly cashflow
- —
- DSCR
- —
- Eligible?
- —
Short-term bridge; refi at stabilization.
Listing history 8 events
-
2026-06-18days on market $10,250,000 Active 10 DOM
-
2026-06-17days on market $10,250,000 Active 9 DOM
-
2026-06-16days on market $10,250,000 Active 8 DOM
-
2026-06-15days on market $10,250,000 Active 7 DOM
-
2026-06-13days on market $10,250,000 Active 5 DOM
-
2026-06-13days on market $10,250,000 Active 4 DOM
-
2026-06-08remarks 699-char remark
-
2026-06-08$10,250,000 Active 1 DOM
ⓘ Source: listings_history table (triggers on properties + properties_extension) + one-shot
backfill from property_details.listing_events for pre-trigger history.
Climate risk First Street
- Flood 1/10 Low FEMA zone X (unshaded) · 0% chance over 30 yrs
- Wildfire 1/10 Low
- Heat 3/10 Moderate 8 d/yr ≥78°F today · 17 d/yr by 30 yrs out
- Wind 1/10 Low
- Air quality 8/10 Severe 15 unhealthy d/yr today · 15 by 30 yrs out
Nearby sold comps map
Loading sold comps map…
Walkable amenities ~0.75 mi
Loading nearby amenities…
Taxation est. · year 1
- Rental income
- $1,324,236
- − Mortgage interest
- −$574,159
- − Property taxes
- −$153,750
- − Insurance
- −$51,250
- − Repairs & maintenance
- −$105,939
- − Management
- −$105,939
- − Depreciation
- −$298,182
- Taxable income
- $35,017
- Est. tax owed @ 24.0%
- −$8,404
- After-tax cash flow
- $187,717/yr
For passive investors: Depreciation is non-cash, so a rental often shows a tax loss while cash-flowing — sheltering income. Rental losses are passive: they offset passive income freely, and up to $25,000/yr can offset ordinary (W-2) income if you actively participate and your MAGI is under $100k (phasing out to $0 by $150k); unused losses carry forward. On sale, claimed depreciation is recaptured at up to 25%, and gains may owe capital-gains tax (a 1031 exchange can defer both). Figures are a year-1 estimate at your 24.0% rate — not tax advice; consult a CPA.
Condition & rehab AI · 13 photos
This multi-family property in San Francisco's Cow Hollow neighborhood is in good condition with cosmetic updates needed. It offers a great investment opportunity with potential for both resale and rental value.
Value-add opportunities
- Both Paint exterior — Enhances curb appeal and value
- Both Replace flooring — Improves aesthetics and value
- Both Update kitchen appliances — Modernizes and increases value
Renovation cost estimate screening
Value-add ROI direction
- Both Paint exterior — Enhances curb appeal and value ↑
- Both Replace flooring — Improves aesthetics and value ↑
- Both Update kitchen appliances — Modernizes and increases value ↑
ⓘ Cost ranges are severity-bucket heuristics (US national rule-of-thumb). Get contractor quotes + a written scope before underwriting a rehab budget.
Schools (NCES district)
- District
- San Francisco Unified
- NCES district ID
- 0634410
- Math proficiency
- 50% ▬ 0.00%
- Reading proficiency
- 56% ▲ 1.00%
- Median HH income
- $81,249
- Composite
- 50.14/100
- National rank
- #4088
- State rank
- #322 of 1400 in CA
Livability — San Francisco
- Score
- 76/100
- State rank
- #90
- US rank
- #3143
Category grades
Schools grade is shown separately in the Schools card above.
Census & demographics
- Census place
- San Francisco, CA
- County
- San Francisco County · 827,552 people
- City population
- 827,552
- Metro
- San Francisco-Oakland-Berkeley, CA
- Population (ZIP)
- 24,054
- Household income
- $218,603
- Rent vs Own
- Severe rent burden
- 883.0
Population outlook (San Francisco County) Hauer SSP2
- Today (2025)
- 1,030,936 people
- By 2030
- 1,110,409 · +7.7%
- By 2040
- 1,270,010 · +23.2%
- By 2050
- 1,435,001 · +39.2%
- By 2075
- 1,779,074 · +72.6%
- By 2100
- 1,966,767 · +90.8%
Race, ethnicity, and origin ACS 2023
- Neighborhood character
- Predominantly White (73%)
- Race & ethnicity
- White 73% Asian 11% Two or more races 11% Hispanic / Latino 9%
- Hispanic origin (detail)
- Mexican 3% Salvadoran 1%
- Common ancestry
- Scotch-Irish 4% Italian 4% Lithuanian 3%
- Foreign-born
- 17% · Canada, China, Dominican Republic
- Languages at home
- 83% English-only · Spanish 5% Other Indo-European 3% Chinese 3%
Political lean MEDSL · San Francisco
- 2024 margin
- Solid D (+64.8) · D 80.3% · R 15.5% · Other 4.1%
- 2008→2024 swing
- -5.7pp toward R · 2008: 70.5pp · 2024: 64.8pp
- All cycles
- 2024: D+64.8 2020: D+72.5 2016: D+76.1 2012: D+70.2 2008: D+70.5
Not yet ingested
- Civics
- —
Market trends
- HPI YoY
- ▲ 8.18%
- Current HPI
- 212.9289
- Rent YoY
- ▲ 19.17%
- Metro
- San Francisco-Oakland-Berkeley, CA
- State GDP YoY
- ▲ 3.21%
- F500 in state
- 116
Industry mix (Fortune 500 HQ in CA)
| Industry | F500 HQs | Revenue |
|---|---|---|
| Technology | 27 | $1,492B |
|
||
| Financial Services | 3 | $174B |
|
||
| Retail | 3 | $44B |
|
||
| Insurance | 3 | $26B |
|
||
| Media / Entertainment | 2 | $115B |
|
||
| Pharmaceuticals / Biotech | 2 | $62B |
|
||
Price history
1 event — show timeline
- 2026-06-08 Listed $10,250,000 San Francisco MLS
Cash-flow waterfall
monthlySold comps — $/sqft
last 12 mo · ≤1 miLoading sold comps…