 Multi-family
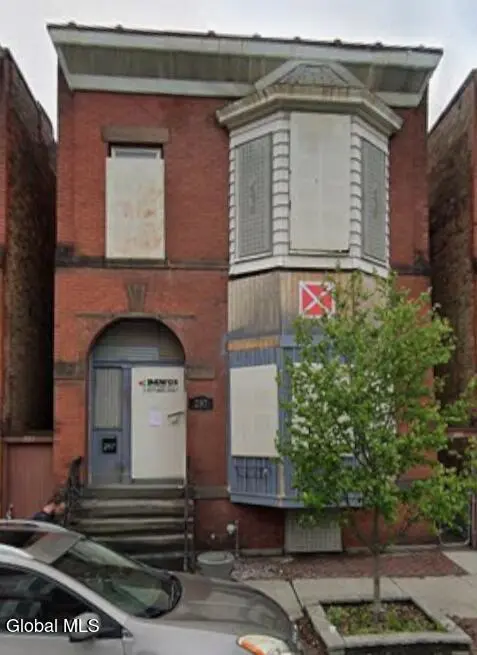
297 2nd St · Troy, NY
Flood risk 8/10 · Major
- FEMA flood zone
- AE
- Chance of flooding over 30 yrs
- 0.99%
- Est. flood insurance / yr
- $2,026 – $9,024
Fire risk 1/10 · Minimal
- Est. fire insurance / yr
- $691 – $1,283
Heat risk 4/10 · Minor
- Hot days now (above 96°F)
- 7 days/yr
- Hot days in 30 yrs
- 16 days/yr
Wind risk 3/10 · Minor
- Chance of severe wind over 30 yrs
- 6.0%
Air-quality risk 2/10 · Minimal
- Unhealthy air days now
- 0 days/yr
- Unhealthy air days in 30 yrs
- 1 days/yr
Risk factors via First Street. Map © Google.
Why this score? — see what drove the B grade
The composite is a weighted blend of 9 inputs, each scored 0–100. Each bar is that input's sub-score; the figure is the points it added to the 100-point composite (weight × sub-score).
- Cash flow +30.0/30.0
- 1% rule +10.0/10.0
- DSCR +10.0/10.0
- ARV discount +7.5/15.0
- Livability +4.0/5.0
- Schools +3.8/10.0
- Rent growth +3.7/5.0
- Condition / age +2.5/5.0
- Appreciation +0.0/10.0
$99,900
🖨 Deal sheet 📄 Offer letter ✓ Due diligence
Multi-family units
County records classify this as Multi-Family (2-4 Unit). Listing-text estimate: 1 unit. estimate disagrees with records
Listing remarks MLS
2 Fam Brick Home in Excellent Condition & has been Family Owned & Occupied for over 35 years! Updates Incl Newer Windows, Roof, HW Tanks, Furnaces & Newly Updated Electrical Panels. Beautiful HardWood Flrs & Built In Cabinets. Full Attic & Basement. Excellent Condition
Key facts
- 3,049 sq ft lot
- 2 parking spots
- Built 1896
Property features AI
Exterior
- Parking: Off-street parking for 2 vehicles
- Utilities: Public water; Public sewer
- Home design: Duplex; Other roof type
- Construction: Constructed with block and other materials; Brick/mortar foundation
- Exterior features: Level lot; Main road frontage of 25 feet
Interior
- Bedrooms: Unit 1: 3 bedrooms (all on 1st floor); Unit 2: 4 bedrooms
- Flooring: Wood
- Bathrooms: 2 full bathrooms total; One full bath on the 1st floor and one on the 2nd floor
- Interior features: Wood flooring; Full basement
Neighborhood map
What this means for you Summary
Snapshot
- This is a 7-bed/2.0-bath multifamily listed at $100k.
Deal economics
- At list price, monthly cash flow is $1k ($17k/yr) — positive.
- The deal already cash-flows at list — no discount required.
- Meets the 1% rule at list price ($4k rent vs $100k).
- Cap rate 28.9% vs local median 5.3% in Troy — top-decile yield for the area; either an underpriced asset or a hidden risk that comps aren't pricing in. Stress-test before assuming the spread holds.
Location & tenants
- Location reads 81/100 on livability (#88 in NY, #1,350 nationally) — a professional / high-income tenant draw. Strengths: amenities A+, commute A+, housing A+; Watch: schools C-, employment C-, crime F.
- Troy City School District (urban): math 44% / reading 46% proficiency, ranked #467 of 590 in NY (top 79%) — families likely to look elsewhere, expect single-tenant / working-renter base with shorter leases; 62% free/reduced lunch — lower-income household profile, screen leases tightly.
- Market conditions: Rents rising fast (+4.9%/yr); 220 active listings in the ZIP; solid renter incomes; 405 units permitted in Rensselaer County in 2024 (224 in 5+ unit buildings).
- At $3,535/mo this rent would consume 56% of the median local household income ($76k/yr) (locally 2698% of renters already pay >50% of income on rent) — very limited rent-growth headroom before tenants either downsize or default.
Forward outlook
- Local home prices are declining (-3.0%/yr); year-one equity from $691 of loan paydown is wiped out by about $3k of value loss. Plan a longer hold.
- Rensselaer County population projected to shrink 6% by 2050 — rents likely to lag national; underwrite the cash flow, not the appreciation.
- At projected returns (-3.0% appreciation + 4.9% rent growth), your $28k cash investment doubles in ~2 years — after that, you're playing with house money.
Negotiation context
- Only 3 days on market — expect competitive offers; lowballing is unlikely to land.
- 4 sale attempts since 16y ago with the ask held roughly flat each time — persistent listings suggest the price (not the market) is what's stuck; bring a comps-based counter.
Risks & watch-outs
- Watch-outs: property tax is 4.1% of price; flood insurance adds $460/mo; built in 1896 — expect roof / HVAC / electrical / plumbing capex.
- Climate carrying-cost: in FEMA flood zone AE (mandatory federal flood insurance) — expect insurance premiums to compound above CPI over the hold.
Questions for the listing agent
- Built in 1896 — when were the roof, HVAC, electrical panel, plumbing, and water heater last replaced?
- Property tax is high relative to price — has the assessment been appealed recently, and will the sale trigger a re-assessment?
- What's the actual annual flood-insurance premium (NFIP or private), and is the property in a SFHA with mandatory coverage?
- Is there a deadline driving the sale (1031 exchange, divorce, estate, relocation)? That informs how much negotiation room exists.
- Crime grade is F in this area — have there been break-ins, vandalism, or insurance claims at this property in the last 3 years? What carrier currently insures it and at what premium?
- What's the average days-on-market for RENTAL listings here right now (not sales)? A rising rental-DOM trend means longer vacancies and softer asking-rent achievability than the comps imply.
- What's the recent tenant-quality profile in this submarket — average credit score on applications, eviction rate, late-payment / NSF rate, and stable-employment percentage? A property-management company in the area should have these aggregated.
- How much new apartment / multifamily construction is in the pipeline within 1–3 miles? Heavy new supply (>2% of stock underway) typically softens rents 12–24 months out; light construction supports rent growth.
Investment metrics
- 1% rule
- 3.54% ✓
- Cap rate
- 28.94%
- Cash-on-cash
- 80.88%
- DSCR
- 4.60
- GRM
- 2.4
CMA / ARV
- ARV (on-the-fly)
- $252,500
- Comps found
- 12
Show comp detail 12 sales within ~0.75 mi
| Address | Dist | Beds/Ba | Sqft | Sold | Price | $/sf | Match |
|---|---|---|---|---|---|---|---|
| 301 2nd St | 0.01mi | 7/2.0 | 2,500 (0%) | 3mo | $239,900 | $96 | 97 |
| 62 Ida St | 0.11mi | 8/2.0 (+1) | 2,484 (-1%) | 7mo | $125,000 | $50 | 83 |
| 1266 5th Ave | 0.38mi | 6/2.0 (-1) | 2,540 (+2%) | 1mo | $240,000 | $94 | 74 |
| 298 3rd St | 0.12mi | 8/3.0 (+1) | 2,646 (+6%) | 8mo | $317,000 | $120 | 69 |
| 412 2nd St | 0.31mi | 6/2.0 (-1) | 2,256 (-10%) | 2mo | $240,000 | $106 | 63 |
| 462 1st St | 0.50mi | 6/2.0 (-1) | 2,376 (-5%) | 9mo | $319,500 | $134 | 55 |
| 96 Hanover St | 0.32mi | 6/3.0 (-1) | 2,768 (+11%) | 4mo | $160,000 | $58 | 55 |
| 1250 5th Ave | 0.36mi | 7/2.0 | 2,870 (+15%) | 13mo | $179,000 | $62 | 48 |
| 508 2nd St | 0.55mi | 6/2.0 (-1) | 2,244 (-10%) | 11mo | $230,000 | $102 | 43 |
| 204 13th St | 0.54mi | 6/3.0 (-1) | 2,794 (+12%) | 8mo | $289,900 | $104 | 40 |
| 542 1st St | 0.72mi | 6/2.0 (-1) | 2,300 (-8%) | 13mo | $197,000 | $86 | 37 |
| 1220 5th Ave | 0.68mi | 6/2.0 (-1) | 2,184 (-13%) | 9mo | $220,000 | $101 | 35 |
Match score weights: distance 35% · size 25% · config 20% · recency 20%. Top-matched comps best support the ARV.
Projected returns pro-forma
-3.0% appreciation · 4.88% rent growth · sell at horizon
- IRR
- 62.9%
- Equity multiple
- 3.93×
- Total profit
- $81,840
- Equity at exit
- $14,895
- IRR
- 68.3%
- Equity multiple
- 8.83×
- Total profit
- $219,072
- Equity at exit
- $8,638
Cash invested: $27,972 (down + closing). Projections, not guarantees.
Landlord ↔ Tenant lean methodology
- Overall (STATE)
- 15 Strongly Tenant-Friendly
- State New York
- 15 Strongly Tenant-Friendly · D+10
- County
- — inherits STATE
- City
- — inherits STATE
ZIP-level market 12180
- Home prices YoY
- -33.3%
- Rents YoY
- 4.9%
- Active inventory
- 220
- Price-to-rent
- 4.7×
Monthly cashflow live
- Estimated rent
- $3,535 high interval (Pro) →
- Mortgage (P&I)
- −$524
- Tax from tax record
- −$342 /mo · $4,103/yr
- Insurance
- −$42
- Flood insurance flood zone
- −$460 /mo · $5,525/yr
- HOA
- −$0
- Vacancy / Maint / Mgmt
- −$742
- Net cashflow
- $1,425
Break-even live
2-unit breakdown (identical units grouped — click to expand)
| Units | Beds | Baths | Est. rent |
|---|---|---|---|
| 2× units | 2.0 | 1 | $3,534 |
| #1 | 2.0 | 1 | $1,767 |
| #2 | 2.0 | 1 | $1,767 |
| Total (2 units) | $3,535 | ||
UW: 25.0% down · 7.5% · 30yr · 1.5% tax · 5.0% vac · 8.0% maint · 8.0% mgmt
Financing live
Cash to close
- Down payment
- $24,975
- Closing costs
- $2,997
- Reserves months
- —
- Total cash needed
- —
Loan-product check · same deal, 3 products live
Conventional
25% down · 7.5% · 30yr
- Down + closing
- —
- Monthly P&I
- —
- Monthly cashflow
- —
- DSCR
- —
- Eligible?
- —
Personal DTI + credit; lowest rate.
DSCR
20% down · 8.5% · 30yr
- Down + closing
- —
- Monthly P&I
- —
- Monthly cashflow
- —
- DSCR
- —
- Eligible?
- —
No personal income docs; deal must DSCR.
Hard money
10% down · 12.0% · 12mo
- Down + closing
- —
- Monthly P&I
- —
- Monthly cashflow
- —
- DSCR
- —
- Eligible?
- —
Short-term bridge; refi at stabilization.
Listing history 5 events
-
2026-06-13status $99,900 Pending 3 DOM
-
2026-06-10days on market $99,900 Active 3 DOM
-
2026-06-09days on market $99,900 Active 2 DOM
-
2026-06-08remarks 258-char remark
-
2026-06-08$99,900 Active 1 DOM
ⓘ Source: listings_history table (triggers on properties + properties_extension) + one-shot
backfill from property_details.listing_events for pre-trigger history.
Tax reassessment forecast NY · Partial reset (capped growth)
- Current annual tax
- $4,103 · $342/mo
- Projected year-2 tax
- $4,103 · $342/mo
- Expected delta
- $0/yr ($0/mo · 0.0%)
ⓘ Screening estimate from a state-policy table — verify with the county assessor before closing.
Climate risk First Street
- Flood 8/10 Severe FEMA zone AE · 99% chance over 30 yrs
- Wildfire 1/10 Low
- Heat 4/10 Moderate 7 d/yr ≥96°F today · 16 d/yr by 30 yrs out
- Wind 3/10 Moderate 6% chance of damaging wind over 30 yrs
- Air quality 2/10 Low 0 unhealthy d/yr today · 1 by 30 yrs out
Nearby sold comps map
Loading sold comps map…
Walkable amenities ~0.75 mi
Loading nearby amenities…
Taxation est. · year 1
- Rental income
- $42,420
- − Mortgage interest
- −$5,596
- − Property taxes
- −$4,103
- − Insurance
- −$6,024
- − Repairs & maintenance
- −$3,394
- − Management
- −$3,394
- − Depreciation
- −$2,906
- Taxable income
- $17,003
- Est. tax owed @ 24.0%
- −$4,081
- After-tax cash flow
- $13,017/yr
For passive investors: Depreciation is non-cash, so a rental often shows a tax loss while cash-flowing — sheltering income. Rental losses are passive: they offset passive income freely, and up to $25,000/yr can offset ordinary (W-2) income if you actively participate and your MAGI is under $100k (phasing out to $0 by $150k); unused losses carry forward. On sale, claimed depreciation is recaptured at up to 25%, and gains may owe capital-gains tax (a 1031 exchange can defer both). Figures are a year-1 estimate at your 24.0% rate — not tax advice; consult a CPA.
Schools (NCES district)
- District
- Troy City School District
- NCES district ID
- 3628950
- Math proficiency
- 44% ▲ 6.00%
- Reading proficiency
- 46% ▲ 6.00%
- Median HH income
- $42,143
- Composite
- 37.89/100
- National rank
- #4318
- State rank
- #467 of 590 in NY
Livability — Troy
- Score
- 81/100
- State rank
- #88
- US rank
- #1350
Category grades
Schools grade is shown separately in the Schools card above.
Census & demographics
- Census place
- Troy, NY
- County
- Rensselaer County · 75,590 people
- City population
- 53,479
- Metro
- Albany-Schenectady-Troy, NY
- Population (ZIP)
- 53,479
- Household income
- $75,851
- Rent vs Own
- Severe rent burden
- 2698.0
Population outlook (Rensselaer County) Hauer SSP2
- Today (2025)
- 162,400 people
- By 2030
- 161,746 · -0.4%
- By 2040
- 158,095 · -2.7%
- By 2050
- 152,966 · -5.8%
- By 2075
- 140,767 · -13.3%
- By 2100
- 124,727 · -23.2%
Race, ethnicity, and origin ACS 2023
- Neighborhood character
- Predominantly White (70%)
- Race & ethnicity
- White 70% Black 12% Hispanic / Latino 8% Two or more races 8% Asian 5%
- Hispanic origin (detail)
- Mexican 1% Puerto Rican 4%
- Common ancestry
- Romanian 5% Lithuanian 5% Slovak 1%
- Foreign-born
- 10% · Canada, China
- Languages at home
- 88% English-only · Spanish 4% Other Indo-European 2% Arabic 2%
Political lean MEDSL · Rensselaer
- 2024 margin
- Toss-up / Even · D 50.7% · R 49.3%
- 2008→2024 swing
- -8.0pp toward R · 2008: 9.3pp · 2024: 1.4pp
- All cycles
- 2024: D+1.4 2020: D+5.6 2016: R+2.9 2012: D+11.8 2008: D+9.3
Not yet ingested
- Civics
- —
Market trends
- HPI YoY
- ▼ -142.53%
- Current HPI
- 285.0762
- Rent YoY
- ▲ 4.88%
- Metro
- Albany-Schenectady-Troy, NY
- State GDP YoY
- ▲ 2.60%
- F500 in state
- 92
Industry mix (Fortune 500 HQ in NY)
| Industry | F500 HQs | Revenue |
|---|---|---|
| Financial Services | 10 | $950B |
|
||
| Consumer Goods | 9 | $162B |
|
||
| Insurance | 4 | $225B |
|
||
| Telecommunications | 2 | $144B |
|
||
| Pharmaceuticals | 2 | $112B |
|
||
| Media / Entertainment | 2 | $69B |
|
||
Price history
-13.1% since first listed12 events — show timeline
- 2026-06-07 Listed $99,900 Global MLS
- 2023-12-13 Listing Removed — Global MLS
- 2023-12-12 Price Changed $219,000 Global MLS
- 2023-12-05 Price Changed $237,500 Global MLS
- 2023-11-30 Price Changed $248,900 Global MLS
- 2023-11-24 Listed $254,800 Global MLS
- 2010-09-21 Sold (Public Records) $111,976 Public Records
- 2010-09-17 Sold (MLS) $116,200 Global MLS
- 2010-07-25 Listing Removed — Global MLS
- 2010-07-21 Listed $110,000 Global MLS
- 2010-07-14 Listing Removed — Global MLS
- 2010-03-22 Listed $115,000 Global MLS
Property tax history
+15.8%/yrLatest (2025): $4,103 · -46.8% YoY. Source: county tax records.
Cash-flow waterfall
monthlySold comps — $/sqft
last 12 mo · ≤1 miLoading sold comps…