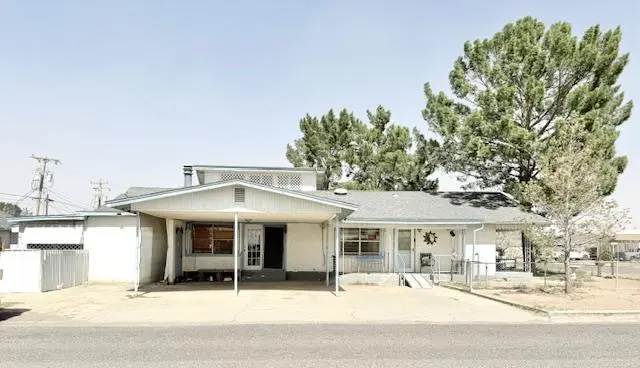
723 S Palm St · Town of Pecos, TX
Flood risk 1/10 · Minimal
- FEMA flood zone
- X
- Chance of flooding over 30 yrs
- 0.0%
- Est. flood insurance / yr
- $507 – $1,088
Fire risk 6/10 · Moderate
- Est. fire insurance / yr
- $1,222 – $2,270
Heat risk 7/10 · Major
- Hot days now (above 105°F)
- 7 days/yr
- Hot days in 30 yrs
- 21 days/yr
Wind risk 1/10 · Minimal
- Chance of severe wind over 30 yrs
- —
Air-quality risk 1/10 · Minimal
- Unhealthy air days now
- 0 days/yr
- Unhealthy air days in 30 yrs
- 0 days/yr
Risk factors via First Street. Map © Google.
Why this score? — see what drove the B- grade
The composite is a weighted blend of 9 inputs, each scored 0–100. Each bar is that input's sub-score; the figure is the points it added to the 100-point composite (weight × sub-score).
- Cash flow +29.1/30.0
- DSCR +10.0/10.0
- ARV discount +7.5/15.0
- 1% rule +7.4/10.0
- Appreciation +4.5/10.0
- Rent growth +2.5/5.0
- Schools +2.5/10.0
- Livability +2.5/5.0
- Condition / age +2.5/5.0
$225,000
🖨 Deal sheet 📄 Offer letter ✓ Due diligence
Listing remarks
Charming 3 bedroom, 2 bath home full of character and thoughtful details throughout! Featuring 2 spacious living areas perfect for entertaining, beautiful wood cabinetry in the kitchen with abundant storage, and unique built-ins that add warmth and charm. Additional building in the backyard offers potential for separate living quarters, guest space, or office. Centrally located near schools, grocery stores, and main streets for added convenience. A must-see property with endless possibilities!
Key facts
- Guest space
- Unique built-ins
- Wood cabinetry
Tags
Property features AI
Exterior
- Parking: 2 parking spaces (2 covered); Attached garage; Carport
- Security: Smoke detector(s)
- Utilities: Public water; Public sewer; Propane
- Home design: Single-family residence; Residential property
- Construction: Stucco exterior; Composition roof; Pillar/post/pier foundation; Built with customized wheelchair accessibility; Solar energy system
- Exterior features: Covered patio; Landscaped yard; Corner lot; Storage structure
Interior
- Kitchen: Gas range; Oven
- Flooring: Carpet; Tile; Laminate
- Bathrooms: 2 full bathrooms
- Heating & cooling: Central heating (natural gas); Central electric air conditioning
- Interior features: High ceilings; Breakfast bar; Drapes; Gas log fireplace in living room; Smoke detector(s)
- Laundry & utility: Washer hookup; Dryer; Gas water heater
Neighborhood map
What this means for you Summary
Snapshot
- This is a 3-bed/2.0-bath single-family listed at $225k.
Deal economics
- At list price, monthly cash flow is $776 ($9k/yr) — positive.
- The deal already cash-flows at list — no discount required.
- Meets the 1% rule at list price ($3k rent vs $225k).
- Recommended offer: $218k (3.0% below list) — sets the bar for market timing.
Location & tenants
- Location reads: area grade B — affects rentability + tenant quality, not the cash-flow math above.
- Pecos-Barstow-Toyah ISD (town): math 28% / reading 30% proficiency, ranked #652 of 826 in TX (top 79%) — low school quality limits family demand, transient renter base, plan for 1-2y turnover; 66% free/reduced lunch — lower-income household profile, screen leases tightly.
- Zoned schools: Austin El (math 22% / reading 32%, grade F, #2,791 of 4,322 statewide, top 68%, 644 students, 80% FRL); Crockett Middle (math 30% / reading 29%, grade F, #1,077 of 1,662 statewide, top 66%, 635 students, 77% FRL); Pecos H S (math 12% / reading 25%, grade F, #1,436 of 1,632 statewide, top 88%, 766 students, 54% FRL) — zoned schools at 70% FRL track the district average.
- Market conditions: 88 active listings in the ZIP; 1 comparable units currently listed for rent nearby; 22 units permitted in Reeves County in 2024 (0 in 5+ unit buildings).
Forward outlook
- Local home prices are declining (-1.1%/yr); year-one equity from $2k of loan paydown is wiped out by about $2k of value loss. Plan a longer hold.
- Reeves County population projected at +45% by 2050 — long-run rental-demand tailwind backs the buy-and-hold thesis.
- At projected returns (-1.1% appreciation + 3.0% rent growth), your $63k cash investment doubles in ~6 years — after that, you're playing with house money.
Negotiation context
- It's been on market 31 days — a 3% lower offer ($218k) is reasonable based on typical stale-listing flexibility.
Risks & watch-outs
- Watch-outs: built in 1950 — expect roof / HVAC / electrical / plumbing capex.
- Climate carrying-cost: major wildfire risk; extreme-heat days projected 7→21/yr by 2055 (HVAC capex compounding) — expect insurance premiums to compound above CPI over the hold.
Questions for the listing agent
- It's been on market 31 days. Have you received any prior offers? Is the seller open to a 3% concession, seller financing, or rate buy-down credit?
- Built in 1950 — when were the roof, HVAC, electrical panel, plumbing, and water heater last replaced?
- Is there a deadline driving the sale (1031 exchange, divorce, estate, relocation)? That informs how much negotiation room exists.
- What's the average days-on-market for RENTAL listings here right now (not sales)? A rising rental-DOM trend means longer vacancies and softer asking-rent achievability than the comps imply.
- What's the recent tenant-quality profile in this submarket — average credit score on applications, eviction rate, late-payment / NSF rate, and stable-employment percentage? A property-management company in the area should have these aggregated.
- How much new for-sale + rental construction is in the pipeline within 1–3 miles? Heavy new supply typically softens prices + rents 12–24 months out; constrained supply supports both.
Investment metrics
- 1% rule
- 1.24% ✓
- Cap rate
- 10.43%
- Cash-on-cash
- 14.79%
- DSCR
- 1.66
- GRM
- 6.7
CMA / ARV
No comps found within radius.
Projected returns pro-forma
-1.09% appreciation · 3.0% rent growth · sell at horizon
- IRR
- 11.2%
- Equity multiple
- 1.50×
- Total profit
- $31,574
- Equity at exit
- $53,352
- IRR
- 17.4%
- Equity multiple
- 2.72×
- Total profit
- $108,442
- Equity at exit
- $55,210
Cash invested: $63,000 (down + closing). Projections, not guarantees.
Landlord ↔ Tenant lean methodology
- Overall (STATE)
- 87 Strongly Landlord-Friendly
- State Texas
- 87 Strongly Landlord-Friendly · R+5
- County
- — inherits STATE
- City
- — inherits STATE
ZIP-level market 79772
- Home prices YoY
- -0.7%
- Active inventory
- 88
- Price-to-rent
- 6.7×
Monthly cashflow live
- Estimated rent
- $2,800 medium interval (Pro) →
- Mortgage (P&I)
- −$1,180
- Tax from tax record
- −$162 /mo · $1,943/yr
- Insurance
- −$94
- HOA
- −$0
- Vacancy / Maint / Mgmt
- −$588
- Net cashflow
- $776
Break-even live
UW: 25.0% down · 7.5% · 30yr · 1.5% tax · 5.0% vac · 8.0% maint · 8.0% mgmt
Financing live
Cash to close
- Down payment
- $56,250
- Closing costs
- $6,750
- Reserves months
- —
- Total cash needed
- —
Loan-product check · same deal, 3 products live
Conventional
25% down · 7.5% · 30yr
- Down + closing
- —
- Monthly P&I
- —
- Monthly cashflow
- —
- DSCR
- —
- Eligible?
- —
Personal DTI + credit; lowest rate.
DSCR
20% down · 8.5% · 30yr
- Down + closing
- —
- Monthly P&I
- —
- Monthly cashflow
- —
- DSCR
- —
- Eligible?
- —
No personal income docs; deal must DSCR.
Hard money
10% down · 12.0% · 12mo
- Down + closing
- —
- Monthly P&I
- —
- Monthly cashflow
- —
- DSCR
- —
- Eligible?
- —
Short-term bridge; refi at stabilization.
Rent comps 1 comps
| Address | Beds | Baths | Sqft | Rent | $/sqft | DOM | Units | Dist |
|---|---|---|---|---|---|---|---|---|
| 1523 Mimosa St Pecos, TX | 3.0 | 2.0 | 2206 | $2,800 | $1.27 | 44d | 1 | 0.71mi |
Listing history 18 events
-
2026-06-18days on market $225,000 Active 31 DOM
-
2026-06-17days on market $225,000 Active 30 DOM
-
2026-06-16days on market $225,000 Active 29 DOM
-
2026-06-15days on market $225,000 Active 28 DOM
-
2026-06-15days on market $225,000 Active 27 DOM
-
2026-06-13days on market $225,000 Active 26 DOM
-
2026-06-12days on market $225,000 Active 25 DOM
-
2026-06-10days on market $225,000 Active 22 DOM
-
2026-06-08days on market $225,000 Active 21 DOM
-
2026-06-08days on market $225,000 Active 20 DOM
-
2026-06-07days on market $225,000 Active 19 DOM
-
2026-06-03days on market $225,000 Active 16 DOM
-
2026-06-02days on market $225,000 Active 15 DOM
-
2026-06-01days on market $225,000 Active 14 DOM
-
2026-05-31days on market $225,000 Active 13 DOM
-
2026-05-18$225,000 Active
-
2025-04-14price $220,000
-
2025-03-13price $252,000
ⓘ Source: listings_history table (triggers on properties + properties_extension) + one-shot
backfill from property_details.listing_events for pre-trigger history.
Tax reassessment forecast TX · Resets to sale price
- Current annual tax
- $1,943 · $162/mo
- Projected year-2 tax
- $4,118 · $343/mo
- Expected delta
- +$2,174/yr (+$181/mo · 111.9%)
ⓘ Screening estimate from a state-policy table — verify with the county assessor before closing.
Climate risk First Street
- Flood 1/10 Low FEMA zone X · 0% chance over 30 yrs
- Wildfire 6/10 Major
- Heat 7/10 Severe 7 d/yr ≥105°F today · 21 d/yr by 30 yrs out
- Wind 1/10 Low
- Air quality 1/10 Low 0 unhealthy d/yr today · 0 by 30 yrs out
Nearby sold comps map
Loading sold comps map…
Walkable amenities ~0.75 mi
Loading nearby amenities…
Taxation est. · year 1
- Rental income
- $33,600
- − Mortgage interest
- −$12,603
- − Property taxes
- −$1,943
- − Insurance
- −$1,125
- − Repairs & maintenance
- −$2,688
- − Management
- −$2,688
- − Depreciation
- −$6,545
- Taxable income
- $6,007
- Est. tax owed @ 24.0%
- −$1,442
- After-tax cash flow
- $7,875/yr
For passive investors: Depreciation is non-cash, so a rental often shows a tax loss while cash-flowing — sheltering income. Rental losses are passive: they offset passive income freely, and up to $25,000/yr can offset ordinary (W-2) income if you actively participate and your MAGI is under $100k (phasing out to $0 by $150k); unused losses carry forward. On sale, claimed depreciation is recaptured at up to 25%, and gains may owe capital-gains tax (a 1031 exchange can defer both). Figures are a year-1 estimate at your 24.0% rate — not tax advice; consult a CPA.
Schools (NCES district)
- District
- Pecos-Barstow-Toyah ISD
- NCES district ID
- 4834550
- Math proficiency
- 28% ▼ -7.00%
- Reading proficiency
- 30% ▲ 1.00%
- Median HH income
- $41,982
- Composite
- 24.61/100
- National rank
- #7632
- State rank
- #652 of 826 in TX
Livability — Town of Pecos
No livability data for this city. (Only ~50 U.S. cities are tracked.)
Census & demographics
- Census place
- Town of Pecos, TX
- City population
- 12,547
- Population (ZIP)
- 12,547
Population outlook (Reeves County) Hauer SSP2
- Today (2025)
- 17,069 people
- By 2030
- 18,407 · +7.8%
- By 2040
- 21,342 · +25.0%
- By 2050
- 24,701 · +44.7%
- By 2075
- 32,688 · +91.5%
- By 2100
- 36,117 · +111.6%
Race, ethnicity, and origin ACS 2023
- Neighborhood character
- Predominantly Hispanic (85%)
- Race & ethnicity
- Hispanic / Latino 85% Two or more races 22% White 12% Black 2% Native American 1%
- Hispanic origin (detail)
- Mexican 78%
- Common ancestry
- Iranian 1% Serbian 1%
- Foreign-born
- 19% · Canada
- Languages at home
- 38% English-only · Spanish 62%
Political lean MEDSL · Reeves
- 2024 margin
- Solid R (+36.9) · D 31.1% · R 68.0%
- 2008→2024 swing
- -42.2pp toward R · 2008: 5.2pp · 2024: -36.9pp
- All cycles
- 2024: R+36.9 2020: R+23.3 2016: D+7.6 2012: D+16.2 2008: D+5.2
Not yet ingested
- Civics
- —
Market trends
- HPI YoY
- ▼ -1.09%
- Current HPI
- 147.9377
- Rent YoY
- —
- Metro
- —
- State GDP YoY
- ▲ 3.95%
- F500 in state
- 110
Industry mix (Fortune 500 HQ in TX)
| Industry | F500 HQs | Revenue |
|---|---|---|
| Energy | 16 | $1,198B |
|
||
| Technology | 5 | $198B |
|
||
| Engineering / Construction | 4 | $72B |
|
||
| Energy Services | 3 | $60B |
|
||
| Utilities | 3 | $41B |
|
||
| Healthcare | 2 | $330B |
|
||
Price history
-10.7% since first listed3 events — show timeline
- 2026-05-18 Listed $225,000 ODMLS
- 2025-04-14 Price Changed $220,000 ODMLS
- 2025-03-13 Price Changed $252,000 ODMLS
Property tax history
+4.3%/yrLatest (2025): $1,943 · +15.4% YoY. Source: county tax records.
Cash-flow waterfall
monthlySold comps — $/sqft
last 12 mo · ≤1 miLoading sold comps…