 6-Plex
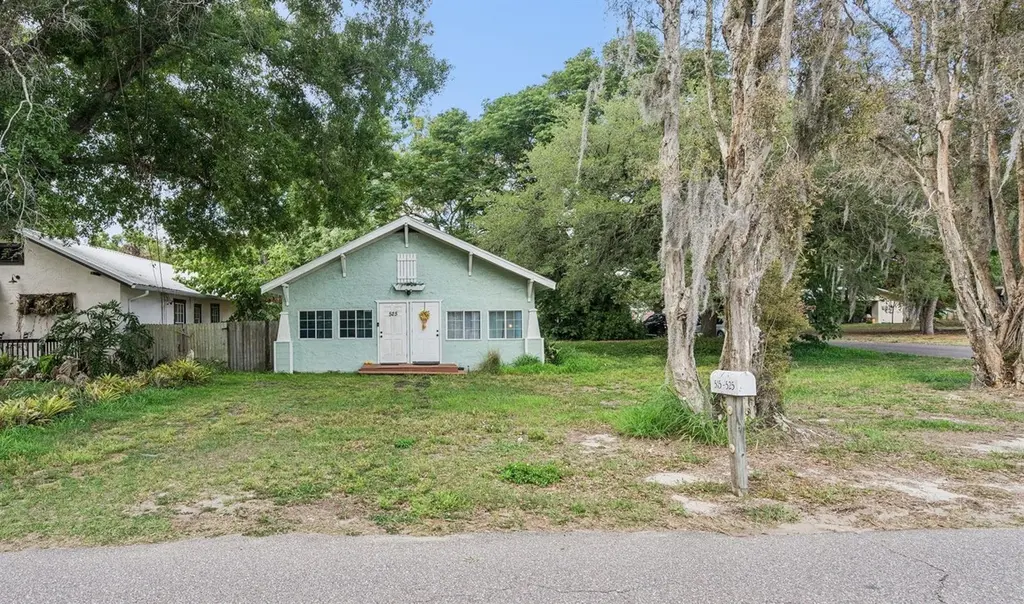
515-525 W Cummings St · Lake Alfred, FL
Flood risk 8/10 · Major
- FEMA flood zone
- X (unshaded)
- Chance of flooding over 30 yrs
- 0.78%
- Est. flood insurance / yr
- $507 – $1,088
Fire risk 3/10 · Minor
- Est. fire insurance / yr
- $947 – $1,759
Heat risk 8/10 · Major
- Hot days now (above 107°F)
- 7 days/yr
- Hot days in 30 yrs
- 23 days/yr
Wind risk 9/10 · Severe
- Chance of severe wind over 30 yrs
- 99.0%
Air-quality risk 1/10 · Minimal
- Unhealthy air days now
- 0 days/yr
- Unhealthy air days in 30 yrs
- 0 days/yr
Risk factors via First Street. Map © Google.
Why this score? — see what drove the B- grade
The composite is a weighted blend of 9 inputs, each scored 0–100. Each bar is that input's sub-score; the figure is the points it added to the 100-point composite (weight × sub-score).
- Cash flow +30.0/30.0
- 1% rule +10.0/10.0
- DSCR +10.0/10.0
- ARV discount +7.5/15.0
- Livability +3.6/5.0
- Schools +3.5/10.0
- Rent growth +2.5/5.0
- Condition / age +2.5/5.0
- Appreciation +0.0/10.0
$225,000
🖨 Deal sheet 📄 Offer letter ✓ Due diligence
Multi-family units
County records classify this as Multi-Family (2-4 Unit). Listing-text estimate: 6 units. estimate disagrees with records
Listing remarks
2019 Roof! NO HOA!! FHA/VA loan friendly! This duplex offers a rare combination of stability and flexibility, making it an ideal opportunity for both investors and owner-occupants alike. One unit is currently leased through February 28, 2027, while the second unit is on a month-to-month agreement with the tenant open to signing a new lease. Whether you are looking to expand your portfolio with reliable cash flow, house-hack by living in one unit while renting the other, Both units feature separate electric meters to minimize expenses, and the seller covers water at an average cost of less than $75 per month. With no HOA, there is room to bring your RV, boat, or trailer. Nearby outdoor ameni
Key facts
- Outdoor amenities
- Public boat ramp
- 2019 roof
Tags
Property features AI
Finance
- Other: Property zoned R-1A; Total acreage: less than 1/4 acre (approx. 0.16 acres)
- Financial info: Annual net income reported: $23,100; Tenants pay electricity
- HOA & community: No association; no association fees
Exterior
- Utilities: Public water; Septic tank sewer; Electricity connected; Water connected
- Home design: Duplex (residential income property); Single-story
- Construction: Concrete construction; Shingle roof; Crawlspace foundation; Built on one building
- Exterior features: Rear porch; Corner lot; Paved road access
Interior
- Kitchen: Dishwasher; Microwave; Range; Refrigerator; Eat-in kitchen configuration
- Bedrooms: Two total bedrooms (property-wide); units are 1-bedroom each
- Bathrooms: Each unit has 1 bathroom
- Interior features: Ceiling fans; Eat-in kitchen; Open floor plan; Wood-burning fireplace
- Laundry & utility: Washer and dryer included; Laundry located outside
Neighborhood map
What this means for you Summary
Snapshot
- This is a 6 × 2-bed/2.0-bath units multifamily listed at $225k.
Deal economics
- At list price, monthly cash flow is $5k ($64k/yr) — positive. Per door: $888/mo.
- The deal already cash-flows at list — no discount required.
- Meets the 1% rule at list price ($9k rent vs $225k).
Location & tenants
- Location reads 72/100 on livability (#363 in FL) — a middle-class / working-renter tenant base. Strengths: crime A+, cost of living A+, housing A+; Watch: schools C-, employment D, amenities F.
- Polk (suburban): math 39% / reading 43% proficiency, ranked #62 of 73 in FL (top 85%) — families likely to look elsewhere, expect single-tenant / working-renter base with shorter leases.
- Market conditions: 279 active listings in the ZIP; 7 comparable units currently listed for rent nearby; rentals at typical pace (median 24d on market — plan ~3-4 weeks tenant-placement turnaround); 10,384 units permitted in Polk County in 2024 (1,716 in 5+ unit buildings).
- At $8,765/mo this rent would consume 171% of the median local household income ($62k/yr) (locally 431% of renters already pay >50% of income on rent) — very limited rent-growth headroom before tenants either downsize or default.
Forward outlook
- Local home prices are declining (-3.0%/yr); year-one equity from $2k of loan paydown is wiped out by about $7k of value loss. Plan a longer hold.
- Polk County population projected at +33% by 2050 — long-run rental-demand tailwind backs the buy-and-hold thesis.
- At projected returns (-3.0% appreciation + 3.0% rent growth), your $63k cash investment doubles in ~2 years — after that, you're playing with house money.
Negotiation context
- Only 9 days on market — expect competitive offers; lowballing is unlikely to land.
- 2 sale attempts since 21y ago with the ask held roughly flat each time — persistent listings suggest the price (not the market) is what's stuck; bring a comps-based counter.
- Current owner paid $23k; list at $225k implies a 878% gain — meaningful room to come down on a strong offer.
Risks & watch-outs
- Watch-outs: flood insurance adds $66/mo; built in 1938 — expect roof / HVAC / electrical / plumbing capex.
- Climate carrying-cost: severe flood risk; severe wind risk, 99% chance of damaging wind over 30y; extreme-heat days projected 7→23/yr by 2055 (HVAC capex compounding) — expect insurance premiums to compound above CPI over the hold.
Questions for the listing agent
- Can we see the unit-by-unit rent roll, current vacancy, and any below-market leases? What's the average tenancy length?
- What capital expenditures (roof, boiler, parking lot, exteriors) have been made in the last 5 years, and what's planned in the next 2?
- Built in 1938 — when were the roof, HVAC, electrical panel, plumbing, and water heater last replaced?
- What's the actual annual flood-insurance premium (NFIP or private), and is the property in a SFHA with mandatory coverage?
- Is there a deadline driving the sale (1031 exchange, divorce, estate, relocation)? That informs how much negotiation room exists.
- What's the average days-on-market for RENTAL listings here right now (not sales)? A rising rental-DOM trend means longer vacancies and softer asking-rent achievability than the comps imply.
- What's the recent tenant-quality profile in this submarket — average credit score on applications, eviction rate, late-payment / NSF rate, and stable-employment percentage? A property-management company in the area should have these aggregated.
- How much new apartment / multifamily construction is in the pipeline within 1–3 miles? Heavy new supply (>2% of stock underway) typically softens rents 12–24 months out; light construction supports rent growth.
Investment metrics
- 1% rule
- 3.90% ✓
- Cap rate
- 35.05%
- Cash-on-cash
- 102.70%
- DSCR
- 5.57
- GRM
- 2.1
CMA / ARV
No comps found within radius.
Projected returns pro-forma
-3.0% appreciation · 3.0% rent growth · sell at horizon
- IRR
- —
- Equity multiple
- 5.81×
- Total profit
- $302,879
- Equity at exit
- $33,548
- IRR
- —
- Equity multiple
- 12.13×
- Total profit
- $701,137
- Equity at exit
- $19,454
Cash invested: $63,000 (down + closing). Projections, not guarantees.
Landlord ↔ Tenant lean methodology
- Overall (STATE)
- 87 Strongly Landlord-Friendly
- State Florida
- 87 Strongly Landlord-Friendly · R+3
- County
- — inherits STATE
- City
- — inherits STATE
ZIP-level market 33850
- Home prices YoY
- -8.5%
- Active inventory
- 279
- Price-to-rent
- 12.8×
Monthly cashflow live
- Estimated rent
- $8,765 high interval (Pro) →
- Mortgage (P&I)
- −$1,180
- Tax from tax record
- −$259 /mo · $3,105/yr
- Insurance
- −$94
- Flood insurance flood zone
- −$66 /mo · $798/yr
- HOA
- −$0
- Vacancy / Maint / Mgmt
- −$1,841
- Net cashflow
- $5,325
Break-even live
6-unit breakdown (identical units grouped — click to expand)
| Units | Beds | Baths | Est. rent |
|---|---|---|---|
| 6× units | 2 | 2 | $8,766 |
| #1 | 2 | 2 | $1,461 |
| #2 | 2 | 2 | $1,461 |
| #3 | 2 | 2 | $1,461 |
| #4 | 2 | 2 | $1,461 |
| #5 | 2 | 2 | $1,461 |
| #6 | 2 | 2 | $1,461 |
| Total (6 units) | $8,765 | ||
UW: 25.0% down · 7.5% · 30yr · 1.5% tax · 5.0% vac · 8.0% maint · 8.0% mgmt
Financing live
Cash to close
- Down payment
- $56,250
- Closing costs
- $6,750
- Reserves months
- —
- Total cash needed
- —
Loan-product check · same deal, 3 products live
Conventional
25% down · 7.5% · 30yr
- Down + closing
- —
- Monthly P&I
- —
- Monthly cashflow
- —
- DSCR
- —
- Eligible?
- —
Personal DTI + credit; lowest rate.
DSCR
20% down · 8.5% · 30yr
- Down + closing
- —
- Monthly P&I
- —
- Monthly cashflow
- —
- DSCR
- —
- Eligible?
- —
No personal income docs; deal must DSCR.
Hard money
10% down · 12.0% · 12mo
- Down + closing
- —
- Monthly P&I
- —
- Monthly cashflow
- —
- DSCR
- —
- Eligible?
- —
Short-term bridge; refi at stabilization.
Rent comps 7 comps
| Address | Beds | Baths | Sqft | Rent | $/sqft | DOM | Units | Dist |
|---|---|---|---|---|---|---|---|---|
| 325 W Pierce St Unit 1 Lake Alfred, FL | 2.0 | 1.0 | 800 | $1,150 | $1.44 | 3d | 1 | 0.23mi |
| 150 S Nekoma Ave Lake Alfred, FL | 2.0 | 1.0 | 750 | $1,375 | $1.83 | 23d | 1 | 0.26mi |
| 1040 S Buena Vista Dr Unit 1065 Lake Alfred, FL | 2.0 | 2.0 | 955 | $1,425 | $1.49 | 23d | 1 | 0.60mi |
| 1040 S Buena Vista Dr Unit 1036 Lake Alfred, FL | 2.0 | 2.0 | 955 | $1,445 | $1.51 | 23d | 1 | 0.60mi |
| 1040 S Buena Vista Dr Unit 1040 Lake Alfred, FL | 2.0 | 2.0 | 955 | $1,475 | $1.54 | 23d | 1 | 0.60mi |
| 505 Interlock St Lake Alfred, FL | 3.0 | 2.0 | 1443 | $1,919 | $1.33 | 3d | 1 | 0.94mi |
| 53 Sunset Cir Lake Alfred, FL | 2.0 | 1.0 | 1176 | $1,100 | $0.94 | 3d | 1 | 1.41mi |
Listing history 5 events
-
2026-05-04status Pending
-
2026-04-25$225,000 Active
-
2005-06-30historical
-
2005-03-03$69,900
-
1992-06-01soldstatus $23,000
ⓘ Source: listings_history table (triggers on properties + properties_extension) + one-shot
backfill from property_details.listing_events for pre-trigger history.
Tax reassessment forecast FL · Resets to sale price
- Current annual tax
- $3,105 · $259/mo
- Projected year-2 tax
- $3,105 · $259/mo
- Expected delta
- $0/yr ($0/mo · 0.0%)
ⓘ Screening estimate from a state-policy table — verify with the county assessor before closing.
Climate risk First Street
- Flood 8/10 Severe FEMA zone X (unshaded) · 78% chance over 30 yrs
- Wildfire 3/10 Moderate
- Heat 8/10 Severe 7 d/yr ≥107°F today · 23 d/yr by 30 yrs out
- Wind 9/10 Extreme 99% chance of damaging wind over 30 yrs
- Air quality 1/10 Low 0 unhealthy d/yr today · 0 by 30 yrs out
Nearby sold comps map
Loading sold comps map…
Walkable amenities ~0.75 mi
Loading nearby amenities…
Taxation est. · year 1
- Rental income
- $105,180
- − Mortgage interest
- −$12,603
- − Property taxes
- −$3,105
- − Insurance
- −$1,922
- − Repairs & maintenance
- −$8,414
- − Management
- −$8,414
- − Depreciation
- −$6,545
- Taxable income
- $64,174
- Est. tax owed @ 24.0%
- −$15,402
- After-tax cash flow
- $48,503/yr
For passive investors: Depreciation is non-cash, so a rental often shows a tax loss while cash-flowing — sheltering income. Rental losses are passive: they offset passive income freely, and up to $25,000/yr can offset ordinary (W-2) income if you actively participate and your MAGI is under $100k (phasing out to $0 by $150k); unused losses carry forward. On sale, claimed depreciation is recaptured at up to 25%, and gains may owe capital-gains tax (a 1031 exchange can defer both). Figures are a year-1 estimate at your 24.0% rate — not tax advice; consult a CPA.
Schools (NCES district)
- District
- Polk
- NCES district ID
- 1201590
- Math proficiency
- 39% ▼ -11.00%
- Reading proficiency
- 43% ▼ -4.00%
- Median HH income
- $43,979
- Composite
- 34.74/100
- National rank
- #5132
- State rank
- #62 of 73 in FL
Livability — Lake Alfred
- Score
- 72/100
- State rank
- #363
- US rank
- #6406
Category grades
Schools grade is shown separately in the Schools card above.
Census & demographics
- Census place
- Lake Alfred, FL
- County
- Polk County · 740,051 people
- City population
- 9,757
- Metro
- Lakeland-Winter Haven, FL
- Population (ZIP)
- 9,757
- Household income
- $61,622
- Rent vs Own
- Severe rent burden
- 431.0
Population outlook (Polk County) Hauer SSP2
- Today (2025)
- 752,975 people
- By 2030
- 804,621 · +6.9%
- By 2040
- 906,117 · +20.3%
- By 2050
- 1,000,476 · +32.9%
- By 2075
- 1,197,520 · +59.0%
- By 2100
- 1,271,518 · +68.9%
Race, ethnicity, and origin ACS 2023
- Neighborhood character
- Diverse neighborhood (Simpson 0.63)
- Race & ethnicity
- White 54% Hispanic / Latino 24% Black 11% Asian 9% Two or more races 8%
- Hispanic origin (detail)
- Mexican 3% Puerto Rican 15% Dominican 2%
- Common ancestry
- Lithuanian 2% Italian 2% Romanian 1%
- Foreign-born
- 15% · Canada, China
- Languages at home
- 72% English-only · Spanish 21% Other Asian/Pacific 2% Other Indo-European 2%
Political lean MEDSL · Polk
- 2024 margin
- Strong R (+20.7) · D 39.2% · R 59.9%
- 2008→2024 swing
- -14.6pp toward R · 2008: -6.1pp · 2024: -20.7pp
- All cycles
- 2024: R+20.7 2020: R+14.4 2016: R+14.1 2012: R+6.8 2008: R+6.1
Not yet ingested
- Civics
- —
Market trends
- HPI YoY
- ▼ -32.91%
- Current HPI
- 353.941
- Rent YoY
- —
- Metro
- Lakeland-Winter Haven, FL
- State GDP YoY
- ▲ 3.28%
- F500 in state
- 36
Industry mix (Fortune 500 HQ in FL)
| Industry | F500 HQs | Revenue |
|---|---|---|
| Industrial Technology | 2 | $29B |
|
||
| Insurance | 2 | $17B |
|
||
| Retail | 1 | $60B |
|
||
| Technology Distribution | 1 | $58B |
|
||
| Homebuilding | 1 | $35B |
|
||
| Technology Manufacturing | 1 | $35B |
|
||
Price history
+878.3% since first listed5 events — show timeline
- 2026-05-04 Pending — Stellar MLS as Distributed by MLS Grid
- 2026-04-25 Listed $225,000 Stellar MLS as Distributed by MLS Grid
- 2005-06-30 Listing Removed — Stellar MLS as Distributed by MLS Grid
- 2005-03-03 Listed $69,900 Stellar MLS as Distributed by MLS Grid
- 1992-06-01 Sold (Public Records) $23,000 Public Records
Property tax history
+15.2%/yrLatest (2025): $3,105 · +17.5% YoY. Source: county tax records.
Cash-flow waterfall
monthlySold comps — $/sqft
last 12 mo · ≤1 miLoading sold comps…